. 2021 Aug;20(8):1481-1494.
doi: 10.1158/1535-7163.MCT-20-0863. Epub 2021 May 27.

Oncolytic Vaccinia Virus Gene Modification and Cytokine Expression Effects on Tumor Infection, Immune Response, and Killing

Affiliations

Oncolytic Vaccinia Virus Gene Modification and Cytokine Expression Effects on Tumor Infection, Immune Response, and Killing

Tomoyoshi Inoue et al. Mol Cancer Ther. 2021 Aug.

Abstract

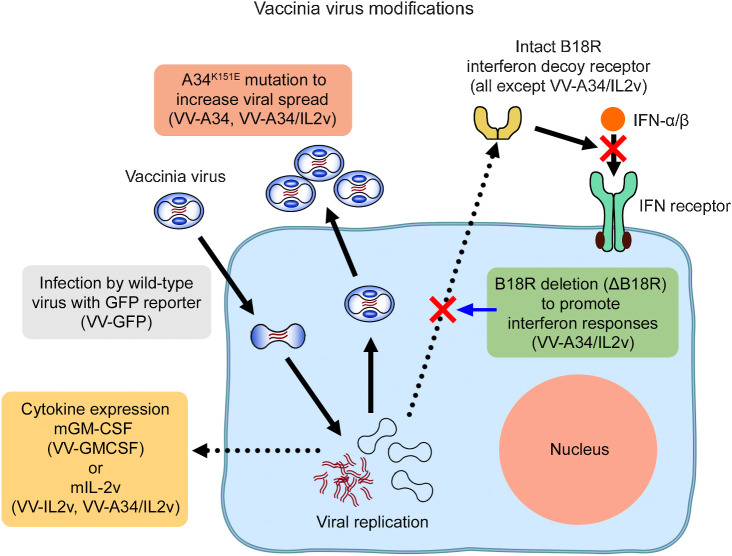
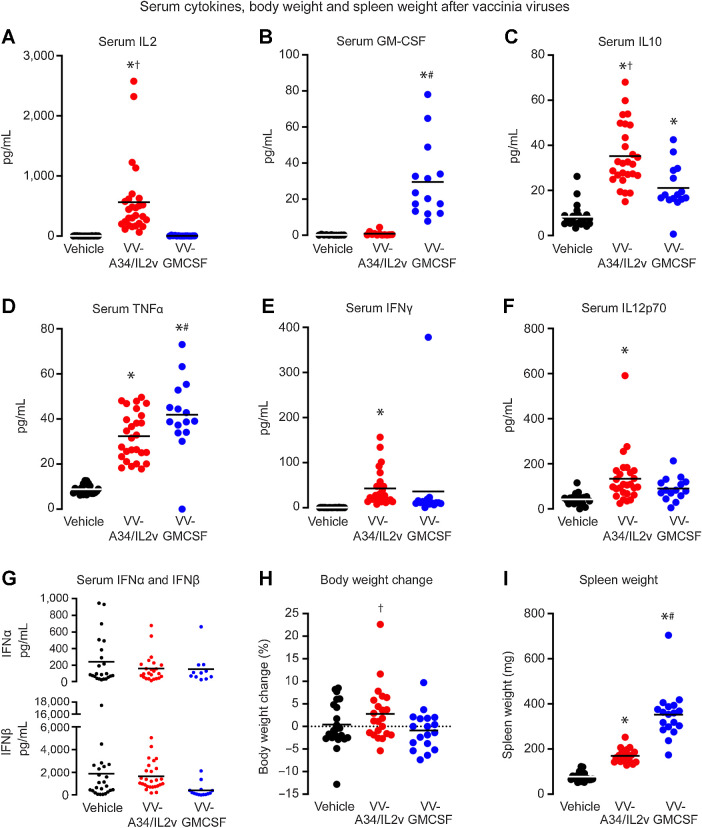
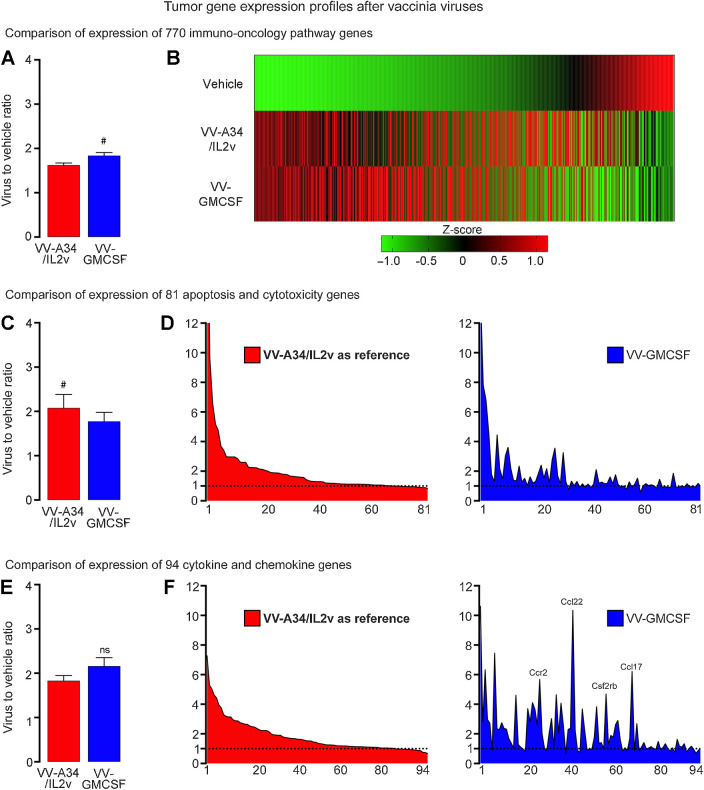
Oncolytic vaccinia viruses have promising efficacy and safety profiles in cancer therapy. Although antitumor activity can be increased by manipulating viral genes, the relative efficacy of individual modifications has been difficult to assess without side-by-side comparisons. This study sought to compare the initial antitumor activity after intravenous administration of five vaccinia virus variants of the same Western Reserve backbone and thymidine kinase gene deletion in RIP-Tag2 transgenic mice with spontaneous pancreatic neuroendocrine tumors. Tumors had focal regions of infection at 5 days after all viruses. Natural killer (NK) cells were restricted to these sites of infection, but CD8+ T cells and tumor cell apoptosis were widespread and varied among the viruses. Antitumor activity of virus VV-A34, bearing amino acid substitution A34K151E to increase viral spreading, and virus VV-IL2v, expressing a mouse IL2 variant (mIL2v) with attenuated IL2 receptor alpha subunit binding, was similar to control virus VV-GFP. However, antitumor activity was significantly greater after virus VV-A34/IL2v, which expressed mIL2v together with A34K151E mutation and viral B18R gene deletion, and virus VV-GMCSF that expressed mouse GM-CSF. Both viruses greatly increased expression of CD8 antigens Cd8a/Cd8b1 and cytotoxicity genes granzyme A, granzyme B, Fas ligand, and perforin-1 in tumors. VV-A34/IL2v led to higher serum IL2 and greater tumor expression of death receptor ligand TRAIL, but VV-GMCSF led to higher serum GM-CSF, greater expression of leukocyte chemokines and adhesion molecules, and more neutrophil recruitment. Together, the results show that antitumor activity is similarly increased by viral expression of GM-CSF or IL2v combined with additional genetic modifications.


Figures

Figure 1. Genetic modifications of vaccinia viruses. Diagram illustrating the mutations, deletions, and cytokine gene insertions and intended consequences in the five vaccinia virus variants. Reference virus VV-GFP had viral TK deletion by insertion of genes for GFP and firefly luciferase-2A as reporters. Virus VV-A34 was similar to VV-GFP but also had the A34K151E amino acid substitution to facilitate viral spread by increasing extracellular enveloped virus (6). Virus VV-IL2v had TK deletion by insertion of the gene for the soluble mouse IL2 variant (mIL2v; ref. 34). Virus VV-GMCSF had TK inactivated by insertion of the gene for mouse GM-CSF (mGM-CSF) and an LacZ reporter gene (37, 38). Virus VV-A34/IL2v had a combination of the A34K151E substitution, TK deletion by mIL2v gene insertion, B18R viral gene deletion (ΔB18R) to prevent expression of a decoy receptor that can diminish antitumor effects of IFNα, IFNβ, and other type I IFNs (12, 14), and HSV TK.007 gene insertion as a reporter (not shown).
Figure 1.
Genetic modifications of vaccinia viruses. Diagram illustrating the mutations, deletions, and cytokine gene insertions and intended consequences in the five vaccinia virus variants. Reference virus VV-GFP had viral TK deletion by insertion of genes for GFP and firefly luciferase-2A as reporters. Virus VV-A34 was similar to VV-GFP but also had the A34K151E amino acid substitution to facilitate viral spread by increasing extracellular enveloped virus (6). Virus VV-IL2v had TK deletion by insertion of the gene for the soluble mouse IL2 variant (mIL2v; ref. 34). Virus VV-GMCSF had TK inactivated by insertion of the gene for mouse GM-CSF (mGM-CSF) and an LacZ reporter gene (37, 38). Virus VV-A34/IL2v had a combination of the A34K151E substitution, TK deletion by mIL2v gene insertion, B18R viral gene deletion (ΔB18R) to prevent expression of a decoy receptor that can diminish antitumor effects of IFNα, IFNβ, and other type I IFNs (12, 14), and HSV TK.007 gene insertion as a reporter (not shown).
Figure 2. Staining for vaccinia virus and vasculature in RIP-Tag2 tumors 5 days after i.v. injection of vaccinia virus variants. A, Fluorescence microscopic images of staining for vaccinia (green) and blood vessels (CD31, red) after VV-GFP (left) or VV-A34 (right). B, Mean area density of vaccinia for all tumors in each mouse. Vaccinia staining after reference virus VV-GFP (2.8%) or virus VV-A34 (3.2%) was similar to one another but greater than the control (Vehicle). Values after VV-IL2v (5.6%) and VV-A34/IL2v (4.4%) tended to be greater but were not significantly different from VV-GFP. However, values for VV-GFP, VV-A34, and VV-IL2v were greater than for VV-GMCSF (0.5%). Student's t test: P < 0.05 compared with vehicle* or VV-GMCSF†. C-D, Confocal microscopic images of vasculature (CD31, red) and tumor cells (SV40 T-antigen, green). C, Dense vasculature of control tumor (Vehicle) compared with pruned vasculature after VV-GFP, shown with tumor cells (low magnification, top) and vessels alone (higher magnification, bottom). D, Greater reduction in tumor vascularity after VV-A34/IL2v, where the sparse vasculature is shown with tumor cells (left) and alone (higher magnification, right). E, Measurements revealed reduced vascularity after all viruses and significantly lower values after VV-A34/IL2v or VV-GMCSF. ANOVA: P < 0.05 compared to vehicle*, VV-GFP#, or VV-IL2v†. Mice per group: Vehicle (N = 18), VV-GFP (N = 7), VV-A34 (N = 11), VV-IL2v (N = 10), VV-A34/IL2v (N = 8), VV-GMCSF (N = 8). Scale bar, 200 μm in all images.
Figure 2.
Staining for vaccinia virus and vasculature in RIP-Tag2 tumors 5 days after i.v. injection of vaccinia virus variants. A, Fluorescence microscopic images of staining for vaccinia (green) and blood vessels (CD31, red) after VV-GFP (left) or VV-A34 (right). B, Mean area density of vaccinia for all tumors in each mouse. Vaccinia staining after reference virus VV-GFP (2.8%) or virus VV-A34 (3.2%) was similar to one another but greater than the control (Vehicle). Values after VV-IL2v (5.6%) and VV-A34/IL2v (4.4%) tended to be greater but were not significantly different from VV-GFP. However, values for VV-GFP, VV-A34, and VV-IL2v were greater than for VV-GMCSF (0.5%). Student's t test: P < 0.05 compared with vehicle* or VV-GMCSF. C-D, Confocal microscopic images of vasculature (CD31, red) and tumor cells (SV40 T-antigen, green). C, Dense vasculature of control tumor (Vehicle) compared with pruned vasculature after VV-GFP, shown with tumor cells (low magnification, top) and vessels alone (higher magnification, bottom). D, Greater reduction in tumor vascularity after VV-A34/IL2v, where the sparse vasculature is shown with tumor cells (left) and alone (higher magnification, right). E, Measurements revealed reduced vascularity after all viruses and significantly lower values after VV-A34/IL2v or VV-GMCSF. ANOVA: P < 0.05 compared to vehicle*, VV-GFP#, or VV-IL2v. Mice per group: Vehicle (N = 18), VV-GFP (N = 7), VV-A34 (N = 11), VV-IL2v (N = 10), VV-A34/IL2v (N = 8), VV-GMCSF (N = 8). Scale bar, 200 μm in all images.
Figure 3. CD8+ T cells in RIP-Tag2 tumors 5 days after vaccinia virus variants. A, Confocal microscopic images show CD8+ cells (green) were sparse in the control (Vehicle), more numerous after reference virus VV-GFP, and even more abundant after virus VV-A34/IL2v. Blood vessels (CD31, red). B, CD8+ cell numerical densities show greater values after all viruses than after vehicle, and greater values after VV-A34/IL2v or VV-GMCSF than other viruses. ANOVA: P < 0.05 compared to vehicle*, VV-GFP#, or VV-IL2v†. Vehicle (N = 18), VV-GFP (N = 7), VV-A34 (N = 11), VV-IL2v (N = 10), VV-A34/IL2v (N = 8), VV-GMCSF (N = 8). C, Fluorescence microscopic image of CD8+ cell clusters (green) and blood vessels (CD31, red) after VV-A34/IL2v. D and E, Flow cytometry data compare CD4+ cells and CD8+ cells identified as the live cell fraction sorted as CD45+/CD19−/NK1.1−/CD11b−/TCRB+ cells from RIP-Tag2 tumors after vehicle or VV-A34/IL2v. D, Flow cytometry dot plots and bar graphs show increases in CD4+ cells and CD8+ cells after the virus, but CD8+ cells predominated. E, CD8+ cell/CD4+ cell ratios reflect the dominance of CD8+ cells after the virus. F, Foxp3+ cell/CD4+ cell ratios show the large decrease in proportion of Foxp3+ cells after the virus. Flow cytometry counts confirmed the small, unchanged number of Foxp3+ cells (1.3 ± 0.5 virus; 1.2 ± 0.2 vehicle) and increase in CD4+ cells (395 ± 93 virus*; 120 ± 6 vehicle) after the virus. Student's t test: P < 0.05 compared with vehicle*. N = 3 mice/group. G and H, CD8+ and NKp46+ cell distribution in tumors after vehicle or VV-A34/IL2v. G, Confocal microscopic images of CD8+ cells (green) and NKp46+ cells (red) in regions of infection (top) and without infection (bottom). H, CD8+ and NKp46+ cell numerical densities in the two regions. ANOVA: P < 0.05 compared with vehicle* (same cell type) and corresponding value for NKp46+ cells#. Student's t test: P < 0.05 compared with vehicle† and corresponding value for NKp46+ cells$. N = 5 mice/group. Scale bars, 200 μm in all images.
Figure 3.
CD8+ T cells in RIP-Tag2 tumors 5 days after vaccinia virus variants. A, Confocal microscopic images show CD8+ cells (green) were sparse in the control (Vehicle), more numerous after reference virus VV-GFP, and even more abundant after virus VV-A34/IL2v. Blood vessels (CD31, red). B, CD8+ cell numerical densities show greater values after all viruses than after vehicle, and greater values after VV-A34/IL2v or VV-GMCSF than other viruses. ANOVA: P < 0.05 compared to vehicle*, VV-GFP#, or VV-IL2v. Vehicle (N = 18), VV-GFP (N = 7), VV-A34 (N = 11), VV-IL2v (N = 10), VV-A34/IL2v (N = 8), VV-GMCSF (N = 8). C, Fluorescence microscopic image of CD8+ cell clusters (green) and blood vessels (CD31, red) after VV-A34/IL2v. D and E, Flow cytometry data compare CD4+ cells and CD8+ cells identified as the live cell fraction sorted as CD45+/CD19/NK1.1/CD11b/TCRB+ cells from RIP-Tag2 tumors after vehicle or VV-A34/IL2v. D, Flow cytometry dot plots and bar graphs show increases in CD4+ cells and CD8+ cells after the virus, but CD8+ cells predominated. E, CD8+ cell/CD4+ cell ratios reflect the dominance of CD8+ cells after the virus. F, Foxp3+ cell/CD4+ cell ratios show the large decrease in proportion of Foxp3+ cells after the virus. Flow cytometry counts confirmed the small, unchanged number of Foxp3+ cells (1.3 ± 0.5 virus; 1.2 ± 0.2 vehicle) and increase in CD4+ cells (395 ± 93 virus*; 120 ± 6 vehicle) after the virus. Student's t test: P < 0.05 compared with vehicle*. N = 3 mice/group. G and H, CD8+ and NKp46+ cell distribution in tumors after vehicle or VV-A34/IL2v. G, Confocal microscopic images of CD8+ cells (green) and NKp46+ cells (red) in regions of infection (top) and without infection (bottom). H, CD8+ and NKp46+ cell numerical densities in the two regions. ANOVA: P < 0.05 compared with vehicle* (same cell type) and corresponding value for NKp46+ cells#. Student's t test: P < 0.05 compared with vehicle and corresponding value for NKp46+ cells$. N = 5 mice/group. Scale bars, 200 μm in all images.
Figure 4. Apoptosis in RIP-Tag2 tumors 5 days after vaccinia virus variants. A and B, Staining for apoptosis (activated caspase-3, red) and blood vessels (CD31, green). A, Confocal microscopic images show little apoptosis after vehicle, widespread apoptosis after reference virus VV-GFP, and even more extensive apoptosis after combination virus VV-A34/IL2v. B, Widespread apoptosis after VV-A34/IL2v. C, Activated caspase-3 in tumors of each mouse after virus or vehicle. Values after VV-GFP or A34K151E substitution virus VV-A34 were similar to one another but significantly greater than after vehicle. By comparison, values after VV-A34/IL2v or VV-GMCSF were significantly greater than after the other viruses. D, Fluorescence microscopic images of tumor after VV-A34/IL2v compare focal staining for vaccinia (green) to widespread staining for activated caspase-3 (red) in adjacent sections (white dotted line outlines tumor border). E, Staining for vaccinia (green bars) and activated caspase-3 (red bars) after vehicle and five virus variants show consistently larger amounts of apoptosis than vaccinia infection, where the ratios ranged from 6 for VV-GFP, to 16 for VV-A34/IL2v, to 143 for VV-GMCSF. ANOVA: P < 0.05 compared with vehicle*, VV-GFP#, or VV-IL2v†. Vehicle (N = 18), VV-GFP (N = 7), VV-A34 (N = 11), VV-IL2v (N = 10), VV-A34/IL2v (N = 8), VV-GMCSF (N = 8). Scale bar, 200 μm in all images.
Figure 4.
Apoptosis in RIP-Tag2 tumors 5 days after vaccinia virus variants. A and B, Staining for apoptosis (activated caspase-3, red) and blood vessels (CD31, green). A, Confocal microscopic images show little apoptosis after vehicle, widespread apoptosis after reference virus VV-GFP, and even more extensive apoptosis after combination virus VV-A34/IL2v. B, Widespread apoptosis after VV-A34/IL2v. C, Activated caspase-3 in tumors of each mouse after virus or vehicle. Values after VV-GFP or A34K151E substitution virus VV-A34 were similar to one another but significantly greater than after vehicle. By comparison, values after VV-A34/IL2v or VV-GMCSF were significantly greater than after the other viruses. D, Fluorescence microscopic images of tumor after VV-A34/IL2v compare focal staining for vaccinia (green) to widespread staining for activated caspase-3 (red) in adjacent sections (white dotted line outlines tumor border). E, Staining for vaccinia (green bars) and activated caspase-3 (red bars) after vehicle and five virus variants show consistently larger amounts of apoptosis than vaccinia infection, where the ratios ranged from 6 for VV-GFP, to 16 for VV-A34/IL2v, to 143 for VV-GMCSF. ANOVA: P < 0.05 compared with vehicle*, VV-GFP#, or VV-IL2v. Vehicle (N = 18), VV-GFP (N = 7), VV-A34 (N = 11), VV-IL2v (N = 10), VV-A34/IL2v (N = 8), VV-GMCSF (N = 8). Scale bar, 200 μm in all images.
Figure 5. Serum cytokines (pg/mL) and spleen and body weights of RIP-Tag2 mice at 5 days after vehicle, VV-A34/IL2v, or VV-GMCSF. A and B, Elevated levels of IL2 after VV-A34/IL2v (A) and GM-CSF after VV-GMCSF (B) fit with expression of these cytokines by the respective viruses. C–G, Serum IL10 (C), TNFα (D), IFNγ (E), and IL12p/70 (F) were increased after one or both viruses, but serum type I IFNs, IFNα (G, top) and IFNβ (G, bottom) were similar to vehicle after both viruses (values for these and other cytokines are in Supplementary Table S2). ANOVA: P < 0.05 compared with vehicle* (N = 11–24), VV-GMCSF† (N = 14–15), or VV-A34/IL2v# (N = 12–27). H, Percent body weight gain (mean ± SEM) over 5-day experiment was greater for mice after VV-A34/IL2v (N = 22) than after VV-GMCSF (N = 18), but did not differ from mice that received vehicle (N = 22). Student's t test: P < 0.05 compared with VV-GMCSF†. I, Spleen weight after VV-A34/IL2v (N = 20) was greater than after vehicle (N = 20) but less than after VV-GMCSF (N = 18). ANOVA: P < 0.05 compared with vehicle* or VV-A34/IL2v#.
Figure 5.
Serum cytokines (pg/mL) and spleen and body weights of RIP-Tag2 mice at 5 days after vehicle, VV-A34/IL2v, or VV-GMCSF. A and B, Elevated levels of IL2 after VV-A34/IL2v (A) and GM-CSF after VV-GMCSF (B) fit with expression of these cytokines by the respective viruses. C–G, Serum IL10 (C), TNFα (D), IFNγ (E), and IL12p/70 (F) were increased after one or both viruses, but serum type I IFNs, IFNα (G, top) and IFNβ (G, bottom) were similar to vehicle after both viruses (values for these and other cytokines are in Supplementary Table S2). ANOVA: P < 0.05 compared with vehicle* (N = 11–24), VV-GMCSF (N = 14–15), or VV-A34/IL2v# (N = 12–27). H, Percent body weight gain (mean ± SEM) over 5-day experiment was greater for mice after VV-A34/IL2v (N = 22) than after VV-GMCSF (N = 18), but did not differ from mice that received vehicle (N = 22). Student's t test: P < 0.05 compared with VV-GMCSF. I, Spleen weight after VV-A34/IL2v (N = 20) was greater than after vehicle (N = 20) but less than after VV-GMCSF (N = 18). ANOVA: P < 0.05 compared with vehicle* or VV-A34/IL2v#.
Figure 6. Gene expression profiles in RIP-Tag2 tumors 5 days after VV-A34/IL2v (red) or VV-GMCSF (blue) relative to vehicle. A and B, Expression of 770 immuno-oncology pathway genes after the two viruses compared as groups (A) and as heatmaps that show mean expression of genes converted into Z-scores (B). C and D, Expression of 81 apoptosis and cytotoxicity genes (Supplementary Table S3) compared as groups (C) and ranked from greatest to least ratio of VV-A34/IL2v to vehicle (D, left), with the same rank order used for the genes after VV-GMCSF (D, right). Value for granzyme A (Gzma) in D after VV-A34/IL2v (23.33) or VV-GMCSF (13.91) exceeded the y-axis maximum of 12 and is truncated. E and F, Expression of 94 cytokine, chemokine, and related genes (Supplementary Table S4) compared as groups (E) and ranked (F) as in C and D. High values for Ccr2, Ccl22, Csf2rb, and Ccl17 after VV-GMCSF are labeled (F, right). Wilcoxon signed-rank test: #, P < 0.05 for genes compared as groups. NS, not significant. Error bars show SEM. Vehicle (N = 5), VV-A34/IL2v (N = 5), 4 VV-GMCSF (N = 4). Horizontal dotted line marks value for vehicle group normalized to 1.0. Expression analyzed by NanoString Mouse PanCancer IO 360 Panel.
Figure 6.
Gene expression profiles in RIP-Tag2 tumors 5 days after VV-A34/IL2v (red) or VV-GMCSF (blue) relative to vehicle. A and B, Expression of 770 immuno-oncology pathway genes after the two viruses compared as groups (A) and as heatmaps that show mean expression of genes converted into Z-scores (B). C and D, Expression of 81 apoptosis and cytotoxicity genes (Supplementary Table S3) compared as groups (C) and ranked from greatest to least ratio of VV-A34/IL2v to vehicle (D, left), with the same rank order used for the genes after VV-GMCSF (D, right). Value for granzyme A (Gzma) in D after VV-A34/IL2v (23.33) or VV-GMCSF (13.91) exceeded the y-axis maximum of 12 and is truncated. E and F, Expression of 94 cytokine, chemokine, and related genes (Supplementary Table S4) compared as groups (E) and ranked (F) as in C and D. High values for Ccr2, Ccl22, Csf2rb, and Ccl17 after VV-GMCSF are labeled (F, right). Wilcoxon signed-rank test: #, P < 0.05 for genes compared as groups. NS, not significant. Error bars show SEM. Vehicle (N = 5), VV-A34/IL2v (N = 5), 4 VV-GMCSF (N = 4). Horizontal dotted line marks value for vehicle group normalized to 1.0. Expression analyzed by NanoString Mouse PanCancer IO 360 Panel.

Similar articles

Cited by

References

    1. Breitbach CJ, Burke J, Jonker D, Stephenson J, Haas AR, Chow LQ, et al. . Intravenous delivery of a multi-mechanistic cancer-targeted oncolytic poxvirus in humans. Nature 2011;477:99–102. - PubMed
    1. Lawler SE, Speranza MC, Cho CF, Chiocca EA. Oncolytic viruses in cancer treatment: a review. JAMA Oncol 2017;3:841–49. - PubMed
    1. Guo ZS, Lu B, Guo Z, Giehl E, Feist M, Dai E, et al. . Vaccinia virus-mediated cancer immunotherapy: cancer vaccines and oncolytics. J Immunother Cancer 2019;7:6. - PMC - PubMed
    1. Thorne SH. Immunotherapeutic potential of oncolytic vaccinia virus. Front Oncol 2014;4:155–55. - PMC - PubMed
    1. Breitbach CJ, Bell JC, Hwang TH, Kirn DH, Burke J. The emerging therapeutic potential of the oncolytic immunotherapeutic Pexa-Vec (JX-594). Oncolytic Virother 2015;4:25–31. - PMC - PubMed

Publication types

MeSH terms