. 2021 Jul 7;41(27):5779-5790.
doi: 10.1523/JNEUROSCI.0434-21.2021.

Regulation of Perineuronal Nets in the Adult Cortex by the Activity of the Cortical Network

Affiliations

Regulation of Perineuronal Nets in the Adult Cortex by the Activity of the Cortical Network

Gabrielle Devienne et al. J Neurosci. .

Abstract

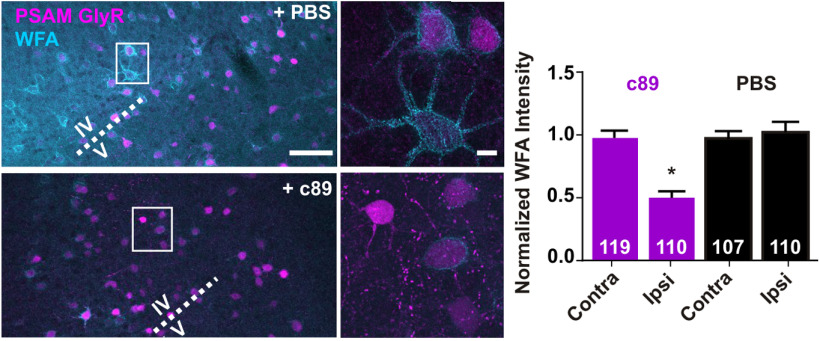
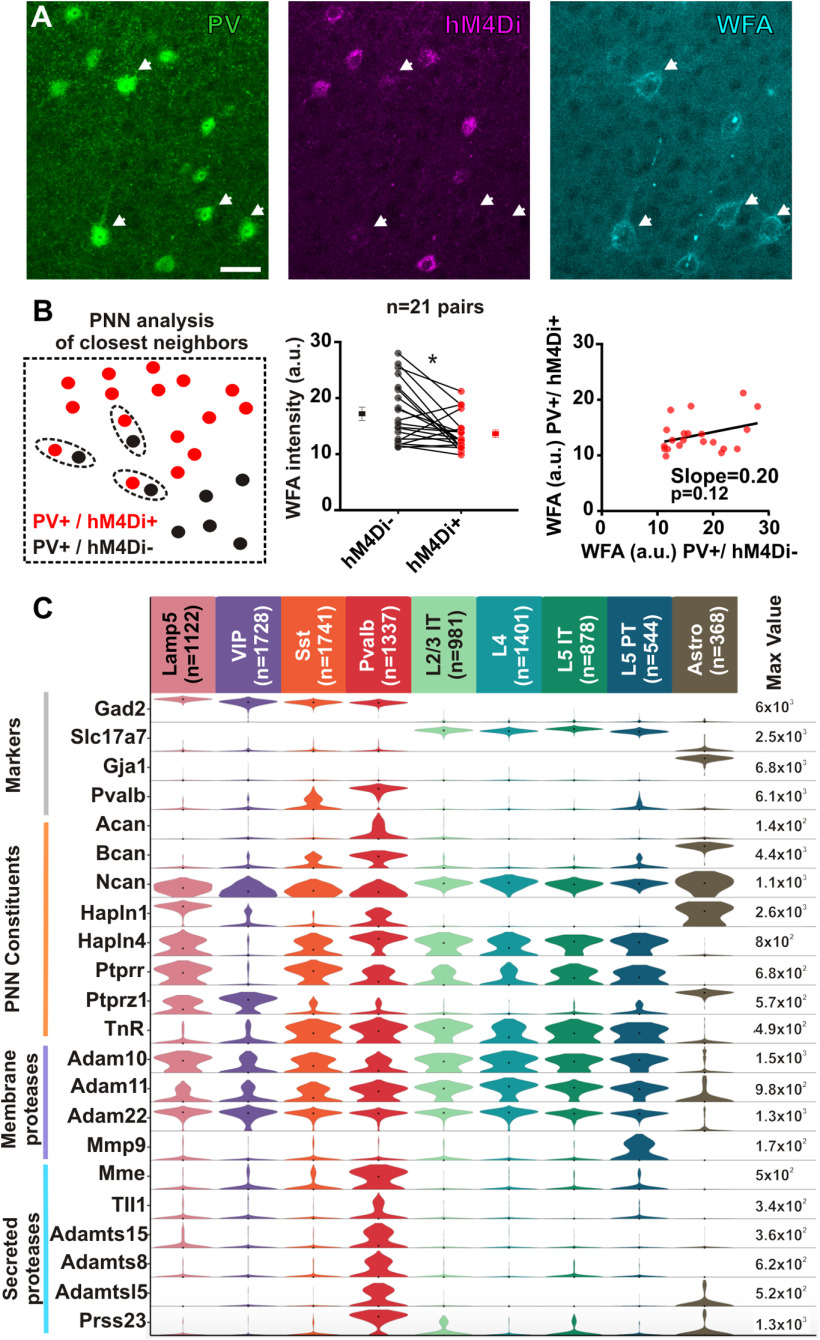
Perineuronal net (PNN) accumulation around parvalbumin-expressing (PV) inhibitory interneurons marks the closure of critical periods of high plasticity, whereas PNN removal reinstates juvenile plasticity in the adult cortex. Using targeted chemogenetic in vivo approaches in the adult mouse visual cortex, we found that transient inhibition of PV interneurons, through metabotropic or ionotropic chemogenetic tools, induced PNN regression. EEG recordings indicated that inhibition of PV interneurons did not elicit unbalanced network excitation. Likewise, inhibition of local excitatory neurons also induced PNN regression, whereas chemogenetic excitation of either PV or excitatory neurons did not reduce the PNN. We also observed that chemogenetically inhibited PV interneurons exhibited reduced PNN compared with their untransduced neighbors, and confirmed that single PV interneurons express multiple genes enabling individual regulation of their own PNN density. Our results indicate that PNN density is regulated in the adult cortex by local changes of network activity that can be triggered by modulation of PV interneurons. PNN regulation may provide adult cortical circuits with an activity-dependent mechanism to control their local remodeling.SIGNIFICANCE STATEMENT The perineuronal net is an extracellular matrix, which accumulates around individual parvalbumin-expressing inhibitory neurons during postnatal development, and is seen as a barrier that prevents plasticity of neuronal circuits in the adult cerebral cortex. We found that transiently inhibiting parvalbumin-expressing or excitatory cortical neurons triggers a local decrease of perineuronal net density. Our results indicate that perineuronal nets are regulated in the adult cortex depending on the activity of local microcircuits. These findings uncover an activity-dependent mechanism by which adult cortical circuits may locally control their plasticity.

Keywords: cerebral cortex; critical period plasticity; extracellular matrix; fast-spiking parvalbumin interneurons; perineuronal net.


Figures

Figure 1.
Figure 1.
Chemogenetic paradigm and histologic analysis of PNN density in the V1 visual cortex. A, Four weeks after hemilateral AAV injection in the V1 cortex, DREADD- or PSAM-GlyR-expressing mice received four injections of relevant agonist or PBS starting at P58, and brains were processed for histochemistry at P61. B, Macrotome fluorescence-negative picture of a coronal section of mouse brain at the level of the visual cortex showing PNN staining with WFA. The superimposed section of the mouse brain atlas delineates the densely stained V1 area flanked by V2L and V2ML areas exhibiting faint PNN labeling. Throughout this study, analyses of PNN density were performed in layers IV-V of the V1 area as represented by the red rectangle. C, PNN density analyses were performed around PV-immunopositive cells, or around cells showing expression of both PV and the chemogenetic tool, as exemplified here for the hM4Di-mCherry fusion protein. D, In order to quantify PNN density, widefield fluorescence pictures were acquired (left), background-subtracted using the Subtract Background function of the ImageJ software (middle), and PNNs were delineated manually around the soma based on WFA staining intensity (right, red lines), to create ring-shaped ROIs using the XOR function of ImageJ. Scale bars: C, D, 20 µm.
Figure 2.
Figure 2.
Targeted expression of DREADD hM4Di in PV interneurons. A, Stereotaxic injection of Cre-dependent AAV encoding hM4Di fused to mCherry in the visual cortex of PV-Cre mice. Macrotome fluorescence picture showing expression of hM4Di-mCherry revealed by anti-RFP immunohistochemistry 5 weeks after injection. The superimposed section of the mouse brain atlas represents the V1 area. B, Confocal fluorescence images acquired in the V1 cortex after dual immunostaining showing hM4Di-mCherry expression in PV-positive cells. Scale bar, 100 µm.
Figure 3.
Figure 3.
Targeted inhibition of PV interneurons using DREADD hM4Di induces PNN regression. Confocal fluorescence images acquired in the V1 cortex illustrate the PNN (WFA) surrounding hM4Di-expressing PV interneurons in layers IV-V after PBS or CNO treatment of the mice. Note the low PNN density around hM4Di+ cells after CNO treatment, as exemplified in high-magnification images. Scale bars: left, 100 µm; right, 10 µm. Plot of PNN density around PV+ (contralateral uninjected hemicortex) and hM4Di+/PV+ (ipsilateral injected) cells in the V1 cortex normalized for each mouse to mean density in contralateral hemicortex. Indicated in bars are the number of cells analyzed in 3 CNO-treated and 3 PBS-treated mice. *Significantly different from other conditions.
Figure 4.
Figure 4.
CNO decreases the excitability of hM4Di-expressing PV interneurons and reduces cortical γ oscillations. A, Patch-clamp recordings in cortical slices. Traces represent responses of a hM4Di-expressing interneuron to depolarizing current step in control conditions and on bath application of CNO (0.5 μm). CNO elicited a hyperpolarization of the membrane potential and an increase in the current needed to induce action potential firing. Plots represent parameters measured in hM4Di-expressing interneurons (n = 8). Note the large amplitude of the fast afterhyperpolarizing potentials, the quiescent periods between trains of action potentials, the modest input resistance, and the high rheobase value typical of fast-spiking PV interneurons. B, EEG recordings in the hM4Di-expressing visual hemicortex of awake PV-Cre mouse before and after consecutive intraperitoneal injections of PBS and CNO. The EEG signal was filtered to analyze oscillations in the δ 1-4 Hz, theta 6-10 Hz, γ low 30-50 Hz, γ mid 55-95 Hz, and γ high 100-150 Hz frequency ranges. Traces represent samples obtained from 1 mouse. Graphs represent mean results from 3 mice. *Significant differences.
Figure 5.
Figure 5.
Targeted excitation of glutamatergic or PV neurons using hM3Dq does not alter PNN density. A, Patch-clamp recordings in cortical slices. Traces represent responses of an hM3Dq-expressing layer V pyramidal neuron to depolarizing current steps in control conditions and on bath application of CNO (0.5 μm). CNO application elicited a depolarization of the membrane potential and a decrease of the current needed to induce action potential firing. Plots represent electrophysiological parameters measured in control and CNO conditions in hM3Dq-expressing neurons (n = 8). *Significant differences. B, Confocal fluorescence images illustrate the PNN (WFA) surrounding PV+ cells in the vicinity of hM3Dq-expressing excitatory neurons in layers IV-V of the V1 cortex of mice treated with PBS or CNO. For better visualization, top panels represent WFA and anti-PV labeling separately from hM3Dq-mCherry-positive excitatory neurons visible on bottom panels. Scale bar, 100 µm. Plot of PNN density around PV+ cells ipsilateral and contralateral to hM3Dq expression in the V1 cortex normalized for each mouse to mean density in contralateral hemicortex. Indicated in bars are the number of cells analyzed in 3 CNO-treated and 3 PBS-treated mice. C, Top confocal fluorescence images represent hM3Dq-mCherry expression in PV+ cells of the V1 cortex 5 weeks after injection of corresponding Cre-dependent AAV in a PV-Cre mouse. Bottom confocal fluorescence images represent the PNN (WFA) surrounding hM3Dq+ PV interneurons in layers IV-V after PBS or CNO treatment of the mice. Scale bars, 100 µm. Plot of PNN density around PV+ (contralateral uninjected hemicortex) and hM3Dq+/PV+ (ipsilateral injected) cells. Indicated in bars are the number of cells analyzed in 3 CNO-treated and 3 PBS-treated mice.
Figure 6.
Figure 6.
Silencing of PV interneurons by PSAM-GlyR induces PNN regression. Confocal fluorescence images in the V1 cortex illustrate the PNN (WFA) surrounding PSAM-GlyR+ cells after mice treatment with PBS or with the PSAM-GlyR agonist PSEM89S. Note the low PNN density around PSAM-GlyR+ cells after PSEM treatment, as exemplified in high-magnification images. Scale bars: left, 100 µm; right, 10 µm. Plot of PNN density around PV+ (contralateral uninjected hemicortex) and PSAM-GlyR+/PV+ (ipsilateral injected) cells in the V1 cortex. Indicated in bars are the number of cells analyzed in 3 PSEM-treated and 3 PBS-treated mice. *Significantly different from other conditions.
Figure 7.
Figure 7.
Targeted inhibition of excitatory neurons by hM4Di induces PNN regression. Confocal fluorescence images illustrate the PNN (WFA) surrounding PV+ cells in the vicinity of hM4Di-expressing excitatory neurons in layers IV-V of the V1 cortex of mice treated with PBS or CNO. Note the low PNN density around PV+ cells after CNO treatment, as exemplified in high-magnification images. Scale bars: left, 100 µm; right, 10 µm. Plot of PNN density around PV+ cells ipsilateral and contralateral to hM4Di expression normalized for each mouse to mean density in contralateral hemicortex. Indicated in bars are the number of cells analyzed in 4 CNO-treated and 3 PBS-treated mice. *Significantly different from other conditions.
Figure 8.
Figure 8.
The PNN around each PV interneuron may be regulated individually. A, Examples of the high PNN density (arrows) observed around hM4Di, or weakly hM4Di+ PV interneurons compared with the low PNN density observed around their PV+ neighbors robustly expressing hM4Di in the V1 cortex of a CNO-treated mouse. Scale bar, 20 µm. B, Comparison of PNN density within pairs of hM4Di+ and hM4Di closest neighbors PV+ cells: selection criterion (left), individual and mean WFA intensity (middle, *significant difference), and scatter plot of WFA intensity for PV interneuron pairs (right, n = 21). The slope of linear regression did not significantly differ from zero. C, Violin plots showing distributions of individual gene expression in 10,100 single cells from primary visual cortex of P56 mice. Data are from the Allen Institute. Cells are from subclasses segregated in Tasic et al. (2018) (20): GABAergic (Lamp5, Vip, Sst, and Pvalb), glutamatergic (layers 2/3 and 5 IT intratelencephalic, layer 4, layer 5 PT pyramidal tract) and astrocytes. Rows represent individual gene expression across cell types. Values (number per million reads) are displayed on a log10 scale normalized to maximum expression value for each gene (right column). Black dots represent median values. Markers: Gad2, glutamate decarboxylase; Slc17a7, vesicular glutamate transporter; Gja1, gap junction alpha1; Pvalb, PV. Lecticans: Acan, aggrecan; Bcan, brevican; Ncan, neurocan. PNN linkers: Hapln, hyaluronan and proteoglycan link protein; Ptprr and Ptprz1, Protein Tyrosine Phosphatase Receptor types R and Z1; Tnr, tenascin R. Proteases: Adam, A Disintegrin And Metalloproteases; Mmp9, membrane metallopeptidase 9; Mme, neprilysin; Tll1, tolloid-like metallopeptidase; Adamts, A Disintegrin And Metalloprotease with Thrombospondin motif; Prss23, serine protease 23.

Similar articles

Cited by

References

    1. Alexander GM, Rogan SC, Abbas AI, Armbruster BN, Pei Y, Allen JA, Nonneman RJ, Hartmann J, Moy SS, Nicolelis MA, McNamara JO, Roth BL (2009) Remote control of neuronal activity in transgenic mice expressing evolved G protein-coupled receptors. Neuron 63:27–39. 10.1016/j.neuron.2009.06.014 - DOI - PMC - PubMed
    1. Angulo MC, Lambolez B, Audinat E, Hestrin S, Rossier J (1997) Subunit composition, kinetic, and permeation properties of AMPA receptors in single neocortical nonpyramidal cells. J Neurosci 17:6685–6696. 10.1523/JNEUROSCI.17-17-06685.1997 - DOI - PMC - PubMed
    1. Angulo MC, Staiger JF, Rossier J, Audinat E (1999) Developmental synaptic changes increase the range of integrative capabilities of an identified excitatory neocortical connection. J Neurosci 19:1566–1576. 10.1523/JNEUROSCI.19-05-01566.1999 - DOI - PMC - PubMed
    1. Ascoli GA, Alonso-Nanclares L, Anderson SA, Barrionuevo G, Benavides-Piccione R, Burkhalter A, Buzsáki G, Cauli B, Defelipe J, Fairén A, Feldmeyer D, Fishell G, Fregnac Y, Freund TF, Gardner D, Gardner EP, Goldberg JH, Helmstaedter M, Hestrin S, Karube F, et al. (2008) Petilla terminology: nomenclature of features of GABAergic interneurons of the cerebral cortex. Nat Rev Neurosci 9:557–568. 10.1038/nrn2402 - DOI - PMC - PubMed
    1. Beurdeley M, Spatazza J, Lee HH, Sugiyama S, Bernard C, Di Nardo AA, Hensch TK, Prochiantz A (2012) Otx2 binding to perineuronal nets persistently regulates plasticity in the mature visual cortex. J Neurosci 32:9429–9437. 10.1523/JNEUROSCI.0394-12.2012 - DOI - PMC - PubMed

LinkOut - more resources