. 2021 Jul;31(7):1245-1257.
doi: 10.1101/gr.266528.120. Epub 2021 May 27.

Conserved noncoding sequences provide insights into regulatory sequence and loss of gene expression in maize

Affiliations

Conserved noncoding sequences provide insights into regulatory sequence and loss of gene expression in maize

Baoxing Song et al. Genome Res. 2021 Jul.

Abstract

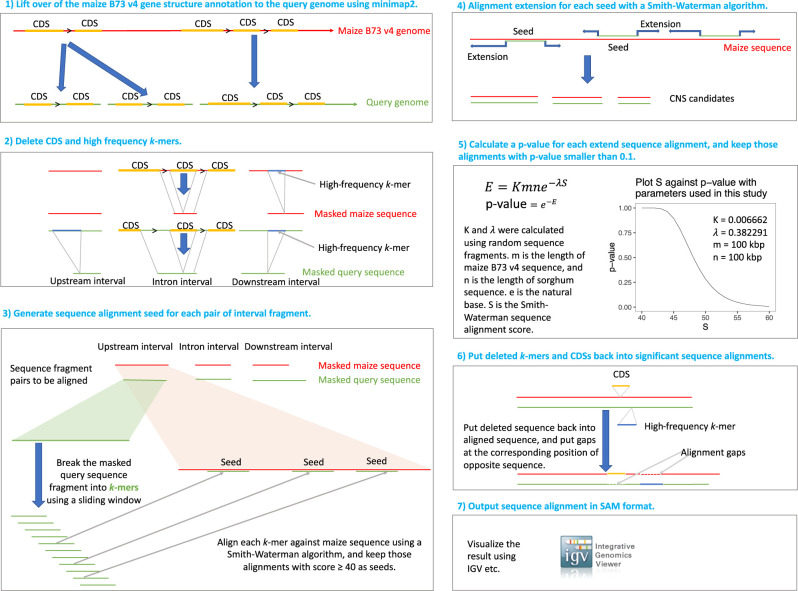
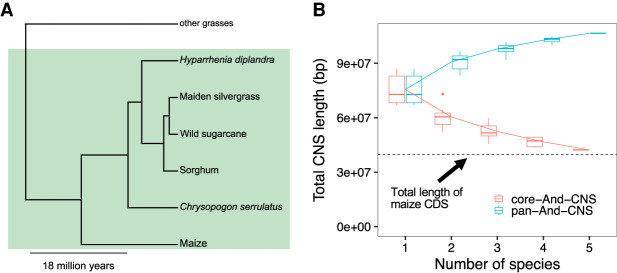
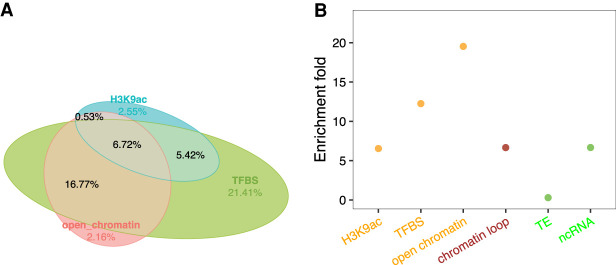
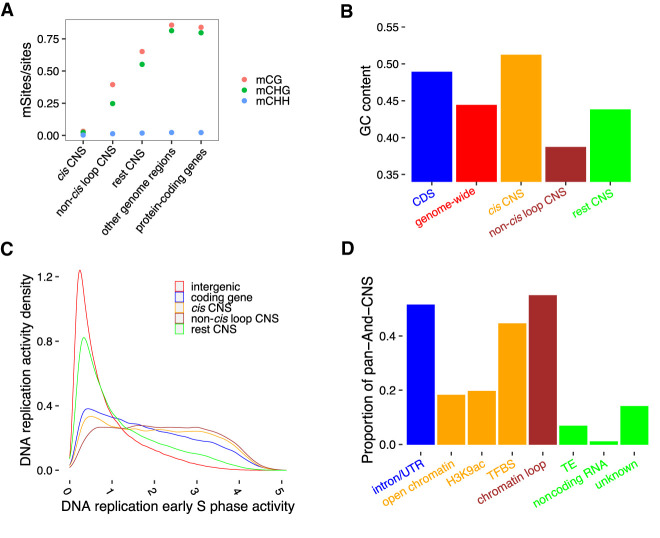
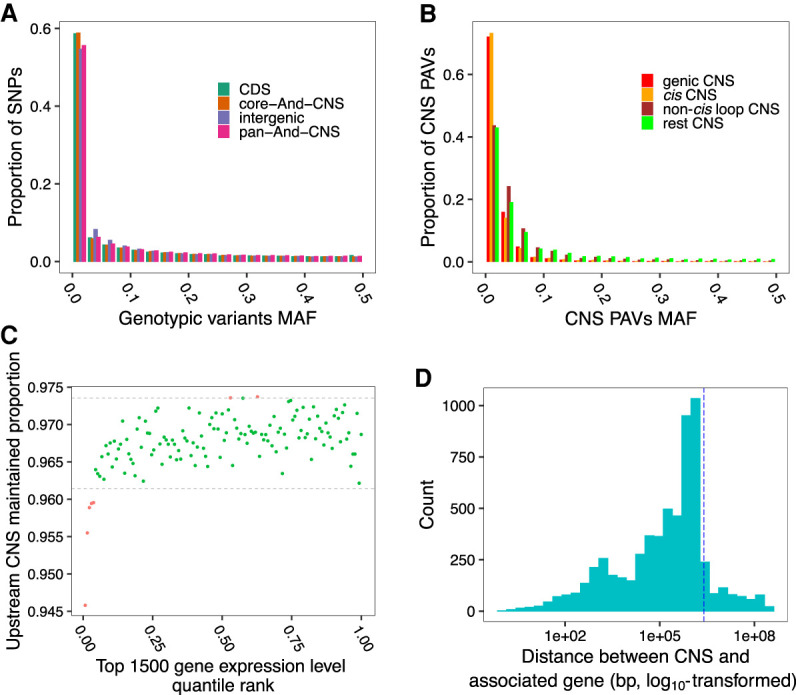
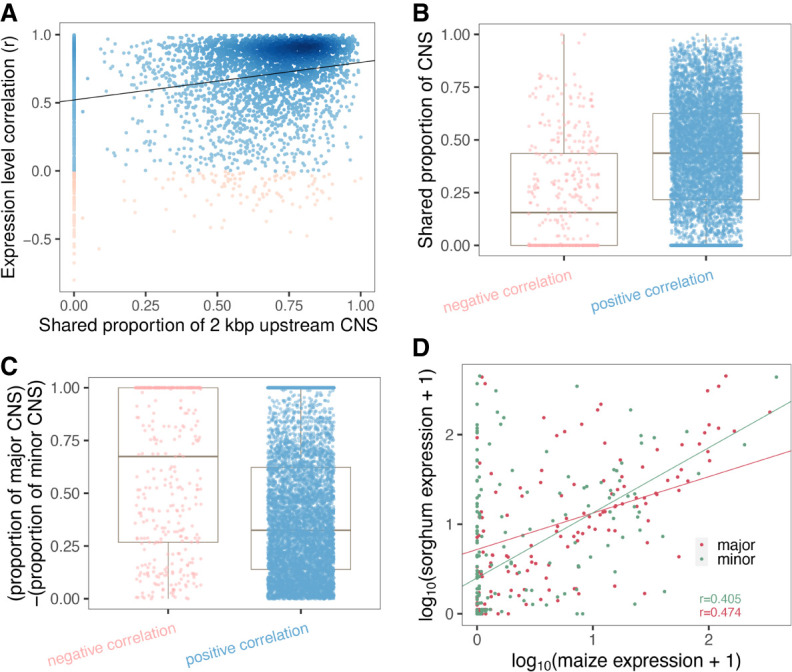
Thousands of species will be sequenced in the next few years; however, understanding how their genomes work, without an unlimited budget, requires both molecular and novel evolutionary approaches. We developed a sensitive sequence alignment pipeline to identify conserved noncoding sequences (CNSs) in the Andropogoneae tribe (multiple crop species descended from a common ancestor ∼18 million years ago). The Andropogoneae share similar physiology while being tremendously genomically diverse, harboring a broad range of ploidy levels, structural variation, and transposons. These contribute to the potential of Andropogoneae as a powerful system for studying CNSs and are factors we leverage to understand the function of maize CNSs. We found that 86% of CNSs were comprised of annotated features, including introns, UTRs, putative cis-regulatory elements, chromatin loop anchors, noncoding RNA (ncRNA) genes, and several transposable element superfamilies. CNSs were enriched in active regions of DNA replication in the early S phase of the mitotic cell cycle and showed different DNA methylation ratios compared to the genome-wide background. More than half of putative cis-regulatory sequences (identified via other methods) overlapped with CNSs detected in this study. Variants in CNSs were associated with gene expression levels, and CNS absence contributed to loss of gene expression. Furthermore, the evolution of CNSs was associated with the functional diversification of duplicated genes in the context of maize subgenomes. Our results provide a quantitative understanding of the molecular processes governing the evolution of CNSs in maize.


Figures

Figure 1.
Figure 1.
Procedures to identify CNSs in Andropogoneae. The maize B73 v4 genome was used as reference (red lines), whereas the other five genomes were individually used as a query (green lines). First, full-length CDS of each maize protein-coding gene was mapped to the query genome (CDSs belonging to the same gene are linked with “>” in the cartoon) (1); then we deleted CDSs (orange lines) and high-frequency k-mers (blue lines) (2). Next, upstream, intron, and downstream sequences were pairwise aligned using a dynamic programming algorithm (3–4). Candidate fragments below a P-value threshold (0.1) were defined as CNSs (5–7).
Figure 2.
Figure 2.
Pan-Andropogoneae CNSs. (A) Phylogenetic relationships of Andropogoneae species used in this study. Andropogoneae species are in the green shaded portion of the phylogeny. (B) Simulation of the total length of pan-And-CNSs and core-And-CNSs by iterative random sampling of taxa. Red and blue lines indicate the pan- and core-And-CNS curves fit using points from all combinations.
Figure 3.
Figure 3.
CNSs are primarily putative regulatory sequences. (A) Proportions of intergenic pan-And-CNSs overlapping with features of putative cis-regulatory sequence. (B) Enrichment of intergenic pan-And-CNSs in open chromatin regions, TFBSs (transcription factor binding sites), H3K9ac (acetylation of histone 3 lysine 9) ChIP-seq peaks, chromatin loop anchors, TEs (transposable elements), and noncoding RNA (ncRNA) genes.
Figure 4.
Figure 4.
Patterns of DNA methylation and GC content in CNSs suggest diverse functions. (A) Different DNA methylation ratios among pan-And-CNS groups. Red dots correspond to CG DNA methylation, green dots are CHG DNA methylation, and blue dots represent CHH DNA methylation (where “H” indicates A, C, or T). “other genome regions” on the horizontal axis represents DNA methylation sites located in the intergenic regions that were not defined as CNSs, and “protein-coding genes” denotes DNA methylation sites located within CDSs, introns, or UTR regions of coding genes. (B) Different groups of pan-And-CNSs (indicated in orange, brown, and green) have distinct GC content when compared with CDSs (blue) or the genome-wide (red). (C) Overlap of CDS regions, cis, non-cis loop, and rest pan-And-CNSs with active regions of DNA replication in the early S phase of the mitotic cell cycle. Sequences that did not overlap with coding genes or CNSs were used as background (intergenic). (D) The proportion of pan-And-CNSs overlapping with annotated features. Each CNS can overlap with multiple features. Unknown CNSs are those CNSs that do not overlap with any used features.
Figure 5.
Figure 5.
Variants in CNS regions impact gene expression. (A) MAF distribution of HapMap3 variants in CNS regions, genome-wide CDS regions, and genome-wide intergenic regions. (B) MAF distribution of CNS PAVs in genic, cis, non-cis loop, and rest CNS groups. (C) Comparison of the proportion of maintained CNSs in the 2-kbp upstream regions of the top 1500 expressed genes in root tissues in each maize accession. Dotted lines indicate the 99% one-tailed confidence interval calculated by shuffling the gene expression ranks and CNS maintained proportions 1000 times. Red dots are beyond the 99% one-tailed intervals. Similar patterns were observed across different tissues (Supplemental Fig. S18). (D) Histogram of the distance between CNS PAVs and associated genes for root expression data when a PAV and its associated genes are on the same chromosome. The vertical dotted line indicates a distance of 2.5 Mbp.
Figure 6.
Figure 6.
CNS variation is associated with expression diversity between paralogous genes in maize. (A) Correlation of CNS similarity and expression similarity of paralogous gene pairs. Red dots indicate negatively correlated genes; blue dots indicate positively correlated genes across tissues. (B) The shared proportion of CNS sites for negatively (red) and positively (blue) correlated paralogous gene pairs. (C) The diversity of CNS maintained by the maize major copy and minor copy for negatively (red) and positively (blue) correlated gene pairs. (D) Correlation of expression levels of the maize major copy genes with their sorghum homologous genes (red) and minor copy genes with their sorghum homologous genes (green) in shoots for genes with negatively correlated expression patterns across maize tissues in panel A.

References

    1. Akua T, Berezin I, Shaul O. 2010. The leader intron of AtMHX can elicit, in the absence of splicing, low-level intron-mediated enhancement that depends on the internal intron sequence. BMC Plant Biol 10: 93. 10.1186/1471-2229-10-93 - DOI - PMC - PubMed
    1. Alachiotis N, Pavlidis P. 2018. RAiSD detects positive selection based on multiple signatures of a selective sweep and SNP vectors. Commun Biol 1: 79. 10.1038/s42003-018-0085-8 - DOI - PMC - PubMed
    1. Algama M, Tasker E, Williams C, Parslow AC, Bryson-Richardson RJ, Keith JM. 2017. Genome-wide identification of conserved intronic non-coding sequences using a Bayesian segmentation approach. BMC Genomics 18: 259. 10.1186/s12864-017-3645-2 - DOI - PMC - PubMed
    1. Altschul SF, Gish W, Miller W, Myers EW, Lipman DJ. 1990. Basic local alignment search tool. J Mol Biol 215: 403–410. 10.1016/S0022-2836(05)80360-2 - DOI - PubMed
    1. Avsec Ž, Weilert M, Shrikumar A, Krueger S, Alexandari A, Dalal K, Fropf R, McAnany C, Gagneur J, Kundaje A, et al. 2021. Base-resolution models of transcription-factor binding reveal soft motif syntax. Nat Genet 53: 354–366. 10.1038/s41588-021-00782-6 - DOI - PMC - PubMed