. 2021 May 27;12(1):3188.
doi: 10.1038/s41467-021-23384-6.

Chromosomal copy number heterogeneity predicts survival rates across cancers

Affiliations

Chromosomal copy number heterogeneity predicts survival rates across cancers

Erik van Dijk et al. Nat Commun. .

Abstract

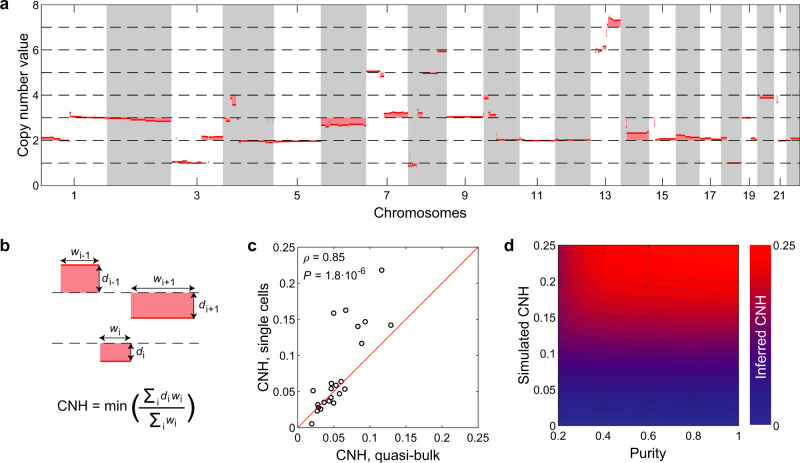
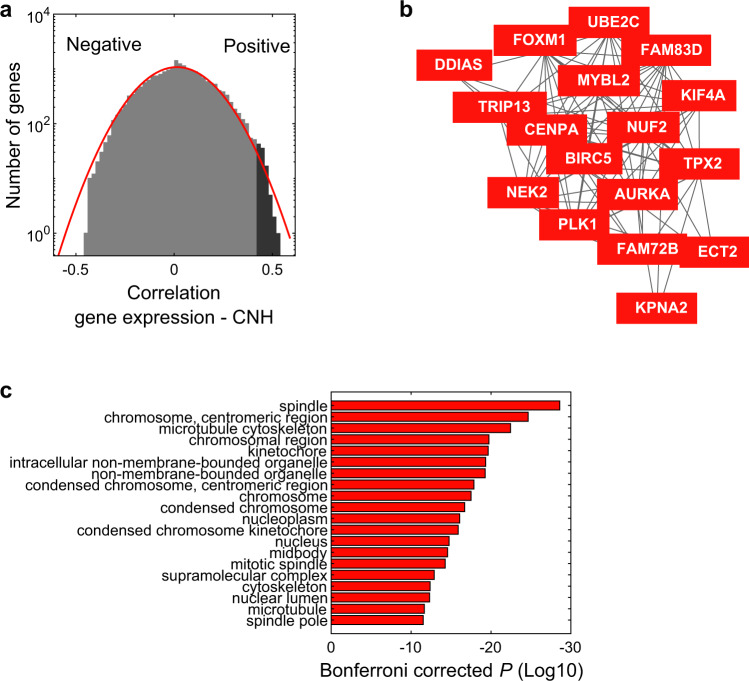
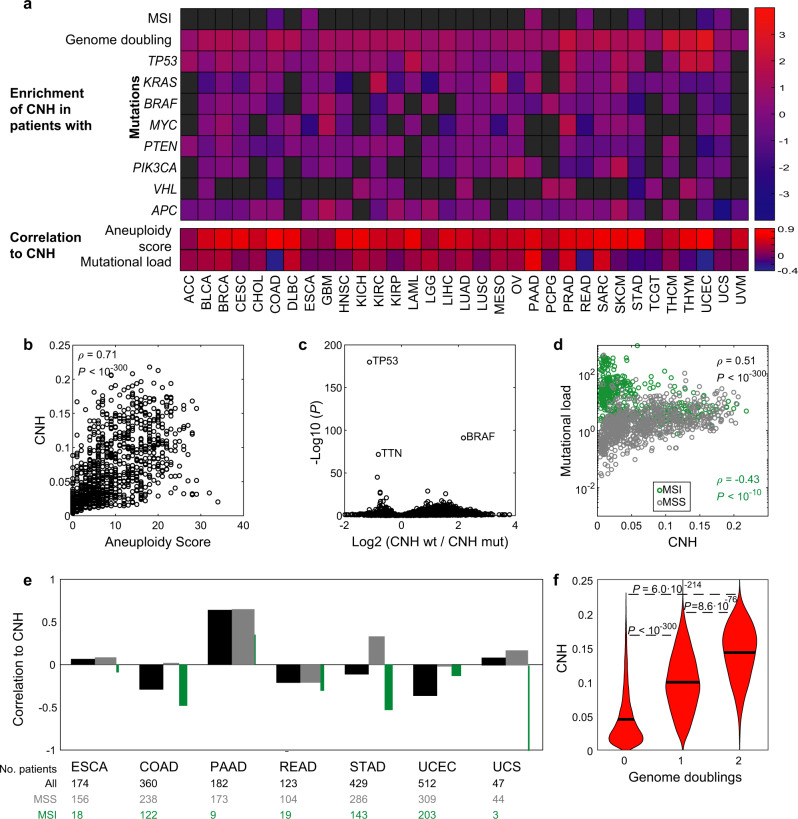
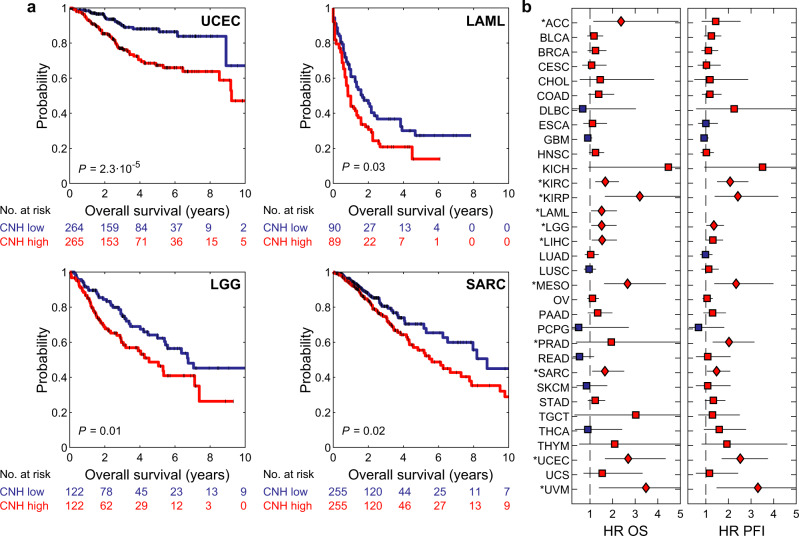
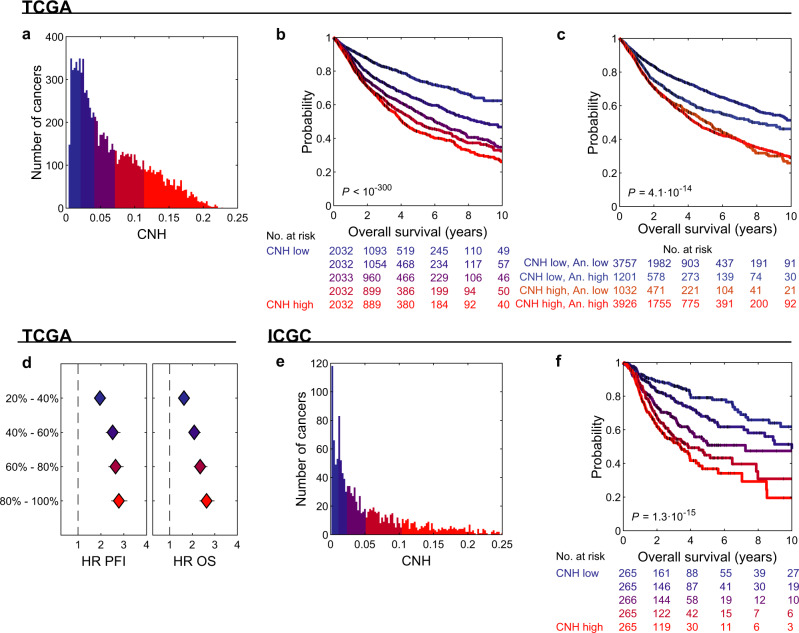
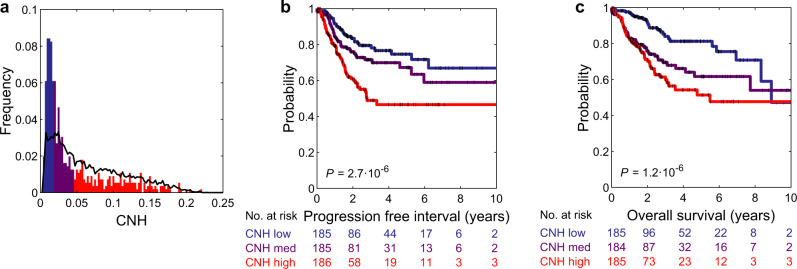
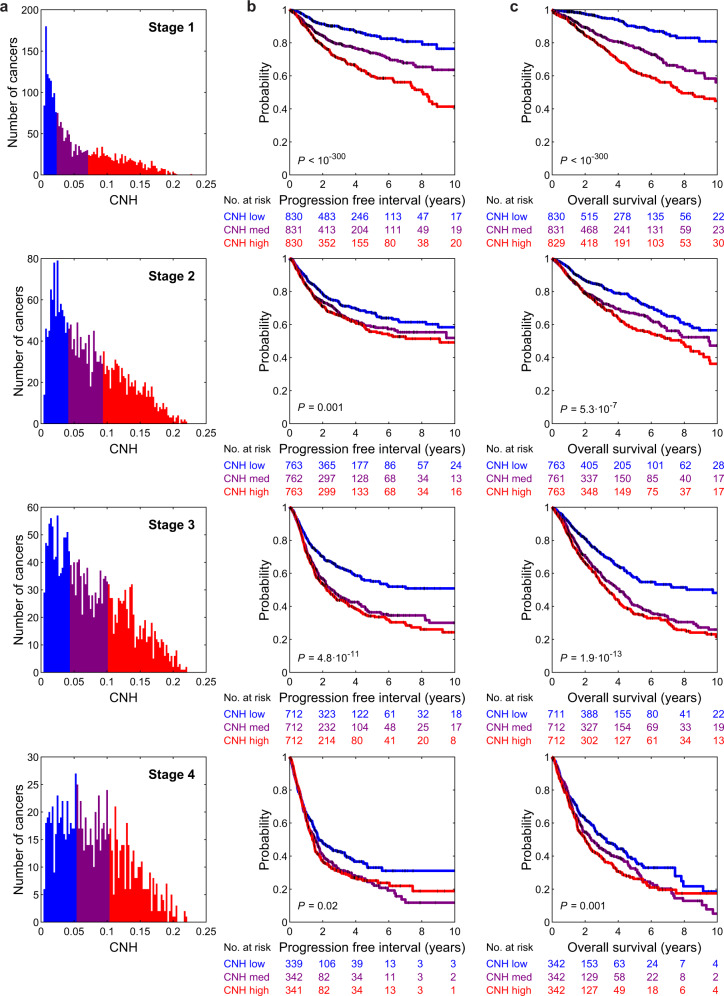
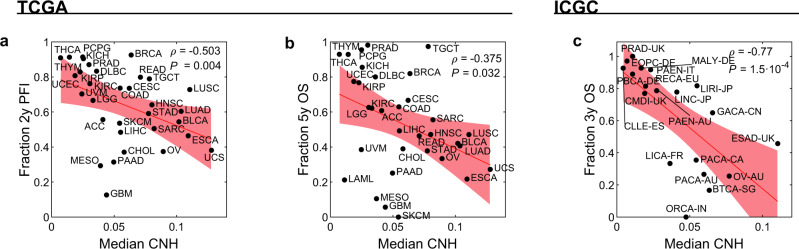
Survival rates of cancer patients vary widely within and between malignancies. While genetic aberrations are at the root of all cancers, individual genomic features cannot explain these distinct disease outcomes. In contrast, intra-tumour heterogeneity (ITH) has the potential to elucidate pan-cancer survival rates and the biology that drives cancer prognosis. Unfortunately, a comprehensive and effective framework to measure ITH across cancers is missing. Here, we introduce a scalable measure of chromosomal copy number heterogeneity (CNH) that predicts patient survival across cancers. We show that the level of ITH can be derived from a single-sample copy number profile. Using gene-expression data and live cell imaging we demonstrate that ongoing chromosomal instability underlies the observed heterogeneity. Analysing 11,534 primary cancer samples from 37 different malignancies, we find that copy number heterogeneity can be accurately deduced and predicts cancer survival across tissues of origin and stages of disease. Our results provide a unifying molecular explanation for the different survival rates observed between cancer types.


Conflict of interest statement

E.v.D., B.Y., L.V. and D.M.M. are listed as inventors in a pending patent application (NL82151) filed by Oncode Institute on behalf of the Academisch Medisch Centrum, covering the content of the paper. The remaining authors declare no competing interests.

Figures

Fig. 1
Fig. 1. Intra-tumour heterogeneity measurement from single copy number profile.
a Example of an absolute copy number profile. Deviations of absolute copy numbers from integer values are indicated by the shaded areas and reflect heterogeneity. b Scheme showing the formal definition of copy number heterogeneity (CNH). The minimum is taken over purity and ploidy. w, segment width. d, distance of segment to the closest integer. c CNH obtained from the pooled reads of single cells (quasi-bulk) correlates well to CNH determined from direct comparison of karyotypes of individual cells. Spearman’s rank correlation is reported. Red line is the diagonal, ‘CNH, single cell’ = ‘CNH, quasi-bulk’. d CNH of simulated copy number profiles can be accurately inferred, independent of tumour purity. Source data are provided as a Source Data file.
Fig. 2
Fig. 2. Chromosomal instability underlies CNH.
a Histogram showing Spearman’s rank correlations of gene expressions to copy number heterogeneity (CNH). The correlation is calculated for all genes, on 8968 primary cancer samples in TCGA, which have combined copy number and gene-expression data. The red line is a Gaussian fit to the distribution. b Co-functionality analysis reveals a cluster of genes positively correlated with CNH. c Most significant cellular component gene ontologies of the genes most positively correlated with CNH (ρ > 0.42) indicated by the dark-grey colour in a. Source data are provided as a Source Data file.
Fig. 3
Fig. 3. Genetic characterization of CNH.
a Genomic associations per type for all 33 cancer types in TCGA. Upper panel: enrichment of copy number heterogeneity (CNH) in microsatellite-instable (MSI), genome-doubled or mutated cancers versus non-MSI, non-genome-doubled and non-mutated cancers, respectively. The enrichment of CNH is defined as the log2 of the ratio between group medians with and without event. Lower panel: Spearman’s rank correlation of CNH to aneuploidy and mutational load per cancer type. b Pan-cancer Spearman’s rank correlation between CNH and the aneuploidy score. c Identification of mutated genes related to CNH in a pan-cancer setting. Malignancies are grouped as wild type or mutated for each gene. The relative difference in median CNH of these groups (horizontal axis) and the corresponding significance calculated by the Wilcoxon rank-sum test (vertical axis) are shown. d Spearman’s rank correlation between CNH and mutational load in MSI tumours (green) and non-MSI cancers (grey). e Spearman’s rank correlation between CNH and mutational load per cancer type for all tumours (black), non-MSI tumours (grey) and MSI tumours (green). The relative width of the grey and green bars reflects the ratio of MSI/non-MSI tumours in each type. f Malignancies that have undergone genome doubling have a higher CNH. Groups are compared by the Wilcoxon rank-sum test. Source data are provided as a Source Data file.
Fig. 4
Fig. 4. CNH is prognostic for survival in most types of cancer.
a Kaplan–Meier plots of overall survival for uterine corpus endometrial cancer (UCEC), sarcoma (SARC), low-grade glioma (LGG) and acute myeloid leukaemia (LAML). The homogeneous (blue lines) and heterogeneous (red lines) groups were compared by the two-sided log-rank test. b Hazard ratios (HR) of copy number heterogeneity (CNH) for overall survival (OS, left panel) and progression-free interval (PFI, right panel) of all 33 cancer types in TCGA. Hazard ratios were calculated using univariate Cox proportional-hazard models. Red (blue) symbol indicates that the CNH-high (low) group has poorer survival. Significance is indicated by diamonds and marked with an asterisk per type. Error bars represent 95% confidence intervals of hazard ratios as given by the two-sided Wald test. Patients are split in two groups of equal size based on rank-ordered CNH in these survival analyses. Source data are provided as a Source Data file.
Fig. 5
Fig. 5. CNH predicts pan-cancer survival rates.
a Distribution of copy number heterogeneity (CNH) of 10,208 primary cancers with copy number data in TCGA. b Kaplan–Meier plots of overal survival (OS) of patients split into five groups of equal size based on rank-ordered CNH of their primary cancer. The most homogeneous and most heterogeneous groups are compared by the two-sided log-rank test. c Kaplan–Meier plots of OS of CNH and aneuploidy score low/high cross groups. CNH and aneuploidy score are each split at the median value. The CNH-high, aneuploidy-low and CNH-low, aneuploidy-high groups are compared by the two-sided log-rank test. d Hazard ratios of CNH groups for progression-free interval (PFI, left panel) and OS (right panel). Hazard ratios were calculated using Cox proportional-hazard model for each group relative to the 20% most homogeneous patients. Error bars represent 95% confidence intervals of hazard ratios as given by the 2-sided Wald test. The colours in b and d correspond to the CNH groups as indicated in (a). e Distribution of CNH of 1326 primary cancers with copy number data in ICGC. f Kaplan–Meier plots of OS of patients split into five groups of equal size based on rank-ordered CNH of their primary cancer. The most homogeneous and most heterogeneous groups are compared by the two-sided log-rank test. The colours in f correspond to the CNH groups as indicated in (e). Source data are provided as a Source Data file.
Fig. 6
Fig. 6. Distribution of CNH and survival curves of microsatellite-instable cancers.
a Distribution of copy number heterogeneity (CNH) for 558 microsatellite-instable (MSI) tumours (bars) versus all 10,208 primary cancers (line) in TCGA. Kaplan–Meier plots of progression-free interval (b) and overall survival (c). Patients with MSI tumours are split into three groups of equal size based on rank-ordered CNH in the survival analysis. The most homogeneous (blue) and most heterogeneous (red) groups are compared by the two-sided log-rank test. Source data are provided as a Source Data file.
Fig. 7
Fig. 7. CNH increases with stage and is predictive within each stage.
a Distribution of copy number heterogeneity (CNH) per stage, for 7792 primary cancers in TCGA with known stage and copy number data. Kaplan–Meier plots of progression-free interval (b) and overall survival (c). Per stage, patients are split into three groups of equal size based on rank-ordered CNH in the survival analysis. The most homogeneous (blue) and most heterogeneous (red) groups are compared by the two-sided log-rank test. Source data are provided as a Source Data file.
Fig. 8
Fig. 8. CNH predicts survival rates of cancer types.
Median copy number heterogeneity (CNH) versus the fraction of patients with 2-year progression-free interval (PFI, a) and 5-year overall survival (OS, b) for each cancer type in TCGA. Spearman’s rank correlation is reported. The red line (shade) is a linear fit (95% confidence interval). c Median CNH versus the fraction of patients with 3-year OS for each study in ICGC. Spearman’s rank correlation is reported. The red line (shade) is a linear fit (95% confidence interval). Source data are provided as a Source Data file.

Similar articles

Cited by

References

    1. The ICGC/TCGA Pan-Cancer Analysis of Whole Genomes Consortium. Pan-cancer analysis of whole genomes. Nature578, 82–93, 10.1038/s41586-020-1969-6 (2020). - PubMed
    1. Haigis KM, Cichowski K, Elledge SJ. Tissue-specificity in cancer: the rule, not the exception. Science. 2019;363:1150–1151. doi: 10.1126/science.aaw3472. - DOI - PubMed
    1. Marusyk A, Janiszewska M, Polyak K. Intratumor heterogeneity: the Rosetta stone of therapy resistance. Cancer Cell. 2020;37:471–484. doi: 10.1016/j.ccell.2020.03.007. - DOI - PMC - PubMed
    1. McGranahan N, Swanton C. Biological and therapeutic impact of intratumor heterogeneity in cancer evolution. Cancer Cell. 2015;27:15–26. doi: 10.1016/j.ccell.2014.12.001. - DOI - PubMed
    1. Reiter JG, et al. An analysis of genetic heterogeneity in untreated cancers. Nat. Rev. Cancer. 2019;19:639–650. doi: 10.1038/s41568-019-0185-x. - DOI - PMC - PubMed

Publication types

MeSH terms