

Space-time characterization of community noise and sound sources in Accra, Ghana
- PMID: 34045545
- PMCID: PMC8160008
- DOI: 10.1038/s41598-021-90454-6
Space-time characterization of community noise and sound sources in Accra, Ghana
Abstract
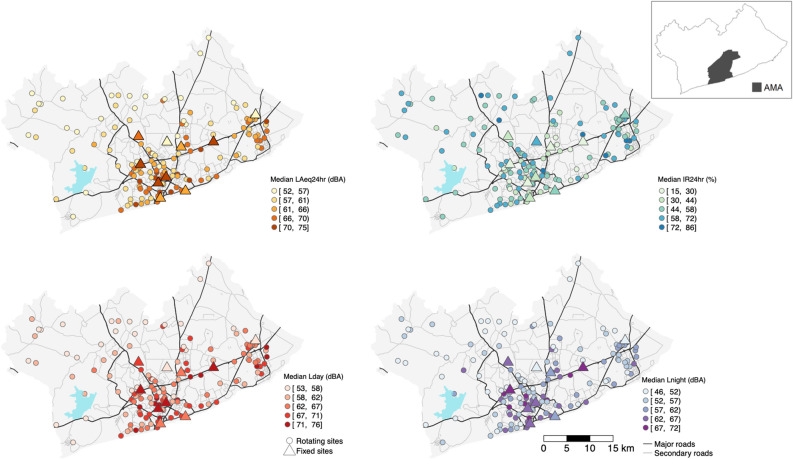
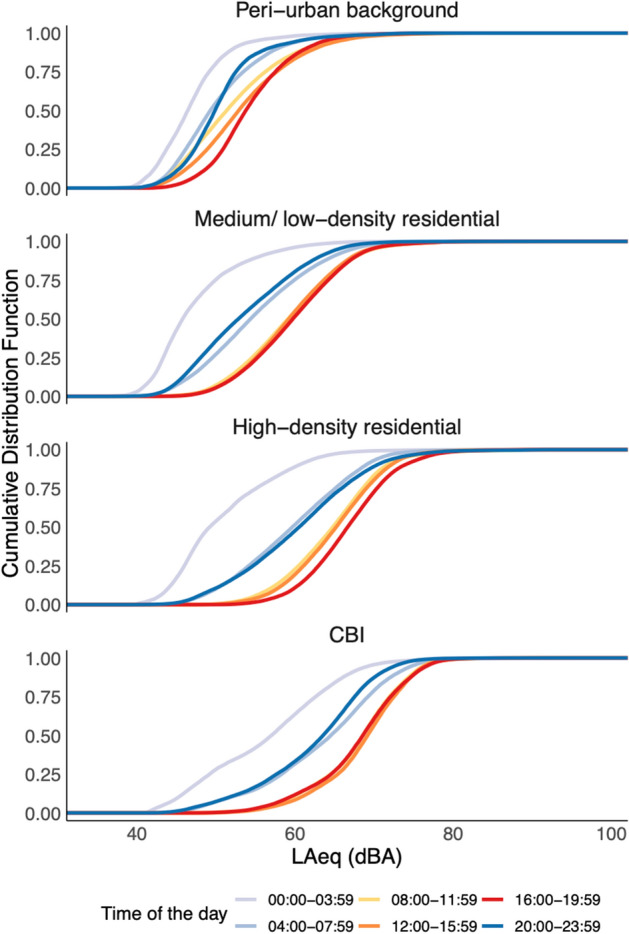
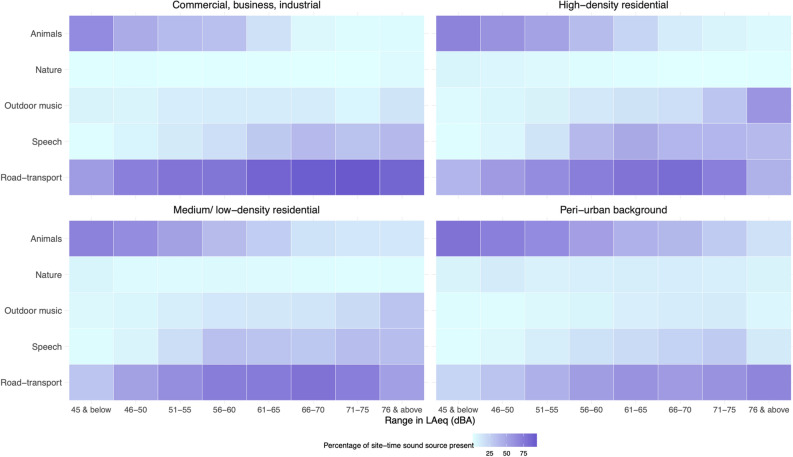
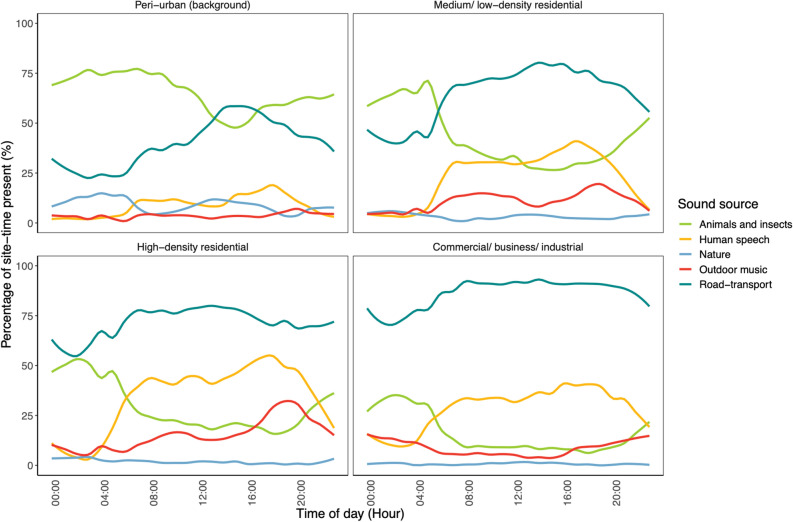
Urban noise pollution is an emerging public health concern in growing cities in sub-Saharan Africa (SSA), but the sound environment in SSA cities is understudied. We leveraged a large-scale measurement campaign to characterize the spatial and temporal patterns of measured sound levels and sound sources in Accra, Ghana. We measured sound levels and recorded audio clips at 146 representative locations, involving 7-days (136 locations) and 1-year measurements between 2019 and 2020. We calculated metrics of noise levels and intermittency and analyzed audio recordings using a pre-trained neural network to identify sources. Commercial, business, and industrial areas and areas near major roads had the highest median daily sound levels (LAeq24hr: 69 dBA and 72 dBA) and the lowest percentage of intermittent sound; the vice-versa was found for peri urban areas. Road-transport sounds dominated the overall sound environment but mixtures of other sound sources, including animals, human speech, and outdoor music, dominated in various locations and at different times. Environmental noise levels in Accra exceeded both international and national health-based guidelines. Detailed information on the acoustical environmental quality (including sound levels and types) in Accra may guide environmental policy formulation and evaluation to improve the health of urban residents.
Conflict of interest statement
The authors declare no competing interests.
Figures
References
-
- United Nations. World Urbanization Prospects. https://population.un.org/wup/Publications/Files/WUP2018-KeyFacts.pdf (2018).
-
- Onuu MU. Road traffic noise in Nigeria: Measurements, analysis and evaluation of nuisance. J. Sound Vib. 2000;233:391–405. doi: 10.1006/jsvi.1999.2832. - DOI
-
- Wawa EA, Mulaku GC. Noise pollution mapping using GIS in Nairobi, Kenya. J. Geogr. Inf. Syst. 2015;07:486–493.
Publication types
Grants and funding
LinkOut - more resources
Full Text Sources
Other Literature Sources
Research Materials
