. 2021 May 27;11(1):11254.
doi: 10.1038/s41598-021-90579-8.

Faster life history strategy manifests itself by lower age at menarche, higher sexual desire, and earlier reproduction in people with worse health

Affiliations

Faster life history strategy manifests itself by lower age at menarche, higher sexual desire, and earlier reproduction in people with worse health

Kateřina Sýkorová et al. Sci Rep. .

Abstract

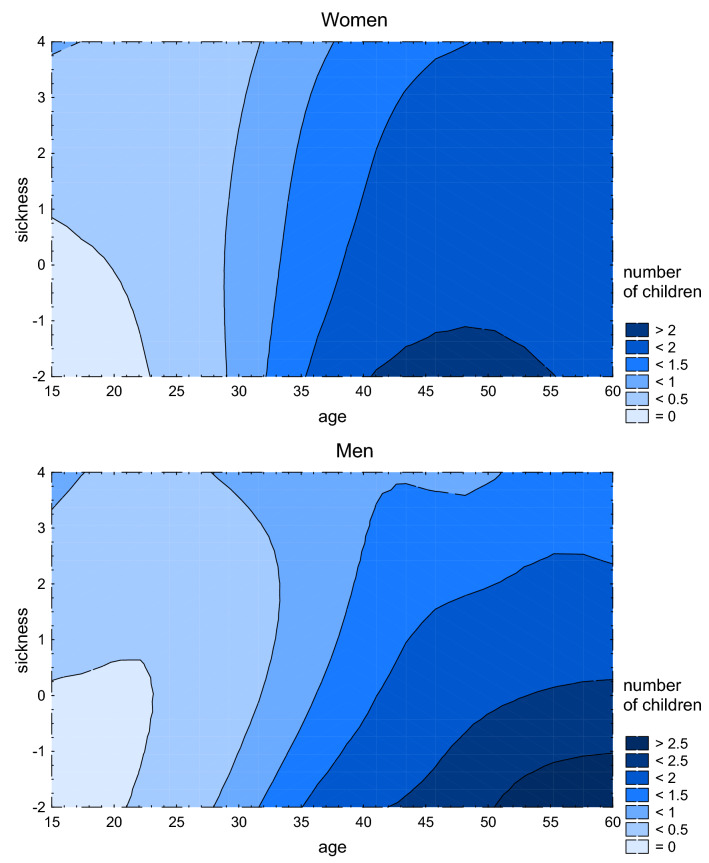
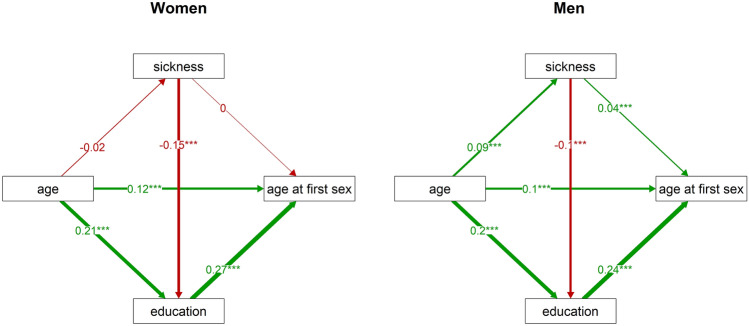
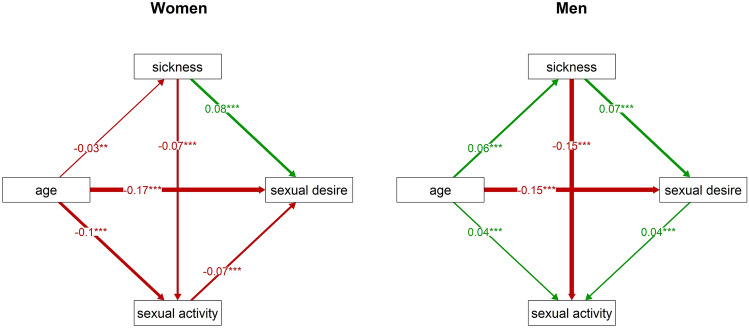
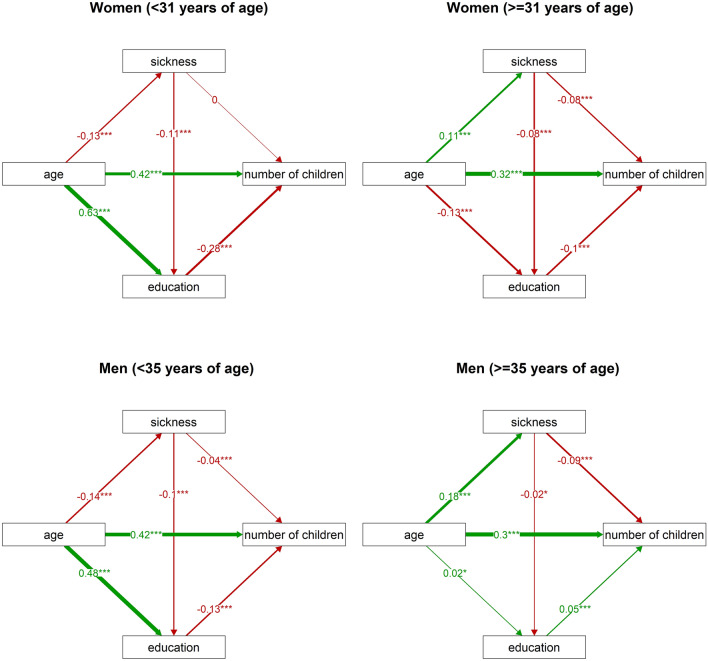
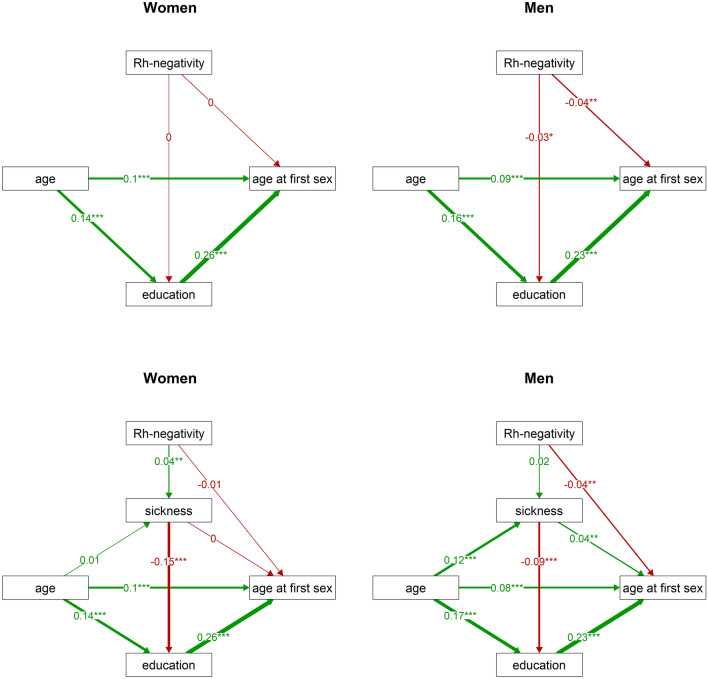
Factors which indicate lower life expectancy also induce switching to a faster life strategy, that is, a higher investment in current reproduction at the expense of future reproduction and body maintenance. We tested a hypothesis according to which impairment of individual health serves as a signal for switching to a faster life strategy using online-gathered data from 32,911 subjects. Worse health was associated with lower age at menarche and earlier initiation of sexual life in women and higher sexual desire and earlier reproduction in both sexes. Individuals with worse health also exhibited lower sexual activity, lower number of sexual partners, and lower total number of children. These results suggest that impaired health shifts individuals towards a faster life strategy but also has a negative (physiological) effect on behaviours related to sexual life. Signs of a faster life strategy were also found in Rh-negative men in good health, indicating that even just genetic predisposition to worse health could serve as a signal for switching to a faster life strategy. We suggest that improved public health in developed countries and the resulting shift to a slower life strategy could be the ultimate cause of the phenomenon of demographic transition.


Conflict of interest statement

The authors declare no competing interests.

Figures

Figure 1
Figure 1
The effects of sickness index and age on the number of children in women and men. This figure shows XYZ contour plots with distance-weighted least-squares fitting used for extrapolation. If an interaction between the sickness index and age had no effect on the number of children, the differently coloured areas would form vertical stripes.
Figure 2
Figure 2
Direct and indirect effects of the sickness index on age at first sexual intercourse in women and men. This figure visualises the results of path analyses: it demonstrates relations between age at first sexual intercourse, the sickness index, education, and age, separately for women (left) and men (right). The numbers at arrows show standardised parameter estimates. Associations with p values under 0.001 are marked by ‘***’.
Figure 3
Figure 3
Direct and indirect effects of the sickness index on sexual desire in women and men. This figure charts the results of path analyses: it shows relations between sexual desire, the sickness index, sexual activity, and age, separately for women (left) and men (right). The numbers at arrows show standardised parameter estimates. It is more parsimonious to expect that in men, sexual desire positively influences sexual activity than that sexual activity positively influences sexual desire. The direction of the arrow between sexual desire and sexual activity was therefore reversed in the men’s model (see “Discussion”). Associations with p values under 0.01 are marked by ‘**’, and those with p values under 0.001 are marked by ‘***’.
Figure 4
Figure 4
Direct and indirect effects of the sickness index on the number of children in women and men. This figure shows the results of path analyses: it visualises relations between the number of children, the sickness index, education, and age, separately for women under 31 years of age (top left), women over 31 years of age (top right), men under 35 years of age (bottom left), and men over 35 years of age (bottom right). The numbers at arrows show standardised parameter estimates. Associations with p values under 0.05 are marked by ‘*’, those with p values under 0.01 are marked by ‘**’, and those with p values under 0.001 are marked by ‘***’.
Figure 5
Figure 5
Direct and indirect effects of Rh-negativity on age at first sexual intercourse in women and men. This figure displays the results of path analyses of relations between age at first sexual intercourse, Rh-negativity, education, and age (top), and relations between these variables and the sickness index (bottom) for women (left) and men (right). The numbers at arrows show standardised parameter estimates. Associations with p values under 0.01 are marked by ‘**’, and those with p values under 0.001 are marked by ‘***’.

References

    1. Ellis BJ, Figueredo AJ, Brumbach BH, Schlomer GL. Fundamental dimensions of environmental risk—The impact of harsh versus unpredictable environments on the evolution and development of life history strategies. Hum. Nat. 2009;20:204–268. doi: 10.1007/s12110-009-9063-7. - DOI - PubMed
    1. Reznick DA, Bryga H, Endler JA. Experimentally induced life-history evolution in a natural population. Nature. 1990;346:357–359. doi: 10.1038/346357a0. - DOI
    1. Pianka ER. On r- and K-selection. Am. Nat. 1970;104:592–597. doi: 10.1086/282697. - DOI
    1. Stearns SC. Life-history tactics: A review of the ideas. Q. Rev. Biol. 1976;51:3–47. doi: 10.1086/409052. - DOI - PubMed
    1. Flegr J. Two distinct types of natural selection in turbidostat-like and chemostat-like ecosystems. J. Theor. Biol. 1997;188:121–126. doi: 10.1006/jtbi.1997.0458. - DOI

Publication types

LinkOut - more resources