. 2021 Jun;28(6):521-532.
doi: 10.1038/s41594-021-00590-w. Epub 2021 May 27.

Retinoic acid signaling is critical during the totipotency window in early mammalian development

Affiliations

Retinoic acid signaling is critical during the totipotency window in early mammalian development

Ane Iturbide et al. Nat Struct Mol Biol. 2021 Jun.

Erratum in

Abstract

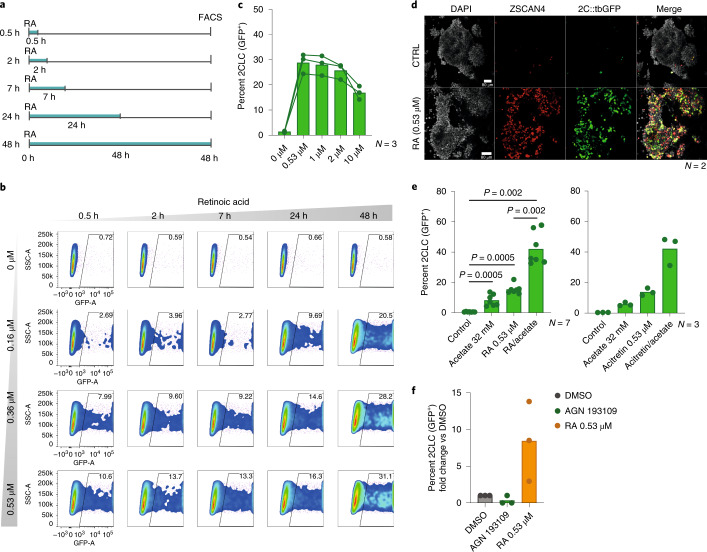
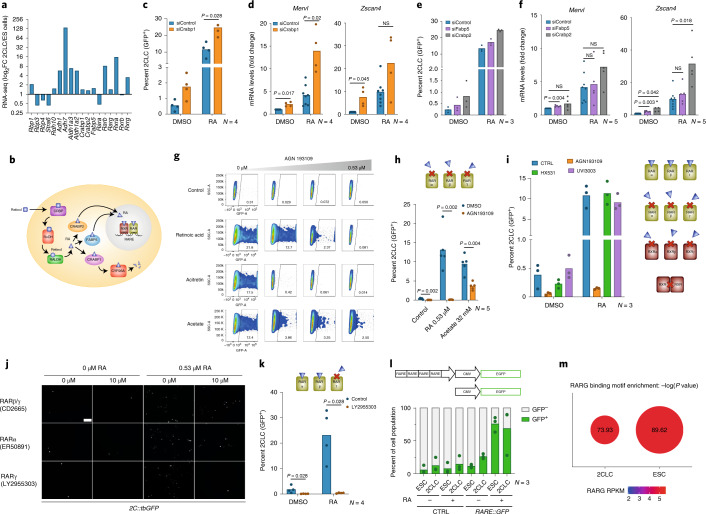
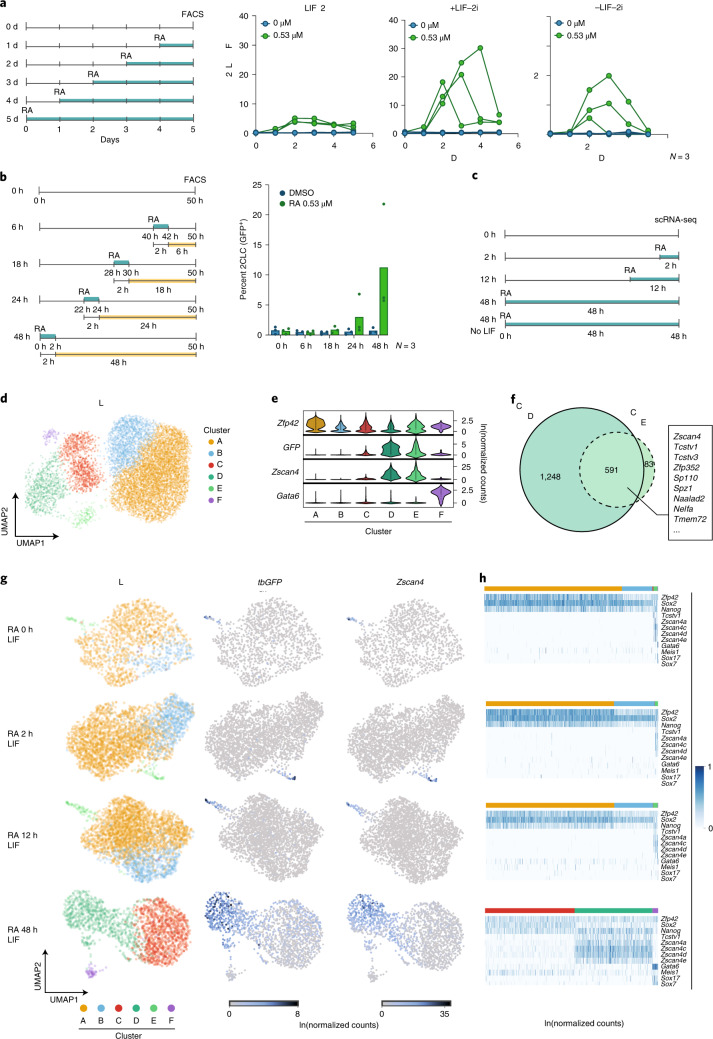
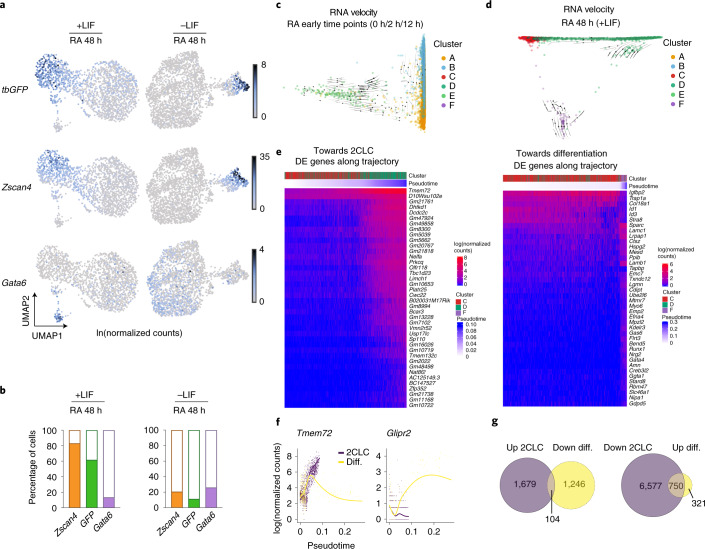
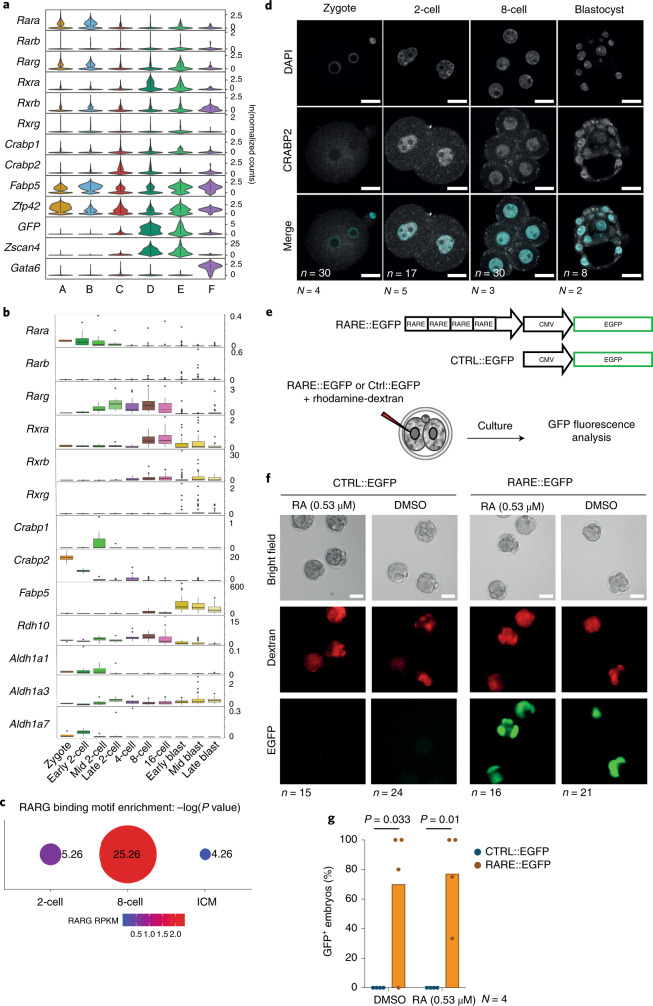
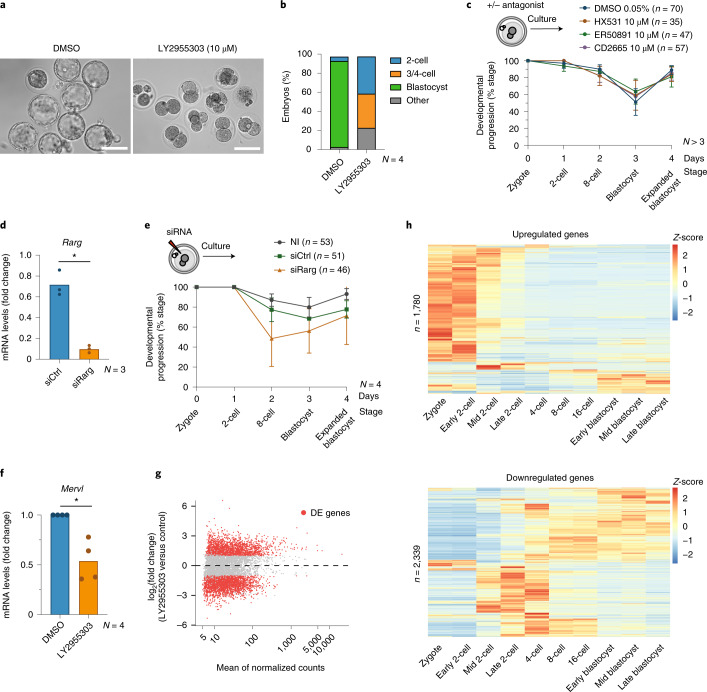
Totipotent cells hold enormous potential for regenerative medicine. Thus, the development of cellular models recapitulating totipotent-like features is of paramount importance. Cells resembling the totipotent cells of early embryos arise spontaneously in mouse embryonic stem (ES) cell cultures. Such '2-cell-like-cells' (2CLCs) recapitulate 2-cell-stage features and display expanded cell potential. Here, we used 2CLCs to perform a small-molecule screen to identify new pathways regulating the 2-cell-stage program. We identified retinoids as robust inducers of 2CLCs and the retinoic acid (RA)-signaling pathway as a key component of the regulatory circuitry of totipotent cells in embryos. Using single-cell RNA-seq, we reveal the transcriptional dynamics of 2CLC reprogramming and show that ES cells undergo distinct cellular trajectories in response to RA. Importantly, endogenous RA activity in early embryos is essential for zygotic genome activation and developmental progression. Overall, our data shed light on the gene regulatory networks controlling cellular plasticity and the totipotency program.


Conflict of interest statement

The authors declare no competing interests.

Figures

Fig. 1
Fig. 1. Low concentrations of RA robustly induce 2CLCs.
a, Experimental design. Embryonic stem (ES) cells were treated with a range of RA concentrations for different time periods. 2CLC induction was measured by FACS, 48 h after treatment. b, Representative scatter plot for the experiment in a, showing 2C::tbGFP fluorescence measurements of individual cells as assayed by FACS. c, Effect of high RA concentrations on 2CLCs induction. The percentage of 2CLCs (GFP+) quantified by FACS 48 h after treatment is shown (bars show the mean of the indicated number of replicates). Each line and connecting dots correspond to measurements of one replicate. d, Immunofluorescence using antibodies for the indicated proteins. The merge images show 4′,6-diamidino-2-phenylindole (DAPI; gray), ZSCAN4 (red) and tbGFP (green) expression. Scale bars, 80 µm. e, Effect of treatment with retinoids in combination with acetate on 2CLC induction. The percentage of 2CLCs (GFP+) was quantified by FACS, 48 h after treatment. The mean of the indicated replicates (represented by individual dots) is shown. P values were calculated by two-sided Mann–Whitney test. f, Induction of 2CLCs from ZSCAN4+ cells upon RA treatment. The percentage of 2CLCs (GFP+/mCherry+) was quantified by FACS, 24 h after sorting ZSCAN4+ (GFP/mCherry+) cells.
Fig. 2
Fig. 2. RARγ is required for 2CLC emergence.
a, Expression levels (log2FC) (FC, fold change) of selected RA-pathway-related genes in 2CLCs and ES cells (ESCs) based on RNA-seq data (N = 2, from ref. ). b, Schematic of the RA pathway. c, Induction of 2CLCs upon siRNA for Crabp1 and RA treatment. The percentage of 2CLCs was quantified by FACS. The mean ± s.d. of the indicated number of replicates is shown. P values were calculated by two-sided Mann–Whitney test. d, Quantitative polymerase chain reaction (qPCR) analysis upon transfection of siRNA for Crabp1 and RA treatment. Mean ± s.d. values of the indicated number of replicates are shown. P values were calculated by two-sided Student’s t-test. NS, not significant. e, Induction of 2CLCs upon transfection of siRNA for Fabp5 and Crabp2 and RA treatment. The percentage of 2CLCs was quantified by FACS. The mean ± s.d. of the indicated number of replicates is shown. f, qPCR analysis after transfection of siRNA for Fabp5 and Crabp2 and RA treatment. Mean ± s.d. values of the indicated number of replicates are shown. P values were calculated by two-sided Student’s t-test. g, Representative scatter plots from data in 3 h showing 2C::tbGFP fluorescence measurements of individual cells as assayed by FACS. h, Induction of 2CLCs upon treatment with AGN193109. The percentage of 2CLCs was quantified by FACS, 48 h after treatment. Mean values of the indicated replicates are shown. P values were calculated by two-sided Mann–Whitney test. i, Induction of 2CLCs upon treatment with RAR and RXR antagonists. The percentage of 2CLCs was quantified by FACS, 48 h after treatment. Mean ± s.d. values of the indicated replicates are shown. j, Representative fluorescence images of ES cell colonies harboring the 2C::tbGFP reporter, 48 h after treatment with the indicated antagonists and RA. Scale bar, 100 µm. k, Induction of 2CLCs upon treatment with LY2955303. The percentage of 2CLCs was quantified by FACS, 48 h after treatment. The mean of the indicated replicates is shown. P values were calculated by two-sided Mann–Whitney test. l, Percentage of 2CLCs displaying RARE activity. The percentage of 2CLCs (tdTOMATO+) and ES cells (tdTOMATO) with RARE activity (GFP+) was quantified by FACS, 48 h after RARE::EGFP reporter transfection and 24 h after RA treatment. The mean of the indicated replicates is shown. m, RARγ binding motif enrichment in open chromatin regions, using 2CLC and ES cell specific peaks. Dot size: −log10(P value).
Fig. 3
Fig. 3. 2CLC induction by RA is time-regulated and captured by scRNA-seq.
a, Left: experimental design. ES cells containing the 2C::tbGFP reporter were treated for a range of time periods with RA under the indicated culture conditions. 2CLC (GFP+) induction was measured for all samples at the same end point by FACS. Right: percentage of 2CLCs (GFP+) determined by FACS. Each line with connected dots corresponds to the measurement of one replicate. b, Left: experimental design. ES cells containing the 2C::tbGFP reporter were treated with RA for 2 h, and the emergence of 2CLCs was measured at different timepoints after treatment. Right: percentage of 2CLCs (GFP+) quantified by FACS. The mean of the indicated replicates (represented by individual dots) is shown. c, Experimental design for scRNA-seq. ES cells containing 2C::tbGFP reporter were treated with RA for different time periods. d, UMAP plot from scRNA-seq comprising all cells grown with serum/LIF and treated with RA for 0 h, 2 h, 12 h or 48 h. Cells are colored based on the clusters identified by the Leiden algorithm. e, Violin plots showing the expression levels of selected marker genes (rows) in each cluster (columns): Zfp42/Rex1, marker of naive ES cells (corresponding to cluster A); Zscan4 (computed as the sum of expression counts of genes in the Zscan4 family) and tbGFP (MERVL) marking 2CLCs (clusters D and E); Gata6 for differentiating cells (cluster F). f, Venn diagram comparing upregulated genes in cluster D and cluster E. g, UMAP plots depicting scRNA-seq data from cells grown in LIF and RA for different periods of time (rows) and colored by cluster (left column), by expression level of GFP (MERVL) (central column) and by expression level of Zscan4 (calculated as the sum of the levels of genes from the Zscan4 family; right column). h, Heatmaps displaying the expression levels of selected marker genes in cells at different times after RA treatment as in g (0 h, 2 h, 12 h, 48 h). Zfp42/Rex1 is a marker of naive ES cells; Sox2 and Nanog mark ES cells; Tcstv1, Zscan4a, Zscan4c, Zscan4d and Zscan4e are upregulated in 2CLCs; Gata6, Sox17 and Sox7 display higher expression levels in differentiating cells.
Fig. 4
Fig. 4. RA-reprogrammed 2CLCs differ from differentiating cells.
a, UMAP plots of cells treated with RA for 48 h with LIF (left column) or without LIF (right column). Rows from top to bottom are colored by expression of tbGFP (MERVL), Zscan4 (marking 2CLCs) and Gata6 (marking differentiating cells). b, Percentages of cells where the indicated marker gene is detected (counts > 0). The left barplots refer to cells grown with LIF and the right barplots to cells grown without LIF; in both cases, cells were treated with RA for 48 h. c, Diffusion map with RNA velocity overlaid for cells grown in LIF and treated with RA for 0 h, 2 h and 12 h. The RNA velocity vectors indicate that cells from the ES cell clusters (A and B) are transitioning into the 2CLC cluster (E). d, Diffusion map with RNA velocity overlaid for cells grown in LIF and treated with RA for 48 h. Here, 2CLCs (clusters C and D) and differentiating cells (cluster F) lie on different transcriptional trajectories. e, Heatmaps displaying the expression of DE genes along the trajectories towards 2CLCs and towards cell differentiation based on the 48 h scRNA-seq timepoint. The cell clusters (as in Fig. 3e) and pseudotime values are indicated. f, Expression levels of Tmem72 and Glipr2 genes plotted according to the pseudotime along the cellular trajectories towards differentiation (yellow line) or 2CLCs (purple line). g, Venn diagram of DE genes within each of the two trajectories.
Fig. 5
Fig. 5. The RA pathway is active in totipotent cells of the mouse embryo.
a, Violin plots showing the distribution of expression of RA receptors per cluster. The lower four genes are markers for naive ES cells (Zfp42; cluster A); 2CLCs (Zscan4 and tbGFP; clusters C, D and E); and differentiating cells (Gata6; cluster F). b, Box plots depicting the expression level of the indicated RA-pathway-related genes in pre-implantation embryos at zygote (n = 4), early 2-cell (n = 8), mid 2-cell (n = 12), late 2-cell (n = 10), 4-cell (n = 14), 8-cell (n = 28), 16-cell (n = 50), early blastocyst (n = 43), mid blastocyst (n = 60) and late blastocyst (n = 30) stages. The boxes denote the 25th and 75th percentiles (bottom and top of box) and median values (horizontal band inside box). The whiskers indicate the values observed within up to 1.5 times the interquartile range above and below the box. c, RARG motif enrichment in the open chromatin regions of the ±10 kb TSS by indicated developmental stage. Dot size, −log10(P value). d, Immunostaining of CRABP2 at the indicated developmental stages. Images are single confocal sections of single embryos. n, number of embryos analyzed. N, number of experimental replicates. Scale bars, 20 µm. e, Experimental design for the data in Fig. 6f,g. A RARE::EGFP reporter or a control plasmid lacking the RARE motifs was injected in one random blastomere of 2-cell-stage embryos. f, Representative fluorescence images of embryos with the RARE::EGFP reporter 44 h after microinjection of the reporter with or without RA treatment, showing embryos between late 8-cell and cavitating morula. g, Percentage of embryos expressing GFP from the control (CTRL) or RARE reporter. Median values of the indicated replicates (represented by individual dots) are shown. P values were calculated by one-sided Mann–Whitney test.
Fig. 6
Fig. 6. Perturbing RA signaling in the early mouse embryo affects developmental progression.
a, Phase-contrast images of representative embryos treated with the RARγ antagonist LY2955303 or control DMSO. N = 4. Scale bars, 100 µm. b, Developmental progression (in percentage) of control (DMSO, n = 51) or embryos treated with the RARγ antagonist LY2955303 (n = 59 embryos). N, number of experimental replicates. c, Developmental progression of control (DMSO, n = 70) or embryos treated with the indicated antagonists against RXR (HX531, n = 35), RARα (ER50891, n = 47) and both RARβ and RARγ (CD2665, n = 57). Data are presented as mean values, and error bars represent s.d. N, number of independent replicates. d, qPCR analysis of Rarg in 2-cell stage embryos after siRNA for Rarg in zygotes. N, number of experimental replicates. P value calculated by two-sided Student’s t-test. e, Developmental progression of zygotes non-injected (n = 53) or microinjected with scramble siRNA (control; n = 51) or with siRNA against Rarg (n = 46). Data are presented as mean values, and error bars represent s.d. N, number of experimental replicates. f, qPCR analysis of Mervl transcripts after LY2955303 treatment. N, number of experimental replicates. P value calculated by two-sided Student’s t-test. g, MA plot showing differentially expressed genes in control (DMSO) 2-cell stage embryos versus LY2955303-treated embryos. Differential gene expression analysis was performed using DESeq2 (P values obtained by two-sided Wald test and corrected for multiple testing using the Benjamini and Hochberg method). Red color indicates log2FC > 1 or <−1; Padj < 0.05. h, Heatmaps depicting the endogenous expression patterns of the up- and downregulated genes between embryos treated with LY2955303 versus control embryos at the late 2-cell stage. Z-score values are shown. RNA-seq datasets are from ref. (Methods).

Similar articles

Cited by

References

    1. Ishiuchi T, Torres-Padilla M-E. Towards an understanding of the regulatory mechanisms of totipotency. Curr. Opin. Genet. Dev. 2013;23:512–518. - PubMed
    1. Wu G, Schöler HR. Lineage segregation in the totipotent embryo. Curr. Top. Dev. Biol. 2016;117:301–317. - PubMed
    1. Tarkowski AK. Experiments on the development of isolated blastomeres of mouse eggs. Nature. 1959;184:1286–1287. - PubMed
    1. Togashi M. Production of monozygotic twins by splitting of 2-cell stage embryos in mice. Jpn J. Anim. Reprod. 1987;33:51–57.
    1. Sotomaru Y, Kato Y, Tsunoda Y. Production of monozygotic twins after freezing and thawing of bisected mouse embryos. Cryobiology. 1998;37:139–145. - PubMed

Publication types

MeSH terms

LinkOut - more resources