Meta-Analysis
. 2021 Jul;24(7):954-963.
doi: 10.1038/s41593-021-00860-2. Epub 2021 May 27.

Bi-ancestral depression GWAS in the Million Veteran Program and meta-analysis in >1.2 million individuals highlight new therapeutic directions

Affiliations
Meta-Analysis

Bi-ancestral depression GWAS in the Million Veteran Program and meta-analysis in >1.2 million individuals highlight new therapeutic directions

Daniel F Levey et al. Nat Neurosci. 2021 Jul.

Abstract

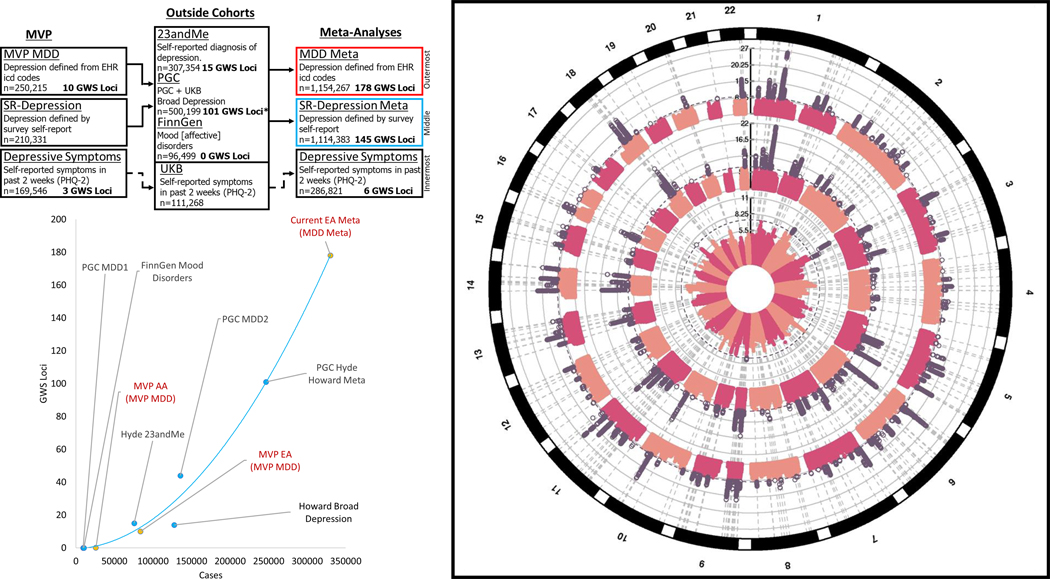
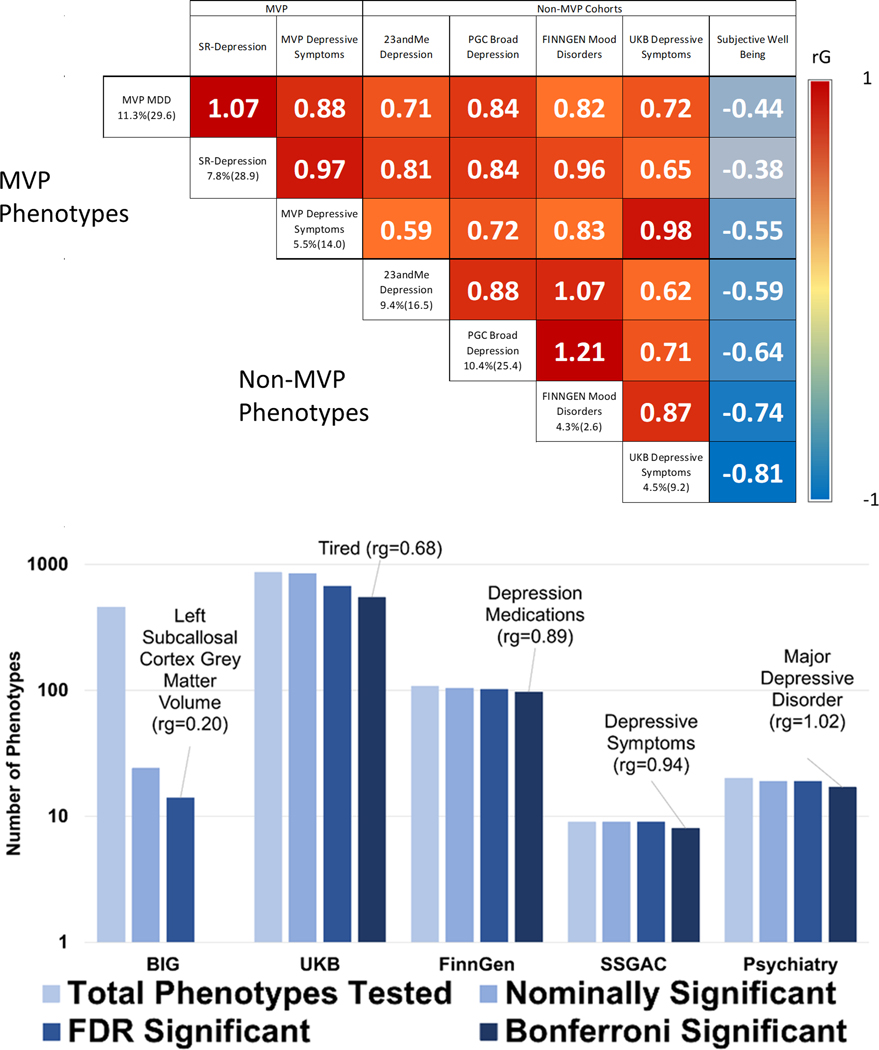
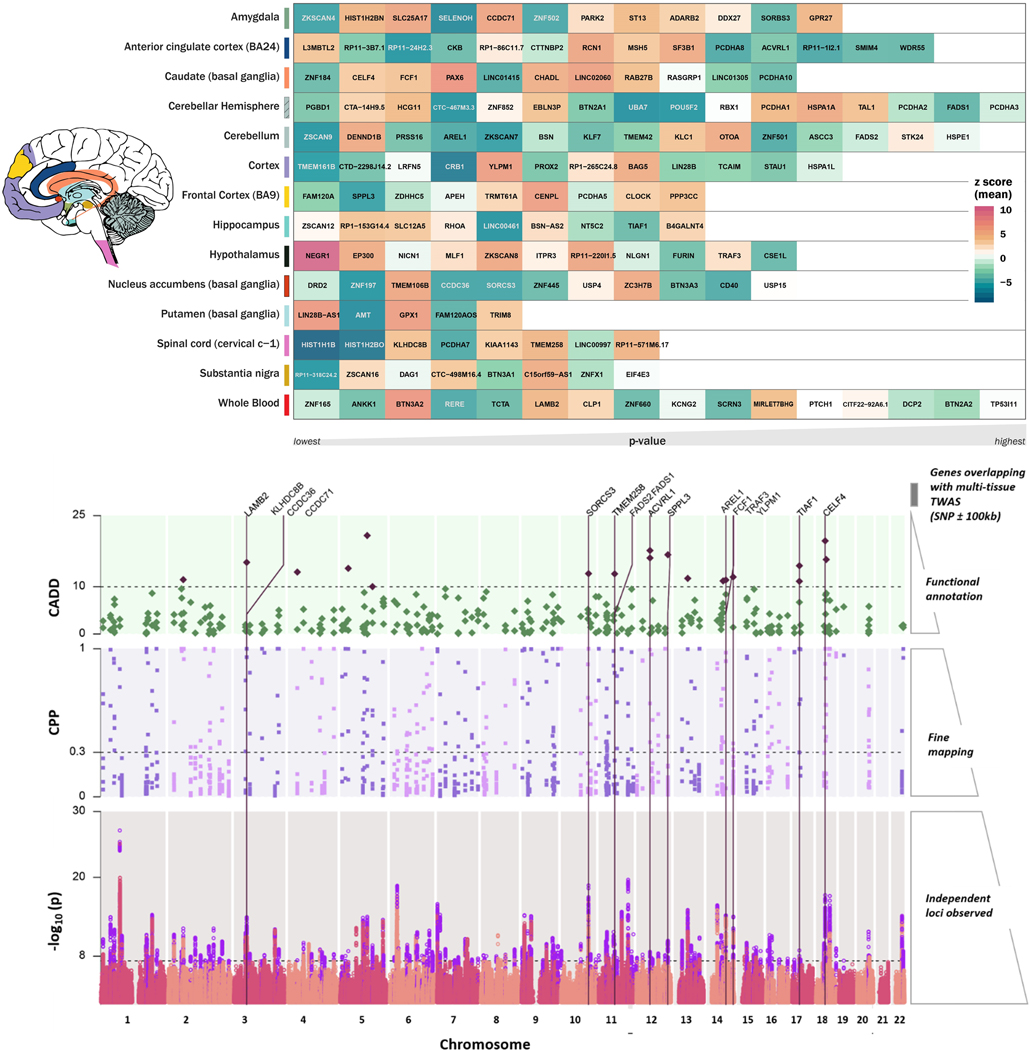
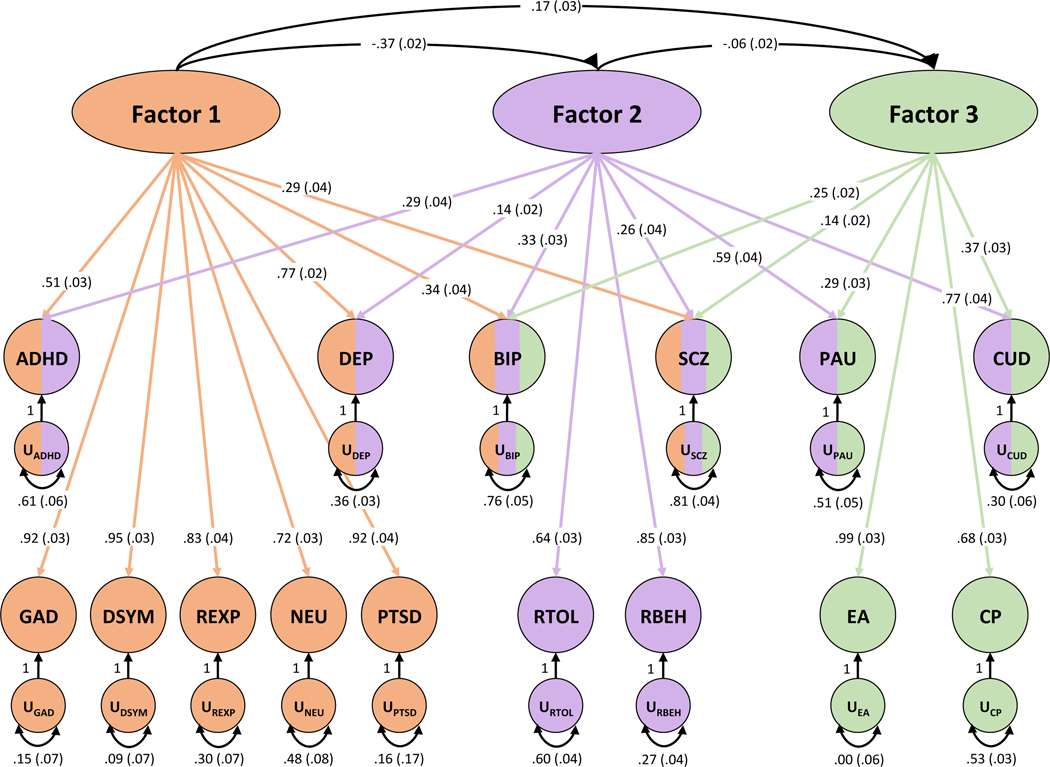
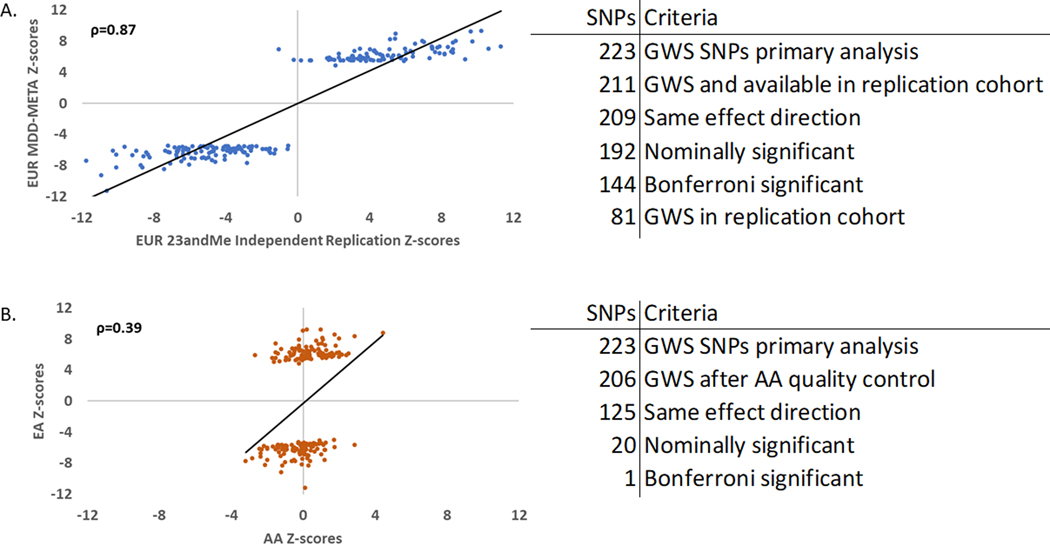
Major depressive disorder is the most common neuropsychiatric disorder, affecting 11% of veterans. Here we report results of a large meta-analysis of depression using data from the Million Veteran Program, 23andMe, UK Biobank and FinnGen, including individuals of European ancestry (n = 1,154,267; 340,591 cases) and African ancestry (n = 59,600; 25,843 cases). Transcriptome-wide association study analyses revealed significant associations with expression of NEGR1 in the hypothalamus and DRD2 in the nucleus accumbens, among others. We fine-mapped 178 genomic risk loci, and we identified likely pathogenicity in these variants and overlapping gene expression for 17 genes from our transcriptome-wide association study, including TRAF3. Finally, we were able to show substantial replications of our findings in a large independent cohort (n = 1,342,778) provided by 23andMe. This study sheds light on the genetic architecture of depression and provides new insight into the interrelatedness of complex psychiatric traits.


Conflict of interest statement

Conflict of Interest

Dr. Stein reports receiving consulting fees in the past 3 years from Acadia Pharmaceuticals, Aptinyx, Bionomics, Clexio Biosciences, EmpowerPharm, Genentech/Roche, GW Pharmaceuticals, Janssen, Jazz Pharmaceuticals, and Oxeia Biopharmaceuticals.

In the last 12 months Dr. Sanacora has provided consulting services to Allergan, Axsome Therapeutics, Biohaven Pharmaceuticals, Boehringer Ingelheim International GmbH, Bristol-Myers Squibb, Clexio Biosciences, Epiodyne, Intra-Cellular Therapies, Janssen, Lundbeck, Minerva pharmaceuticals, Navitor Pharmaceuticals, NeuroRX, Noven Pharmaceuticals, Otsuka, Perception Neuroscience, Praxis Seelos Pharmaceuticals and Vistagen Therapeutics. He has received funds for contracted research from Janssen Pharmaceuticals, Merck, and Usona Institute. He holds equity in Biohaven Pharmaceuticals and has received royalties from Yale University paid from patent licenses with Biohaven Pharmaceuticals.

Jingchunzi Shi and Suyash Shringarpure are employed by and hold stock or stock options in 23andMe, Inc.

Dr. Gelernter is named as co-inventor on PCT patent application #15/878,640 entitled: “Genotype-guided dosing of opioid agonists,” filed January 24, 2018.

All other authors declare that they have no conflict of interest. No other conflicts are reported.

Figures

Figure 1.
Figure 1.. Design of the study and circular Manhattan Plot.
Left Panel: Design of the study (top). Three phenotypes were evaluated within MVP: MDD-META (outermost ring, right panel) which was derived from ICD codes, SR-Depression (middle ring, right panel) which was defined by self-reported diagnosis of depression in the MVP survey, and Depressive symptoms (innermost ring, right panel) which come from the PHQ2 2-item scale found in the MVP survey. MVP-MDD and SR-Depression were each meta-analyzed with depression results from:23andMe, PGC, and FinnGen. MVP PHQ2 was meta-analyzed with results from the PHQ2 2-item scale from UK biobank. Right Panel: Circular Manhattan Plot. Significant results are highlighted in purple. Lower left Panel: Accelerating pace of loci discovery in depression GWAS. Y axis indicates the number of discovered loci in a study, with the X axis showing the number of cases included in each study. Red text and yellow markers indicate original analyses conducted for this study using MVP data for EA, AA and the overall MDD-META meta-analysis of EAs.
Figure 2.
Figure 2.. Genetic Correlation.
Upper Panel. Genetic correlations between depression phenotypes, with subjective well-being included as a negative correlation comparator. Heritability (z-score) is given along the left axis of the matrix for each depression phenotype. Values within the matrix represent rg. All correlations are significant following Bonferroni correction for multiple comparisons (0.05/28=p<0.0018). The largest p-value was for the correlation between FinnGen and UKB Depressive symptoms (p=4.06×10–05). P-values and 95% CI are reported in Table S6. Lower Panel. Summary of genetic correlation between MDD-META and 1,457 phenotypes from large-scale genetic studies of mental health and behavior. The Psychiatry category contains phenotypes from the Psychiatric Genomics Consortium, GWAS & Sequencing Consortium of Alcohol and Nicotine use, Million Veteran Program, and International Cannabis Consortium. The labels Tired and left subcallosal cortex grey matter volume represent UKB Field ID 2080 and BIG Field ID 0078, respectively. P-values are two-sided.
Figure 3.
Figure 3.. Top: Tissue-based gene association study (TWAS).
The genes were tested using MetaXcan for 13 brain tissues and whole blood from the GTEx-v8. The genes were compared across tissues to identify best representative tissues for each gene using SMultiXcan. Genes are arranged in order from left to right by respective tissue specific p-value, with the lowest value on the left. The color scale for the gene matrix is based on mean z-score. The values are reported in Supplementary file 2. Bottom: SNP prioritization using fine Mapping and functional scoring. Bottom panel: Manhattan plot showing each genomic risk locus in violet. Middle panel: Each locus was fine mapped, and the causal posterior probability (CPP) on the y-axis is shown for SNPs from the causal set. The SNPs which had CPP ≥0.3 (30%) were annotated using Combined Annotation Dependent Depletion (CADD) scores. Top panel: The SNPs with CADD ≥ 10 are highlighted in purple; these SNPs were positionally mapped to 107 genes within 100kb. Only positional genes overlapping with multi-tissue TWAS results (Supplementary Figure 1) are annotated with vertical lines. Details of the prioritized SNPs are reported in Supplementary file 2.
Figure 4.
Figure 4.. Genomic SEM.
Genomic structural equation modeling of MDD-META (DEP) plus 14 additional traits. Exploratory factor analysis converged on a three-factor model. Arrows represent loading of each phenotype onto a connected factor with loading value and standard error provided for each. Multi-colored phenotypes indicate loading onto more than one factor while monochromatic phenotypes were unique to a single factor. Factor 1 generally represents internalizing symptoms, Factor 2 externalizing behaviors, and Factor 3, education/cognition. The correlation between factors is shown. Phenotype acronyms are: attention deficit hyperactivity disorder (ADHD), MVP MDD-META (DEP), bipolar disorder (BIP), schizophrenia (SCZ), problematic alcohol use (PAU), cannabis use disorder (CUD), anxiety symptoms (GAD), depressive symptoms (DSYM), reexperiencing (REXP), neuroticism (NEU), posttraumatic stress disorder (PTSD), risk tolerance (RTOL), risky behavior (RBEH), educational attainment (EA), and cognitive performance (CP).
Figure 5.
Figure 5.. Similar-ancestry and Transancestry Replication Analyses.
A. Left panel: Scatter plot for z-score effect sizes for 211 GWS SNPs (Spearman’s ρ=0.87) from the primary MDD-META GWAS on the y axis and the independent 23andMe replication cohort African ancestry (only) GWAS on the x axis. Right panel: Overlap of SNPs from European and African ancestry GWASs. 223 GWS SNPs from the primary analysis, of which 211 were available in the independent 23andMe GWAS. 209 (99%) of the remaining SNPs had the same effect direction, 192 were nominally significant p<0.05 (91%), 144 were Bonferroni significant after correcting for 211 comparisons (68%), and 81 were independently genome-wide significant (38%). B. Left panel: Scatter plot for z-score effect sizes for 206 GWS SNPs (Spearman’s ρ=0.39) from the primary MDD-META GWAS of different ancestries, plotting z-score for European ancestry (only) GWAS on the y axis and African ancestry (only) GWAS on the x axis. Right panel: Overlap of SNPs from European and African ancestry GWASs. 223 GWS SNPs from the primary analysis, of which 206 are available in the AA GWAS following QC. 125 (61%) of the remaining SNPs had the same effect direction, 20 were nominally significant (p<0.05) and one was Bonferroni significant after correcting for 206 comparisons.

Similar articles

Cited by

References

    1. Hasin DS et al.Epidemiology of Adult DSM-5 Major Depressive Disorder and Its Specifiers in the United States. JAMA Psychiatry 75, 336–346 (2018). - PMC - PubMed
    1. Roehrig C. Mental Disorders Top The List Of The Most Costly Conditions In The United States: $201 Billion. Health Affairs 35, 1130–1135 (2016). - PubMed
    1. Mullins N. et al.GWAS of Suicide Attempt in Psychiatric Disorders and Association With Major Depression Polygenic Risk Scores. Am J Psychiatry 176, 651–660 (2019). - PMC - PubMed
    1. Strawbridge RJ et al.Identification of novel genome-wide associations for suicidality in UK Biobank, genetic correlation with psychiatric disorders and polygenic association with completed suicide. EBioMedicine 41, 517–525 (2019). - PMC - PubMed
    1. Levey DF et al.Genetic associations with suicide attempt severity and genetic overlap with major depression. Transl Psychiatry 9, 22 (2019). - PMC - PubMed

Publication types