. 2021 Jul;53(7):1088-1096.
doi: 10.1038/s41588-021-00874-3. Epub 2021 May 27.

Radiotherapy is associated with a deletion signature that contributes to poor outcomes in patients with cancer

Affiliations

Radiotherapy is associated with a deletion signature that contributes to poor outcomes in patients with cancer

Emre Kocakavuk et al. Nat Genet. 2021 Jul.

Abstract

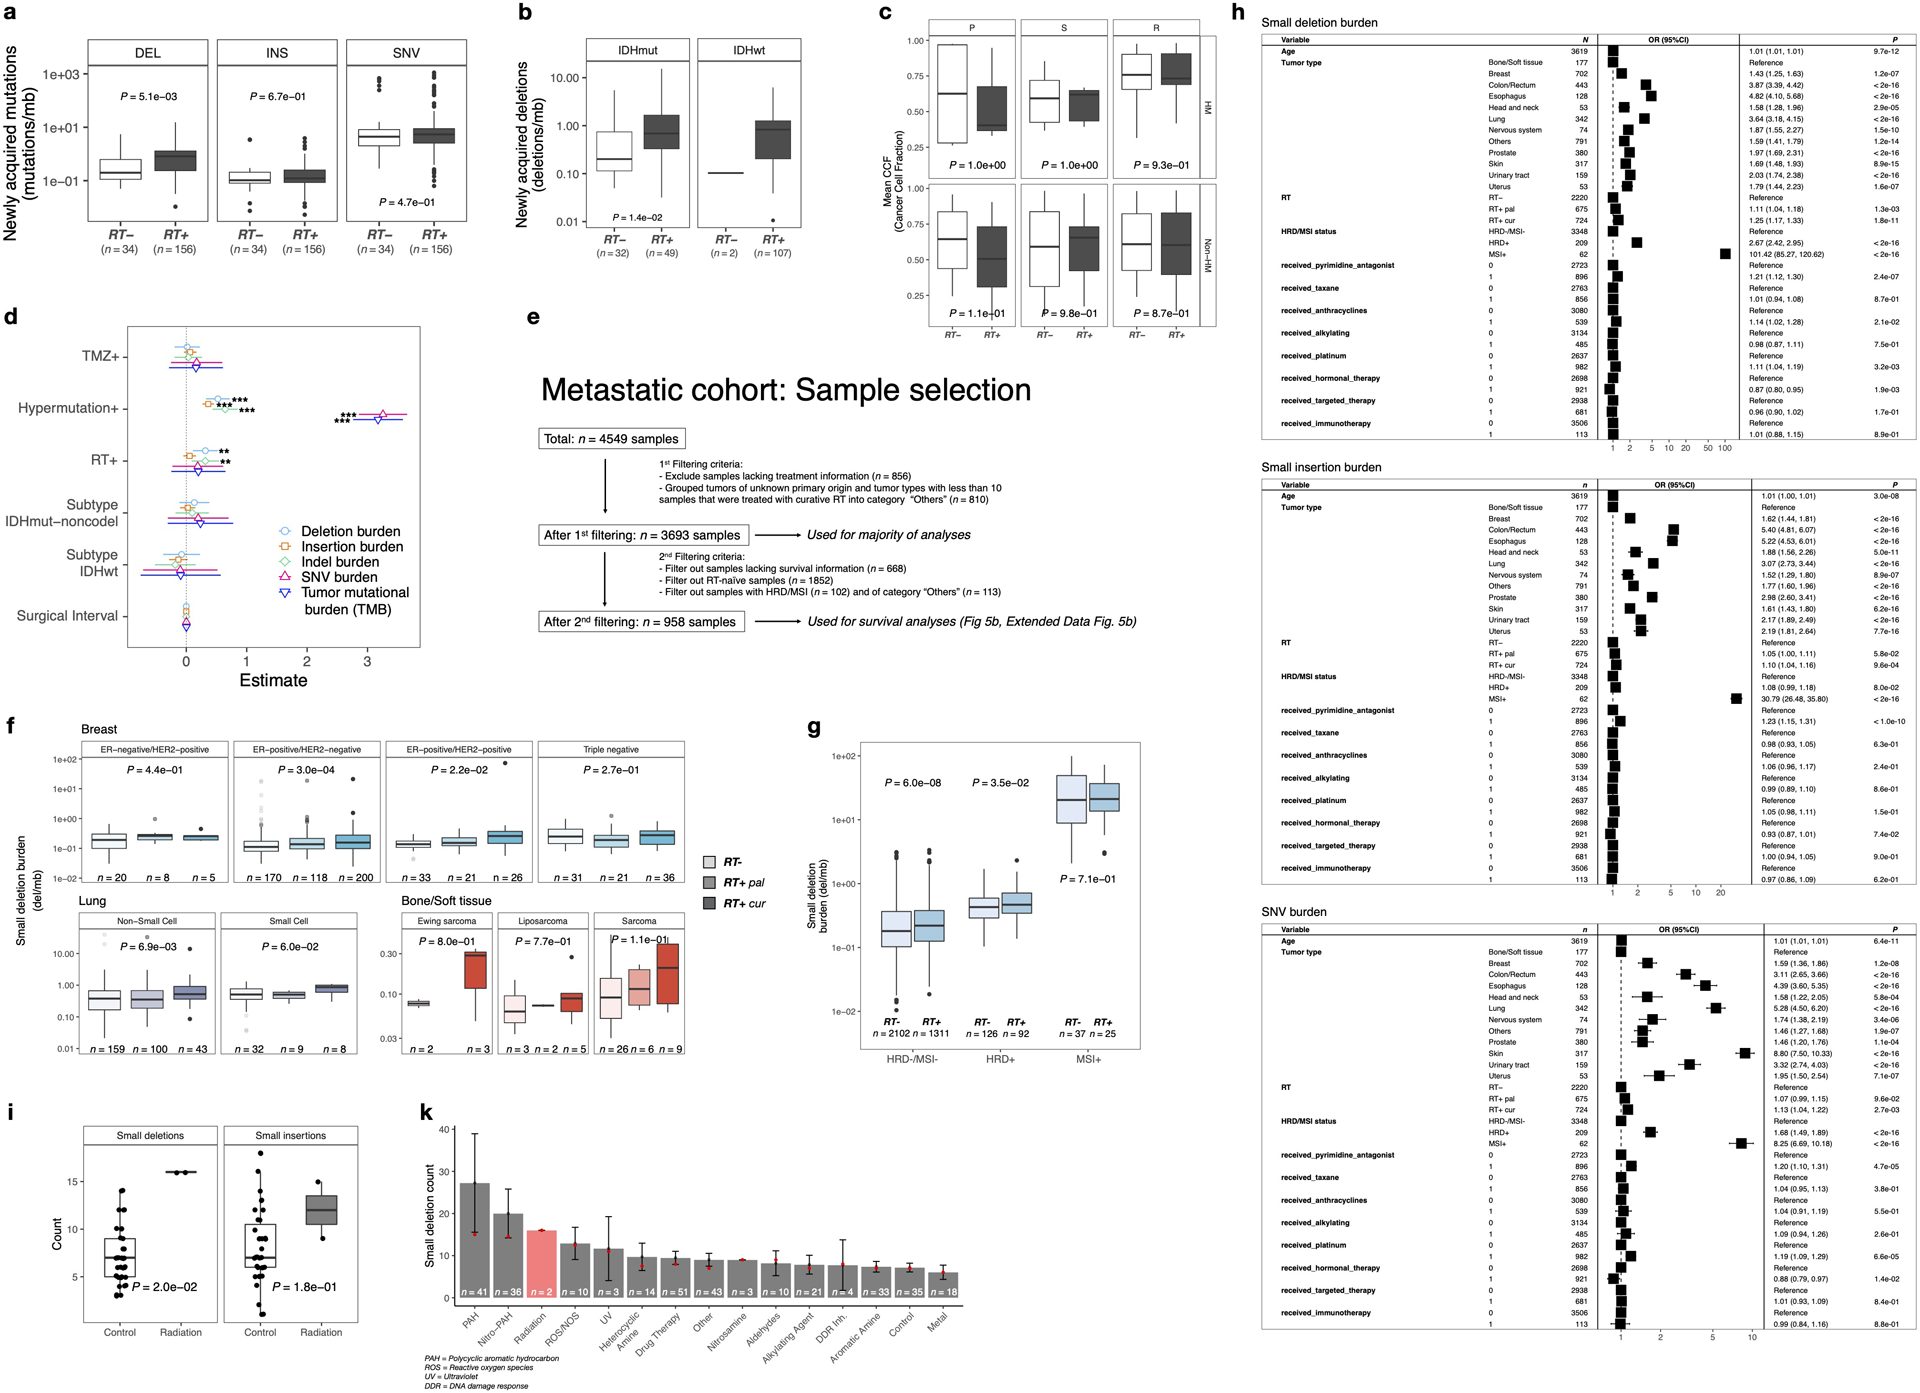
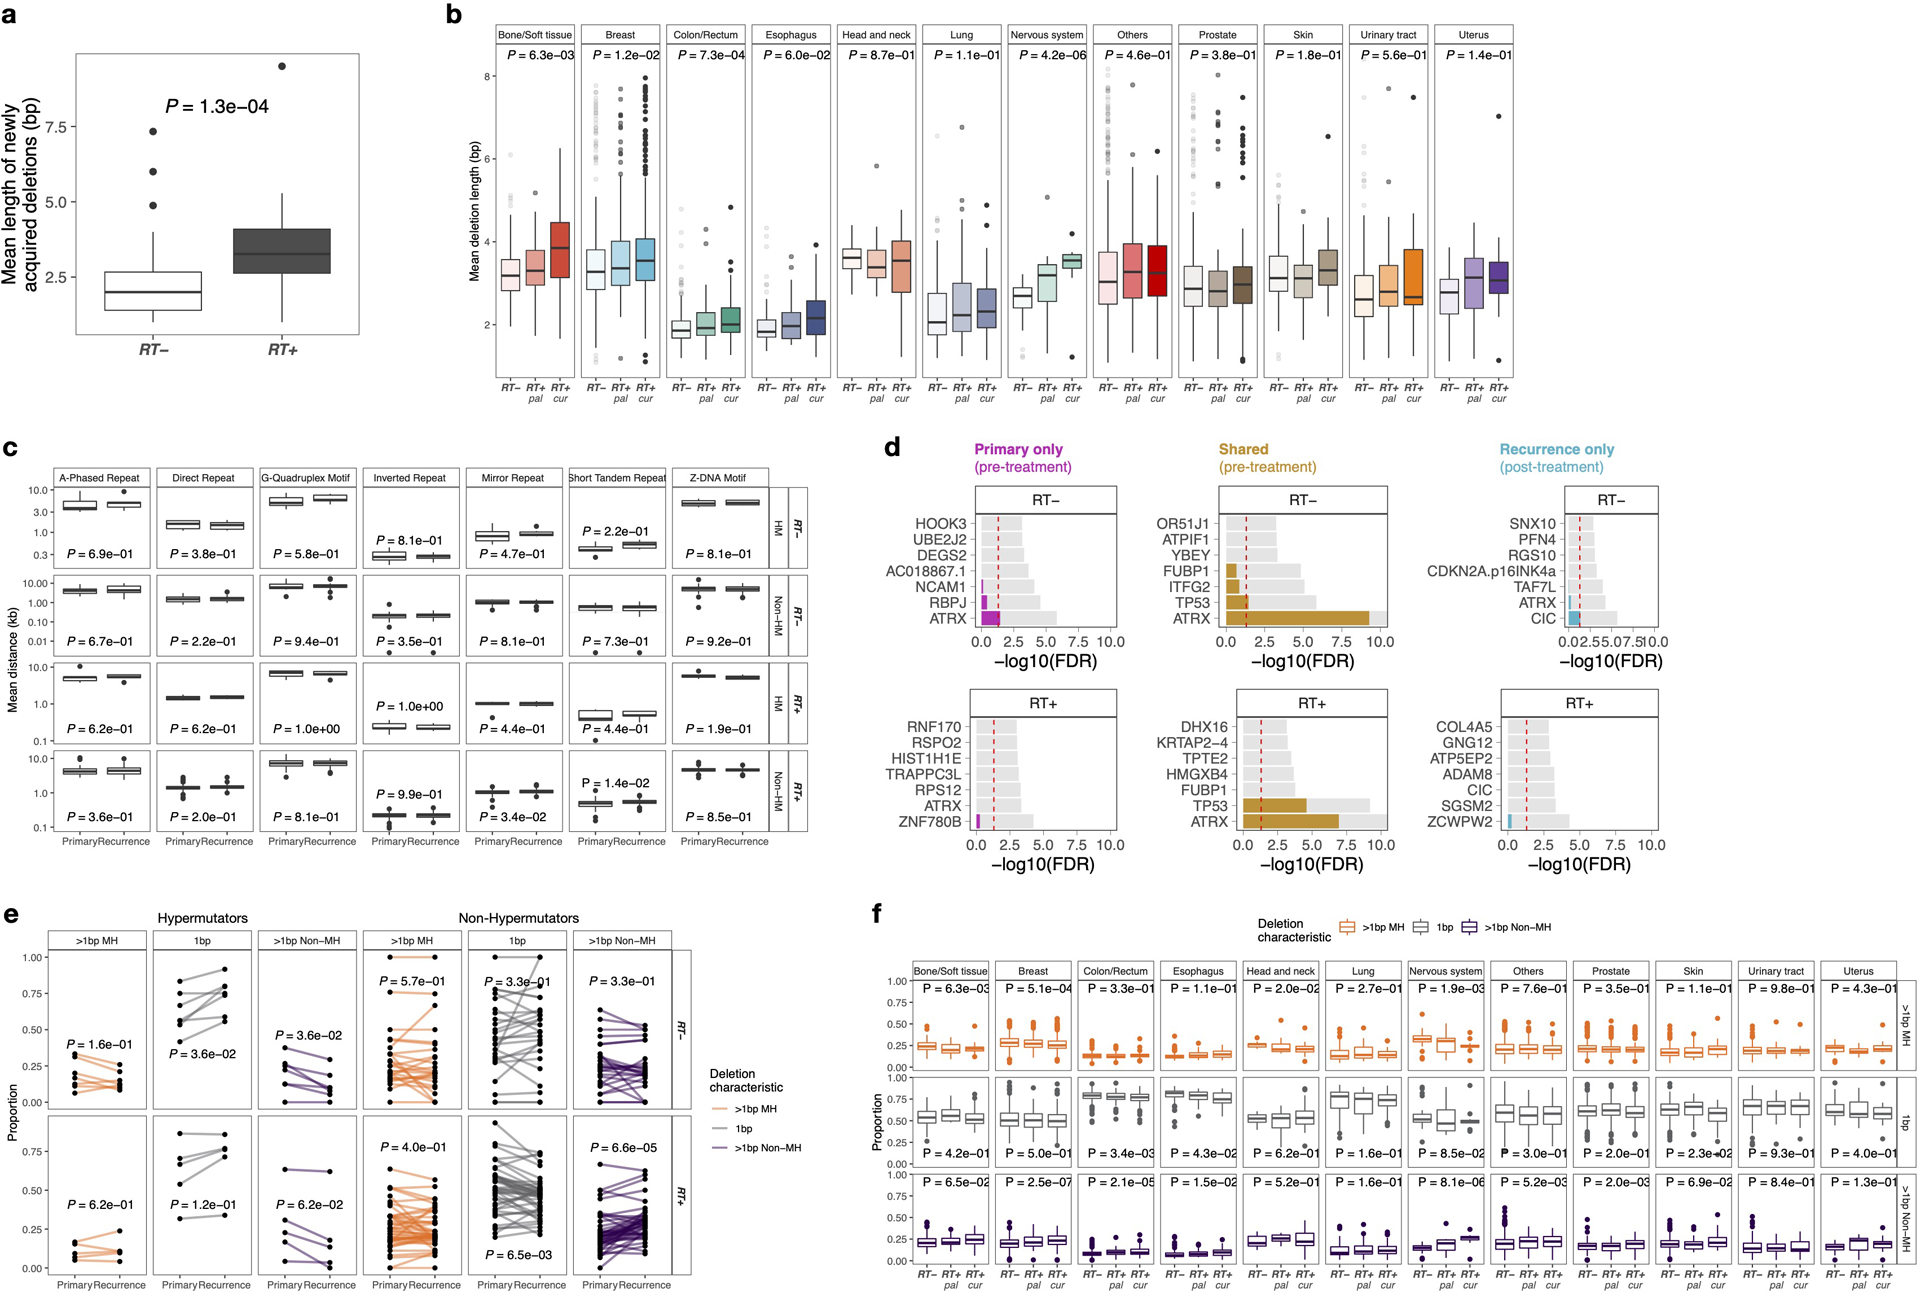
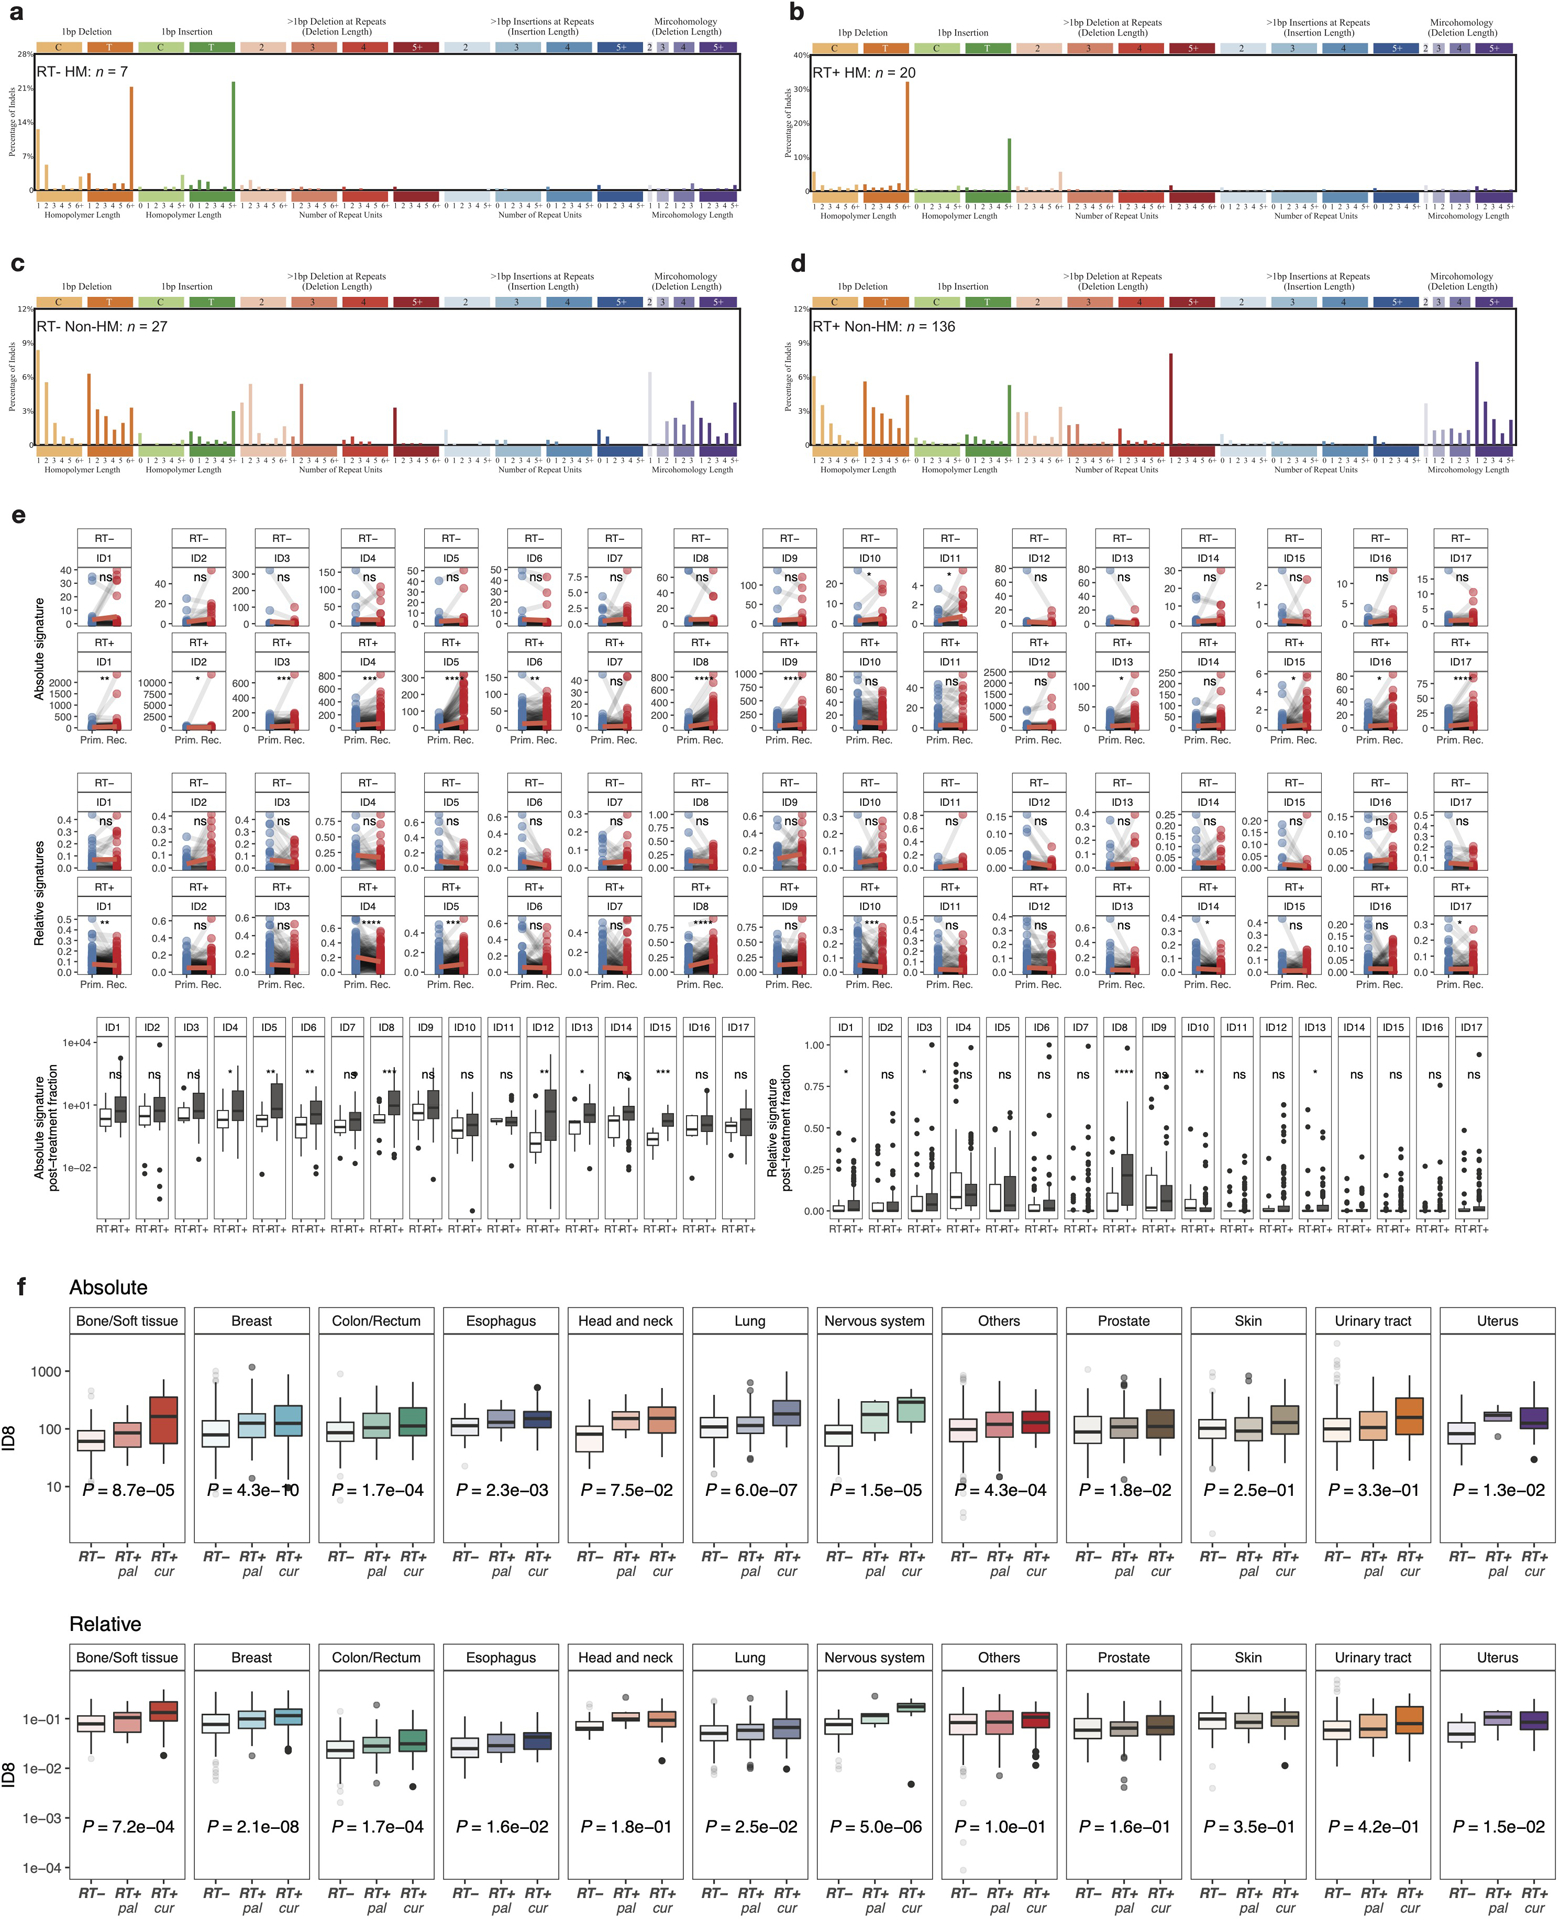
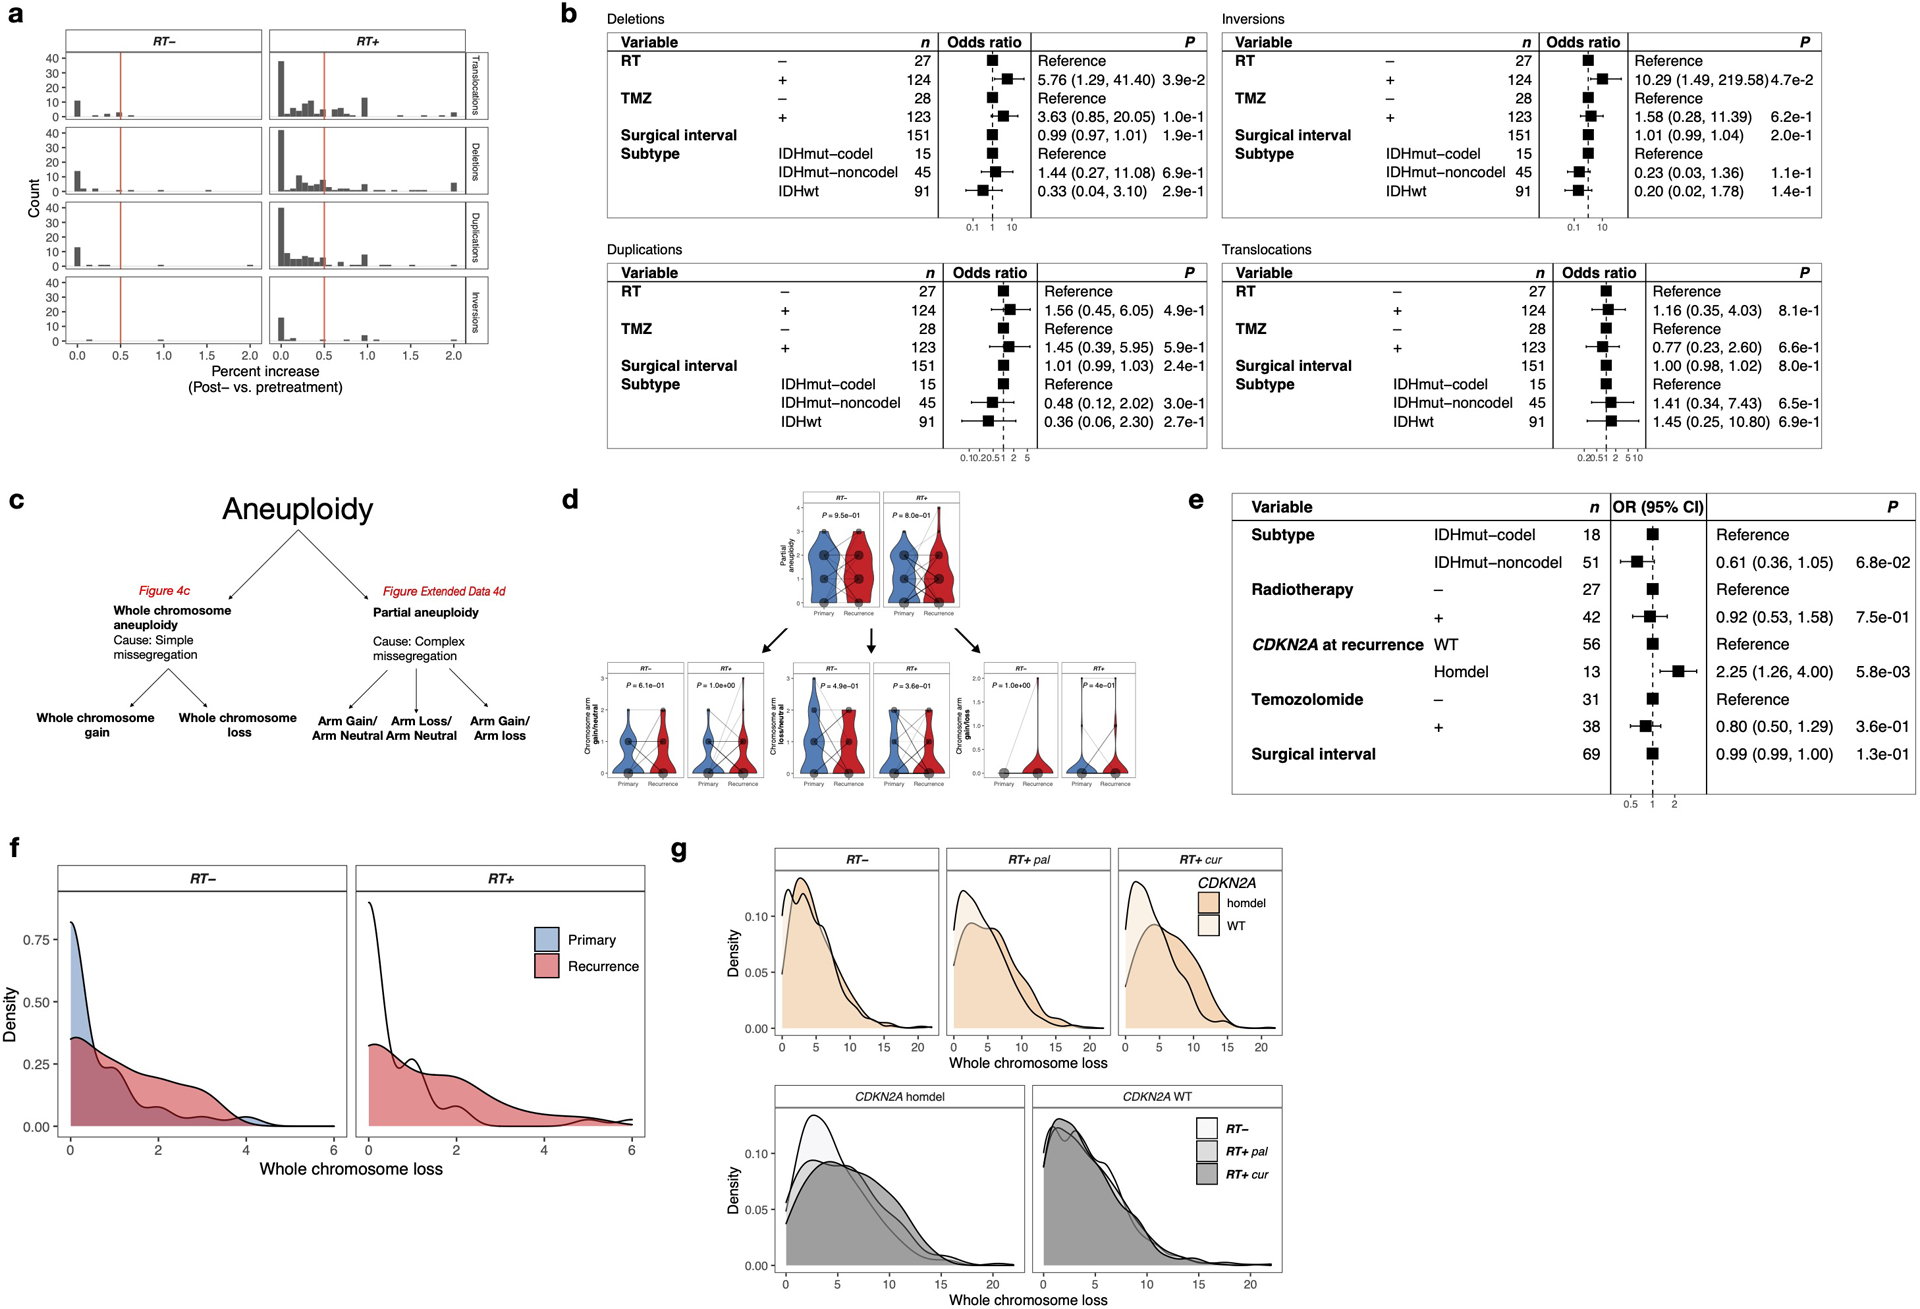
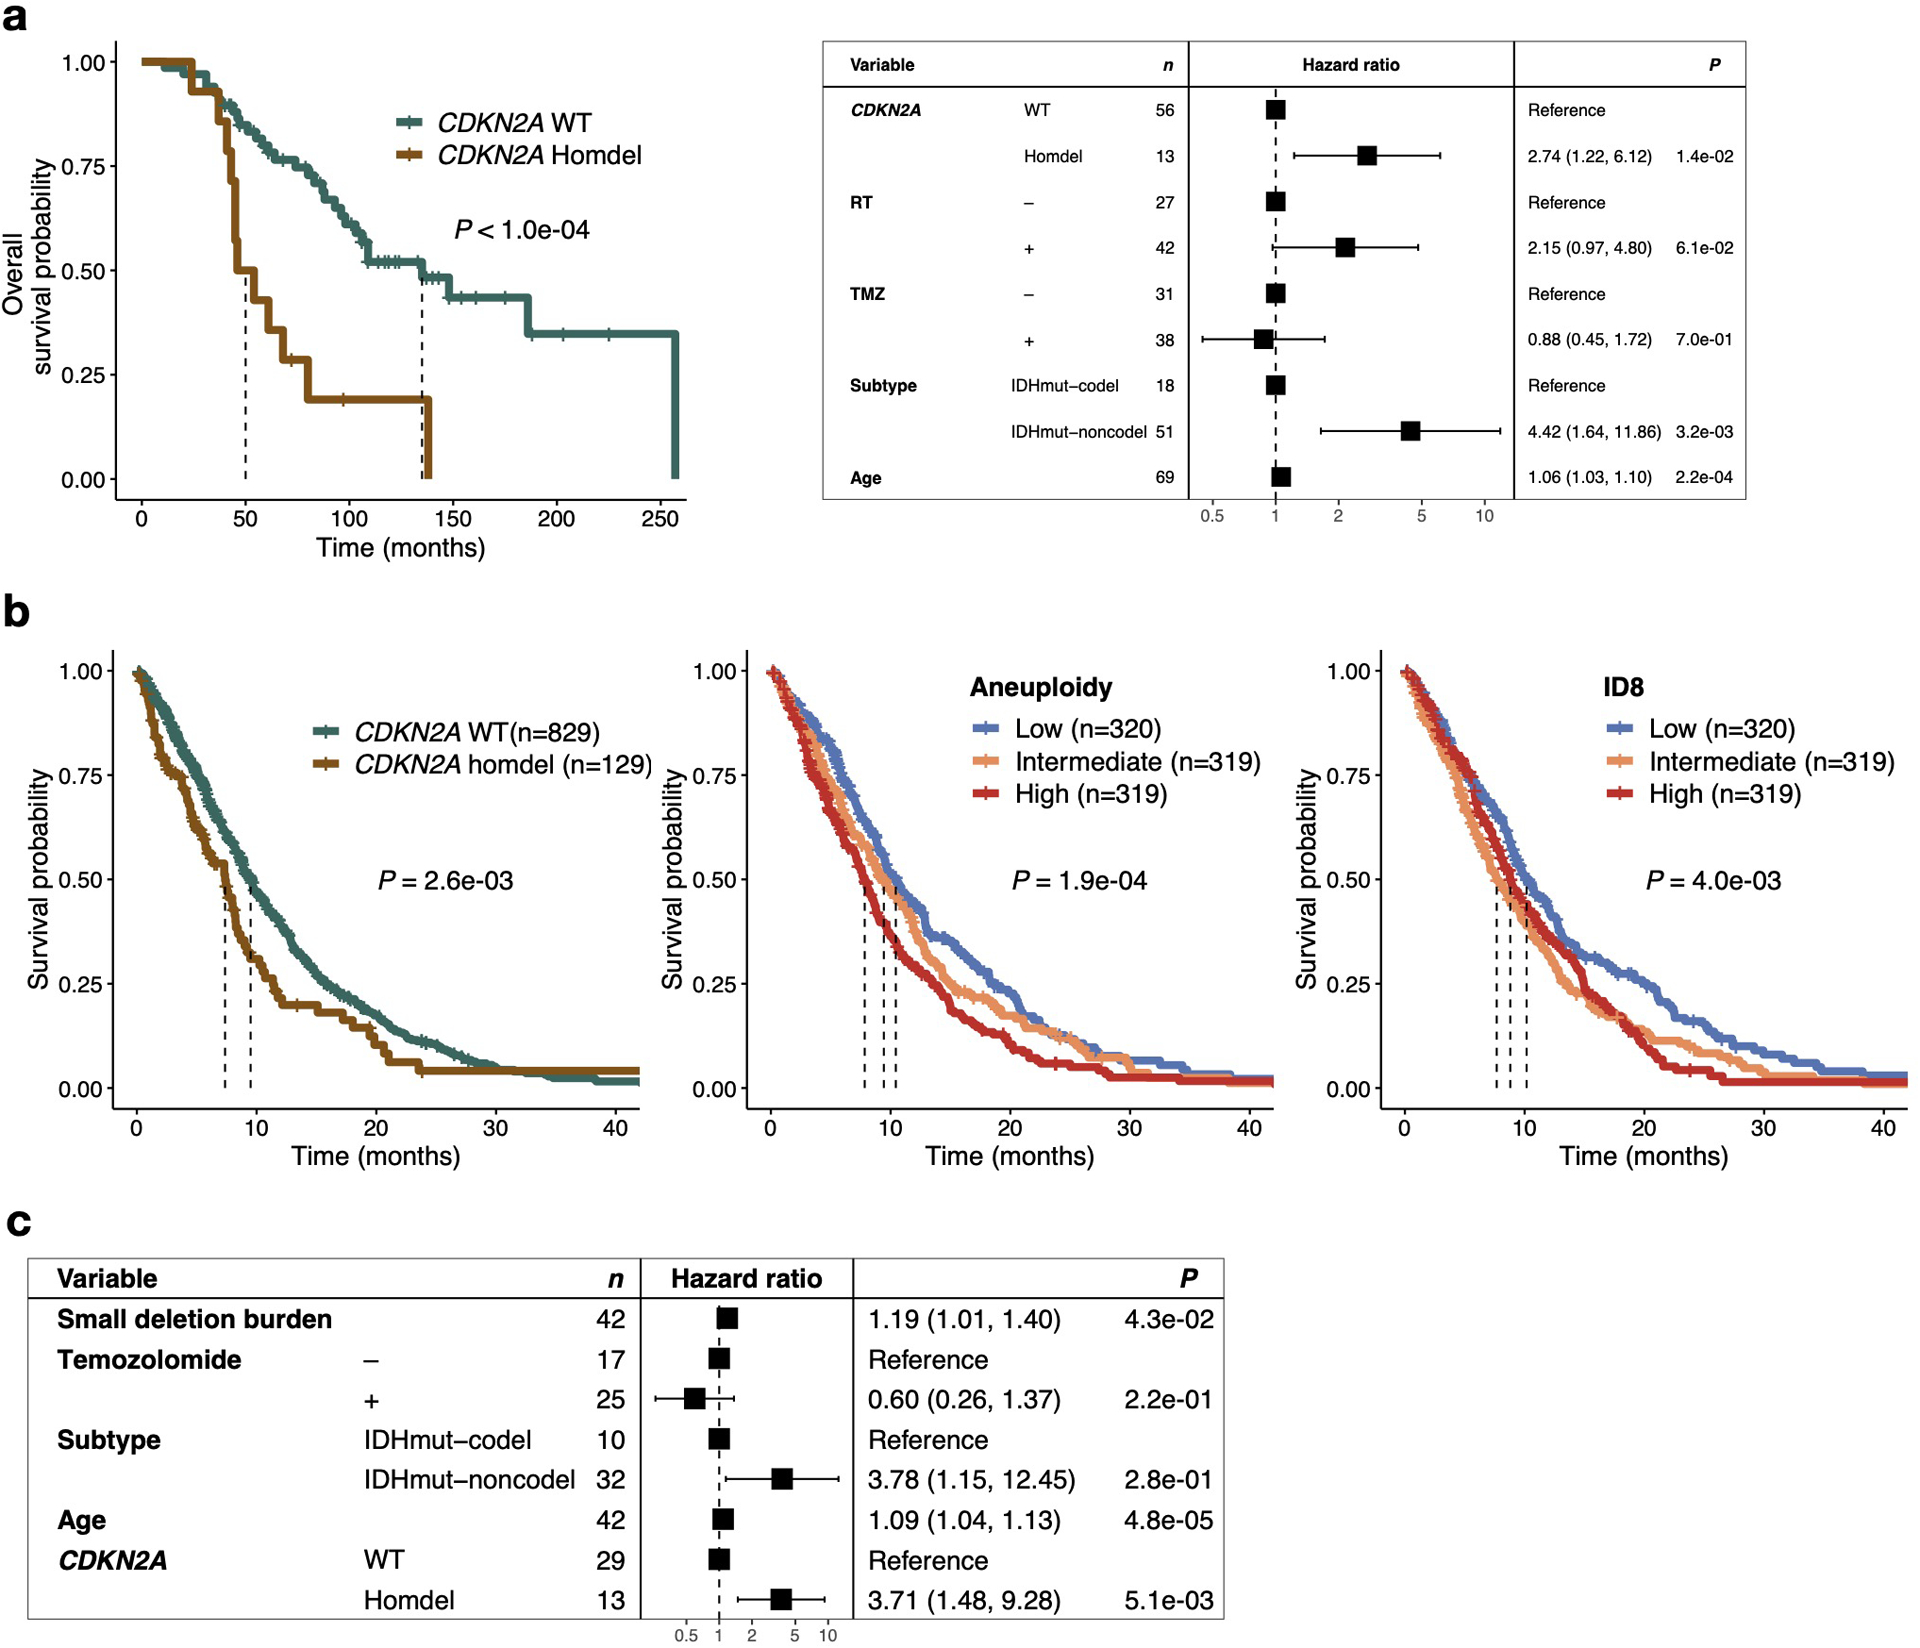
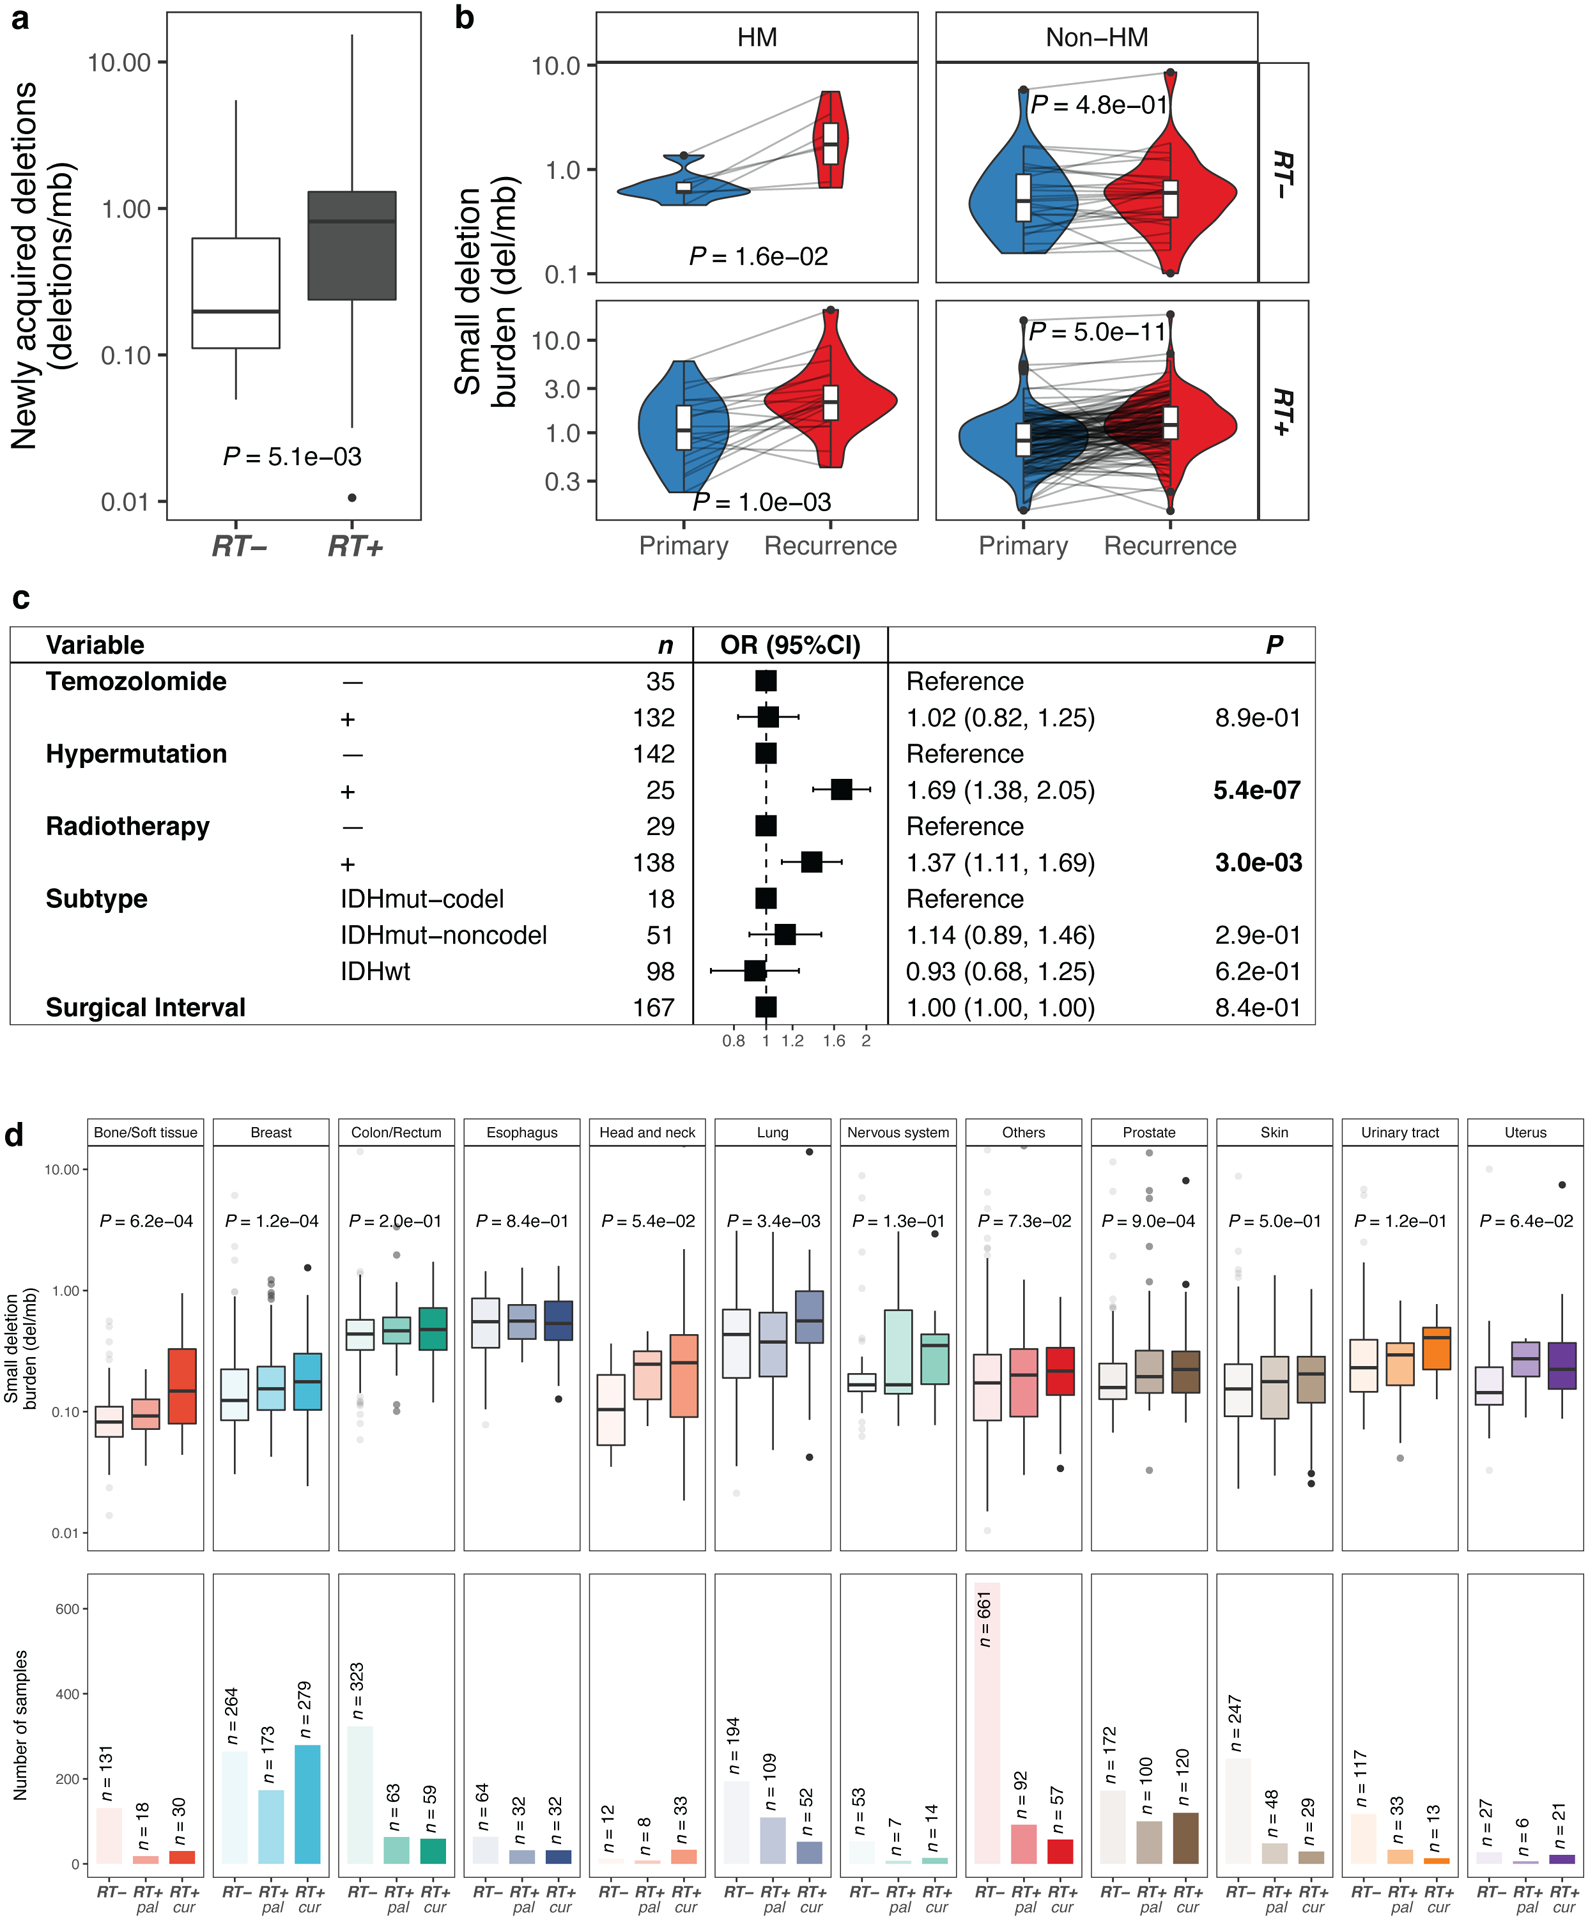
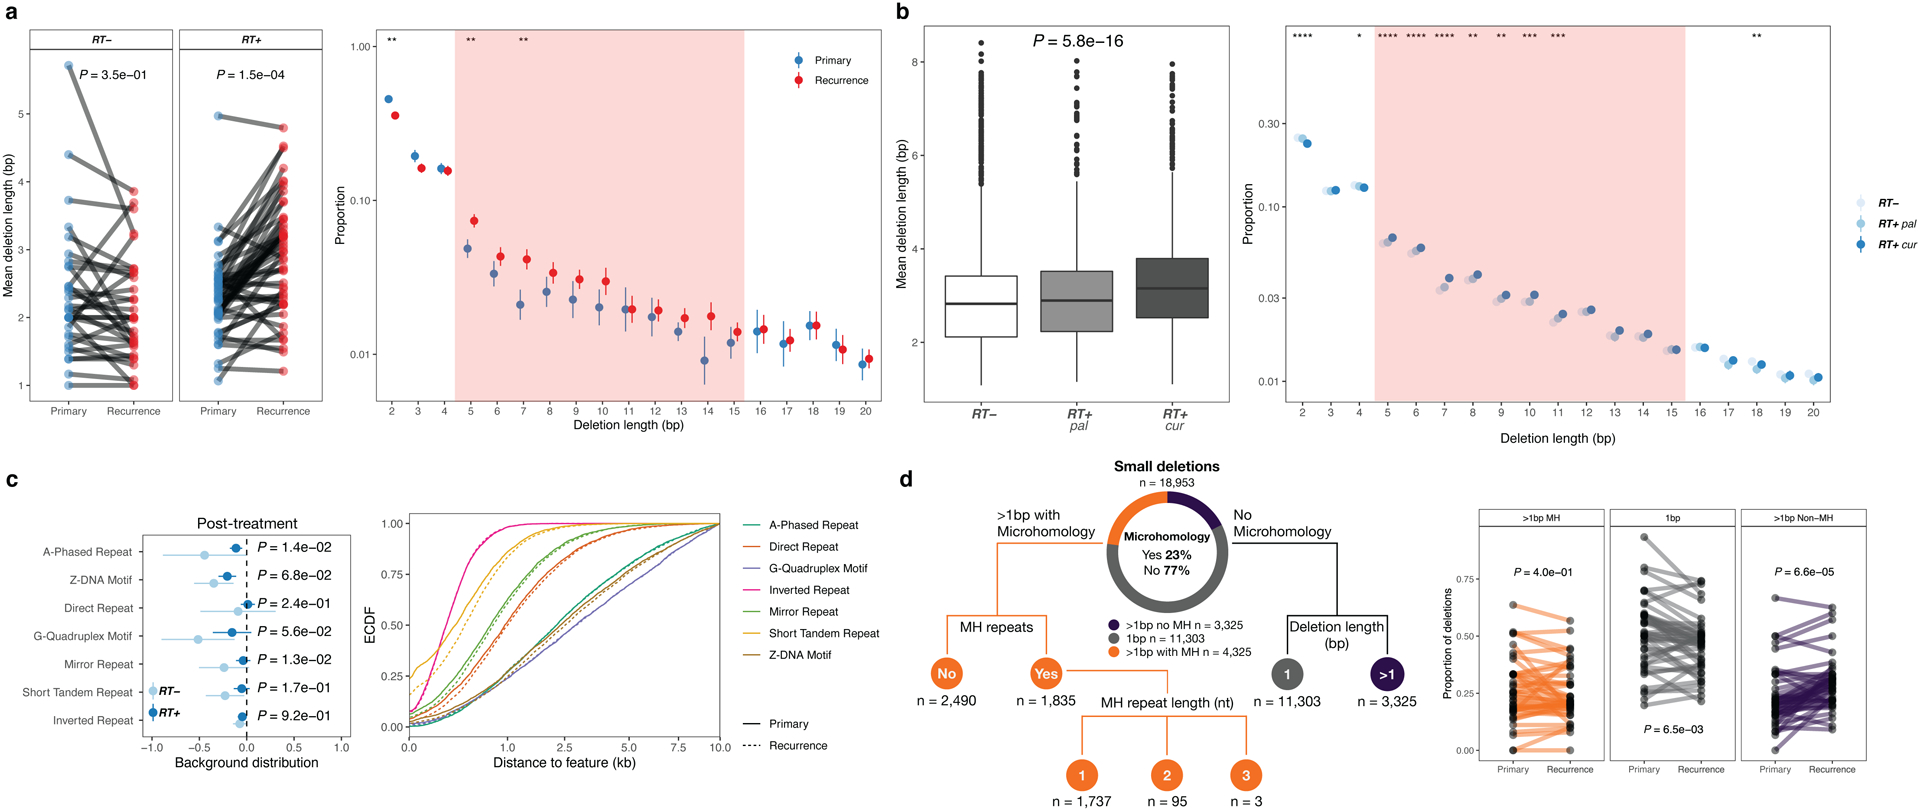
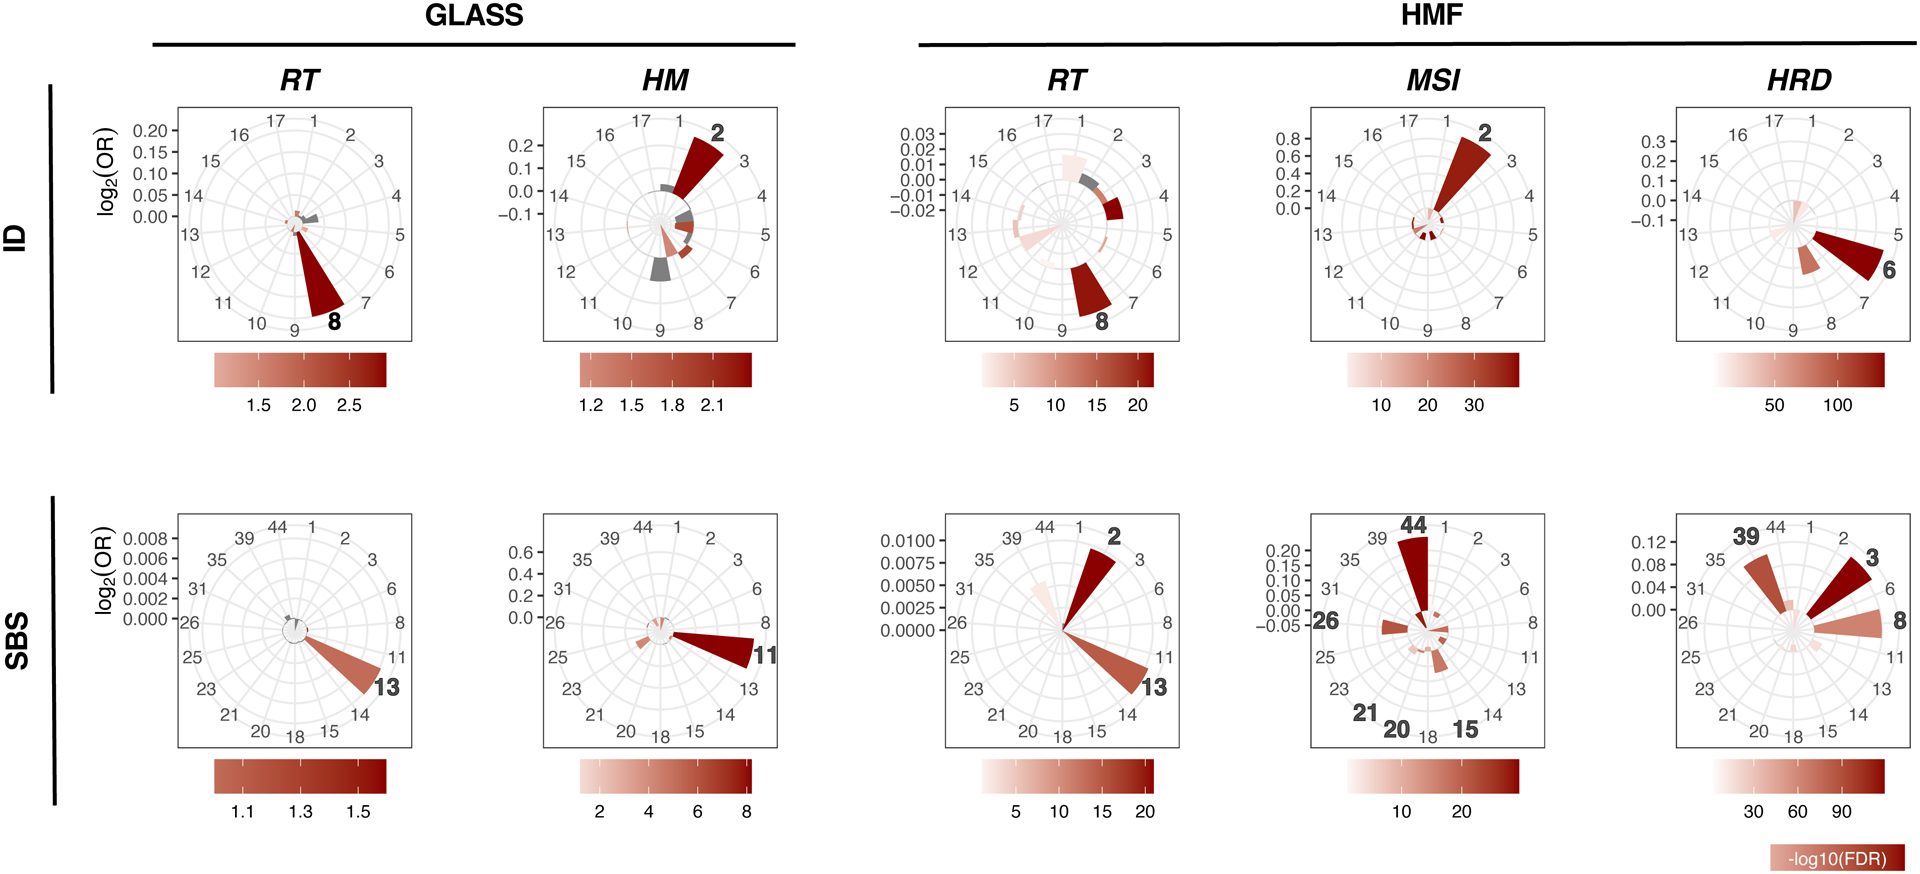
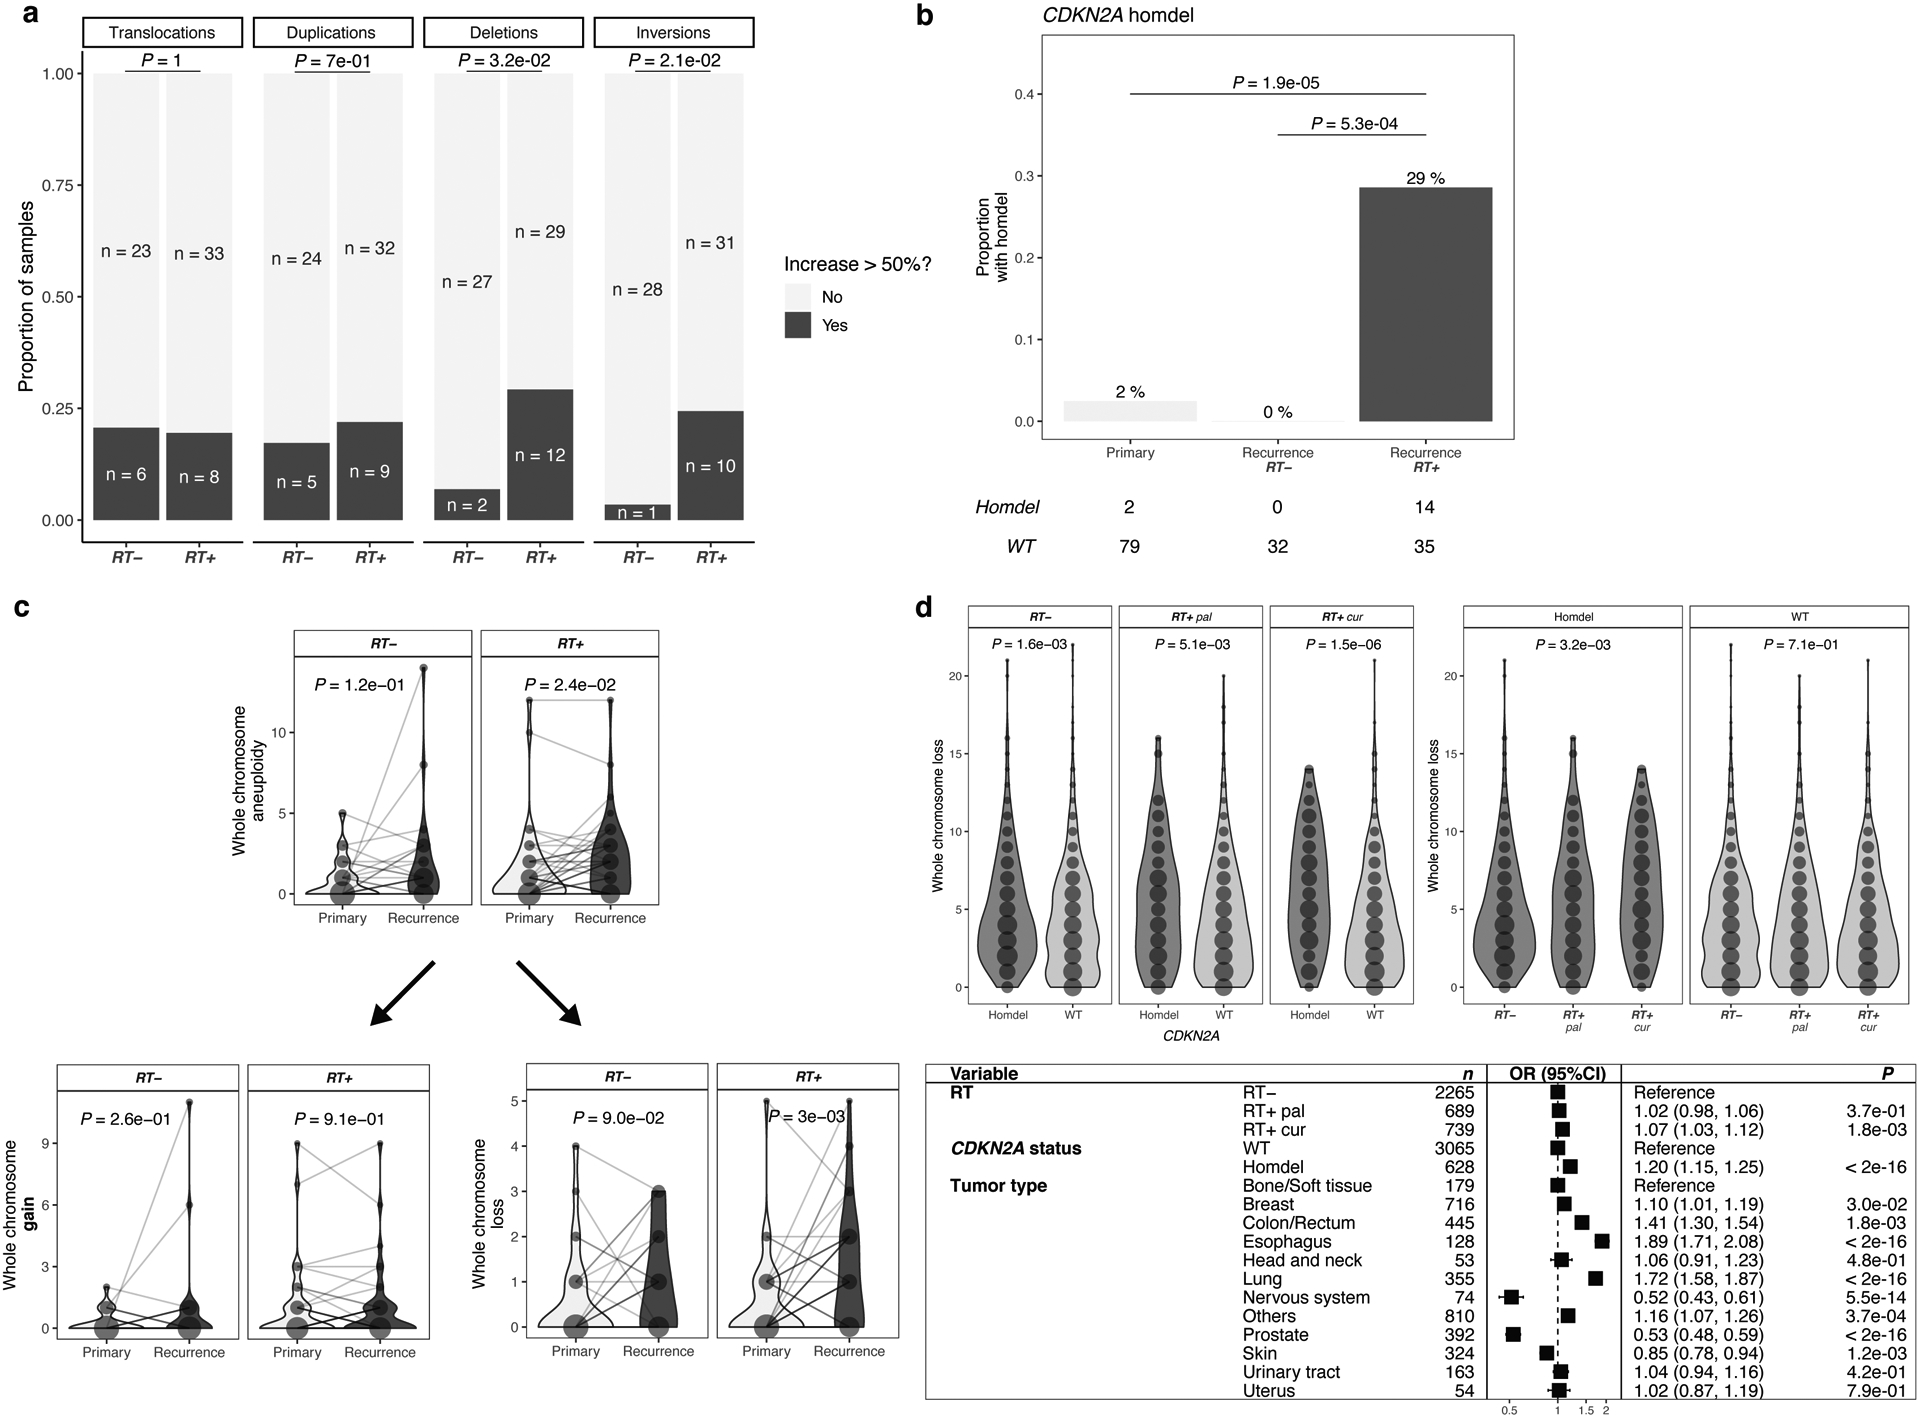
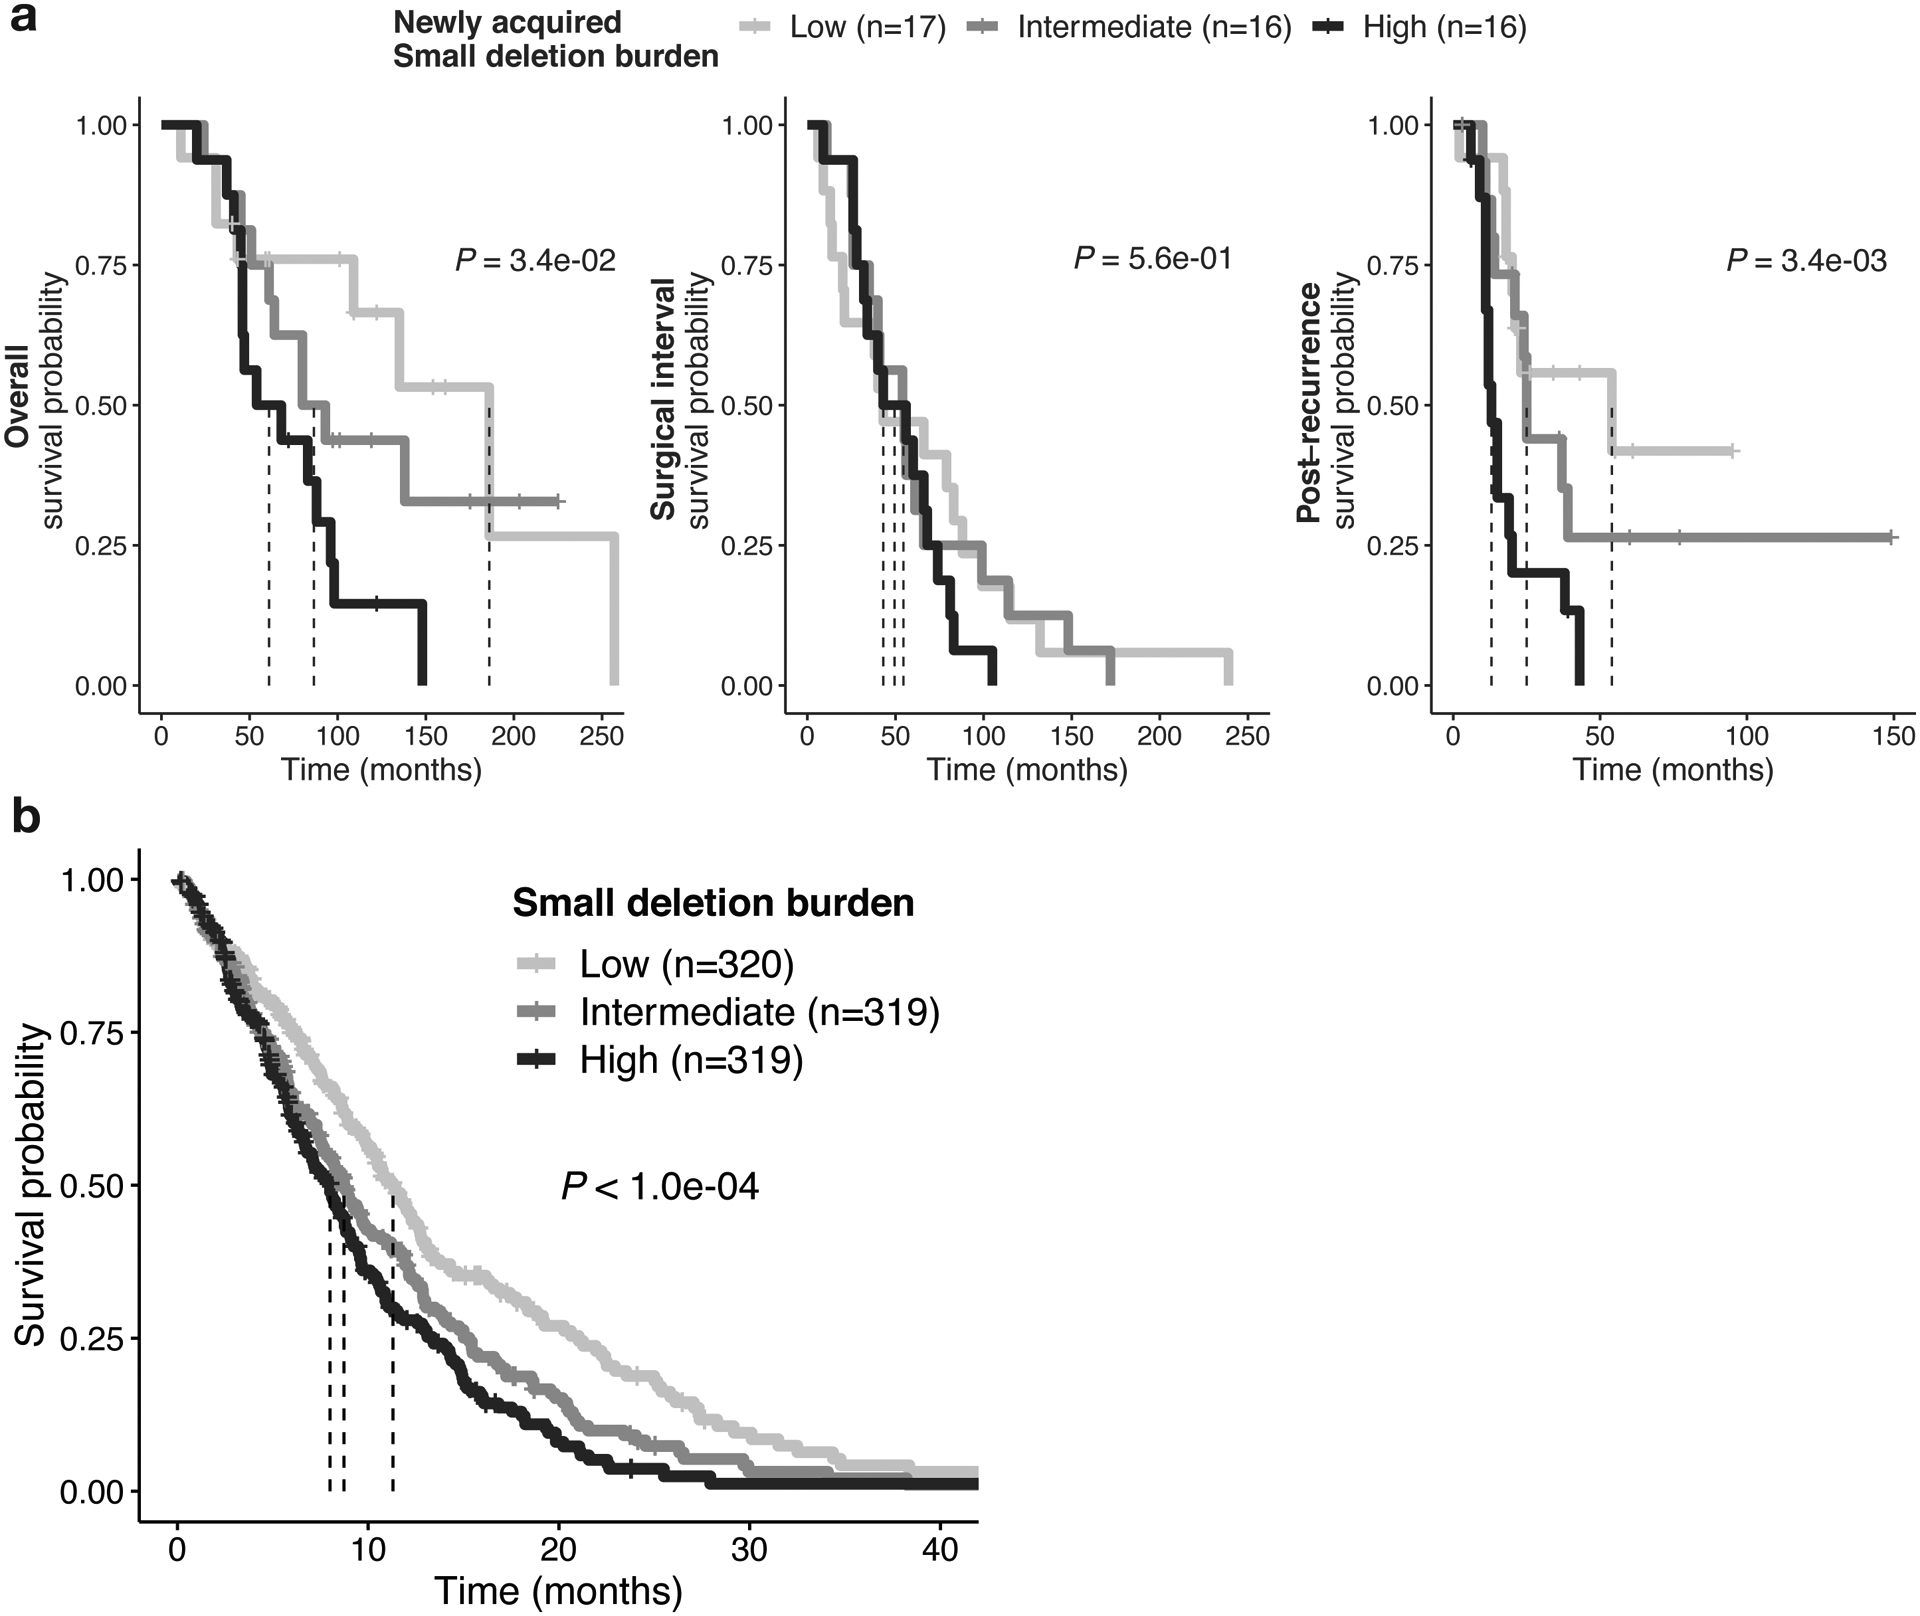
Ionizing radiation causes DNA damage and is a mainstay for cancer treatment, but understanding of its genomic impact is limited. We analyzed mutational spectra following radiotherapy in 190 paired primary and recurrent gliomas from the Glioma Longitudinal Analysis Consortium and 3,693 post-treatment metastatic tumors from the Hartwig Medical Foundation. We identified radiotherapy-associated significant increases in the burden of small deletions (5-15 bp) and large deletions (20+ bp to chromosome-arm length). Small deletions were characterized by a larger span size, lacking breakpoint microhomology and were genomically more dispersed when compared to pre-existing deletions and deletions in non-irradiated tumors. Mutational signature analysis implicated classical non-homologous end-joining-mediated DNA damage repair and APOBEC mutagenesis following radiotherapy. A high radiation-associated deletion burden was associated with worse clinical outcomes, suggesting that effective repair of radiation-induced DNA damage is detrimental to patient survival. These results may be leveraged to predict sensitivity to radiation therapy in recurrent cancer.


Conflict of interest statement

Competing Interests

R.G.W.V. is a co-founder of Boundless Bio, Inc., which was not involved in the research presented here. R.G.W.V. is a member of Scientific Advisory Board of the Hartwig Medical Foundation. F.P.B. has performed consulting for Bristol Myers Squibb.

R.G.W.V., E.K., K.J.A., and F.P.B. are listed as inventors on a patent application filed by The Jackson Laboratory, related to the findings described here. The remaining authors declare no competing interests.

Figures

Extended Data Fig. 1
Extended Data Fig. 1. Radiotherapy specifically drives small deletion burden independent of multiple variables
a. Boxplot (in this and all following figures: boxes span quartiles, center lines as medians, whiskers represent absolute range, excluding outliers): burden of post treatment mutations (mutations/mb) in RT-naïve (n=34) and RT-received (n=156) patients from GLASS cohort. Mutations separated by DEL (deletions), INS (insertions) and SNV (single nucleotide variants). Two-sided Mann-Whitney U test. b. Acquired small deletion burden comparison between RT-naïve and RT-received cases separated by molecular subtype. Two-sided Mann Whitney U test. c. Comparison of mean cancer cell fraction of small deletions per patient in GLASS separated by P, primary-only fraction, S, shared fraction and R, recurrence-only fraction and by HM, hypermutation. Two-sided Mann-Whitney U test. d. Forest plots: multivariable log-linear regression model of acquired mutation burden (mutations/mb) in GLASS. Point, mean estimate; lines, 95%-confidence-interval. Two-sided t-test (**=p<0.01, ***=p<0.001). e. Sample selection and filtering criteria for HMF including a detailed description of the usage for specific figures. f. Separation of lung, breast and bone/soft tissue cancers into respective subtypes. Comparison of small deletion burden between RT−, RT+pal and RT+cur samples. Two-sided Kruskal-Wallis test. g. Boxplots depicting burden of small deletions in HRD-/MSI- (n=3,413), HRD+ (n=218) and MSI+ (n=62) samples from the HMF cohort separated by RT-status. Two-sided Mann-Whitney U test. h. Forest plots depicting multivariable log-linear regression model for mutation burdens in HMF. Two-sided t-test. Mutations separated into small deletions/insertions and SNVs. Independent variables: age, primary tumor location, DNA repair deficiency background and treatment including radiotherapy, taxane, alkylating agents, platin and others. i. Comparison of small deletion counts between control vs ionizing radiation groups (PMID:30982602). Two-sided Mann-Whitney U test. k. Distribution of small deletion counts per treatment group (PMID:30982602). Data presented as mean values +/− standard error of the mean, and red dots indicate median count of small deletions.
Extended Data Fig. 2
Extended Data Fig. 2. Genomic characteristics of RT-associated small deletions
a. Comparison of mean deletion lengths of acquired deletions in RT− vs RT+ IDHmut gliomas. Two-sided Mann-Whitney U test. b. Metastatic cohort: Boxplots depicting mean deletion lengths in RT-naïve (left) and palliative RT-treated (middle) and curative RT-treated (right) tumor samples separated by primary tumor location. Two-sided Kruskal-Wallis test. c. Longitudinal comparison (X-Axis) of mean distances of deletions to non-B DNA features in kb (Y-Axis) in IDHmut glioma cases. Cases separated by radiation treatment and hypermutation. Note that neither in hypermutated nor in RT-naïve non-hypermutated glioma samples significant longitudinal differences were observed. Two-sided paired Wilcoxon signed-rank test. d. Gene-wise dN/dS estimates by RT (rows) and fraction (columns) in GLASS. Two-sided likelihood ratio tests. Genes sorted by Q-value (Bonferroni-adjusted P-value) and P-value. Q-values indicated in color, whereas P-values shown in light grey. Q-value threshold of 0.05 indicated by a horizontal red line. e. Comparison of proportion of deletions for IDHmut glioma samples separated by RT and hypermutation. Two-sided paired Wilcoxon signed-rank test. For each sample, the proportion of deletions with 1bp length, > 1bp length with microhomology and > 1bp length without microhomology add up to 1. Bottom right panels (RT-received non-hypermutators) presented in Figure 2d and shown here for comparison with other groups. f. Comparison of proportion of deletions in metastatic cohort between RT-treated and RT-naïve cases using two-sided Kruskal-Wallis test. In bone/soft tissue, breast and head & neck and nervous system cancers, significantly lower proportions of deletions >1bp with microhomology were observed in RT-treated samples compared to RT-naïve samples. In contrast, RT-received breast, colon/rectum, esophagus, nervous system and prostate tumor samples showed significantly higher proportions in deletions > 1bp without microhomology. Boxes span quartiles, center lines as medians, whiskers represent absolute range, excluding outliers.
Extended Data Fig. 3
Extended Data Fig. 3. Mutational signatures associated with RT
a-d. Distribution of indel types for post-treatment mutations in the GLASS cohort, separated by RT (a, c, RT- negative; b, d, RT-treated) and HM (a-b, Hypermutator; c-d, Non-Hypermutator). Note that patterns of indels in hypermutated samples resemble the previously identified MSI signature ID2, whereas RT-treated Non-Hypermutant gliomas harbor large similarities with ID8. Sample sizes for each subgroup are annotated. e. Comprehensive comparison of all 17 COSMIC indel (ID) signatures in IDHmut glioma. Top 2 panels display longitudinal comparison of absolute signature contributions separated by radiation treatment (RT+ and RT−). Middle 2 panels display longitudinal comparison of relative signature contributions separated by radiation treatment. For these panels two-sided Mann-Whitney U test was applied for statistical testing. (ns = not significant, * = p < 0.05, ** = p < 0.01, *** = p < 0.001, **** = p < 0.0001). Note that ID8 is the only signature consistently associated with radiation therapy across different comparisons, nominating it as a robust signature of radiotherapy. Boxes span quartiles, center lines as medians, whiskers represent absolute range, excluding outliers. f. Absolute (top) and relative (bottom) contribution of ID8 signature in metastatic cohort compared between cases with prior radiation treatment and cases without prior radiation treatment separated by tumor types. Note that most tumor types show significantly higher values of the signature in curative RT+ cases. Two-sided Kruskal-Wallis test was applied for statistical testing. Boxes span quartiles, center lines as medians, whiskers represent absolute range, excluding outliers.
Extended Data Fig. 4
Extended Data Fig. 4. Effects of radiotherapy on structural variants
a. Analysis of structural variants (SVs) in glioma samples (Translocations, Duplications, Deletions, Inversions). For each patient, number of SVs were calculated pre-and post-treatment and the proportional increase after therapy for each SV-type was plotted separately for RT-naive and RT-treated samples. Based on the distribution of proportional increase from primary to recurrence, a cutoff was defined for > 50% increase that was further used for analyses in Figure 4a. b. To support analyses presented in Figure 4a, a multivariable logistic regression model was fitted for the >50% increase values of the structural variant types. Two-sided Wald test. This model includes radiation therapy, temozolomide therapy, molecular subtype and surgical interval as variables. c. Schematic overview of separation of aneuploidy events into whole chromosome aneuploidy as a result of simple segregation errors and partial aneuploidy as a result of complex segregation errors. d. Longitudinal analysis of partial aneuploidy in IDHmut glioma samples. Dots are proportional to the frequency of whole chromosome loss integer for each subgroup. Two-sided paired Wilcoxon rank-signed test. e. Multivariable Poisson regression model for whole chromosome losses in IDHmut glioma including molecular subtype, RT, TMZ, surgical interval and CDKN2A status at recurrence as variables. Two-sided Wald test. Note that CDKN2A homdel, but not RT is independently associated with higher whole chromosome losses. f. Density plots over integers of whole chromosome deletion scores for comparison between primary vs recurrent glioma samples, separated by radiotherapy. g. Density plots over integers of whole chromosome deletion scores for comparison between RT-naïve vs RT+pal vs RT+cur and/or CDKN2A homdel vs. wild-type (WT) samples from the HMF dataset. Note that CDKN2A homdel is associated with higher whole chromosome deletion scores, independent of RT. Within samples with CDKN2A homdel, samples that were RT-treated with curative intent show the highest deletion scores.
Extended Data Fig. 5
Extended Data Fig. 5. Radiotherapy-associated genomic scars linked to poor survival
a. Left: Kaplan-Meier survival plot comparing overall survival time dependent on CDKN2A status at recurrence using two-sided log-rank test in IDH mutant glioma samples. Right: Multivariable cox regression model including CDKN2A status at recurrence, TMZ-treatment, molecular subtype and Age as variables. Two-sided Wald test was applied. b. Left: Kaplan Meier survival plot comparing survival time dependent on CDKN2A status at metastasis using two-sided log-rank test RT-treated metastases (n = 958 with available survival information). Middle: Kaplan Meier survival plot comparing survival time dependent on aneuploidy burden at metastasis using two-sided log-rank test in RT-treated metastases (n = 958 with available survival information). Samples were separated into 3 tertiles based on whole chromosome loss aneuploidy scores: high (top tertile), intermediate (middle tertile) and low (bottom tertile). Right: Kaplan Meier survival plot comparing survival time dependent RT signature ID8 burden at metastasis using two-sided log-rank test in RT-treated metastases (n = 958 with available survival information). Samples were separated into 3 tertiles based on ID8 burden: high (top tertile), intermediate (middle tertile) and low (bottom tertile). Note that a low ID8 burden is associated with better survival, indicating a better response to RT. c. Multivariable cox regression model including deletion burden at recurrence as continuous variable, CDKN2A homozygous deletion, Temozolomide-treatment, molecular subtype and age as variables in RT-treated IDH mutant samples.
Fig. 1.
Fig. 1.. Radiotherapy is associated with an increased small deletion burden
a. Boxplot (in this and all following figures: boxes span quartiles, center lines as medians, whiskers represent absolute range, excluding outliers) depicting the burden of newly acquired/post-treatment small deletions (deletions/Mb) in RT-naïve (n = 34) and RT-received (n = 156) patients from the GLASS cohort. Two-sided Mann-Whitney U test was applied for statistical testing. b. Longitudinal comparison of small deletion burden between primary and recurrent glioma samples, separated by hypermutation (HM) and Radiotherapy (RT). Two-sided paired Wilcoxon signed-rank test was applied for statistical testing c. Forest plot showing multivariable log-linear regression model of newly acquired small deletion burden(deletions/Mb) including 1. TMZ-treatment, 2. Hypermutation, 3. RT-treatment, 4. Molecular subtype and 5. Surgical interval (in months) as variables. Two-sided t-test was applied. OR, Odds Ratio, CI, confidence interval. d. Top. Metastatic cohort: Boxplots depicting small deletion burden (deletions/Mb) in RT-naïve (left), RT-treated with palliative intent (RT+ pal, middle) and RT-treated with curative intent (RT+ cur, right) tumor samples separated by primary tumor location. Two-sided Kruskal-Wallis test was applied for statistical testing. Bottom. Sample sizes of metastatic cohort separated by primary tumor location.
Fig. 2.
Fig. 2.. Radiotherapy-associated small deletions harbor a characteristic genomic signature
a. Length distribution in GLASS. Left: Mean deletion lengths in primary vs recurrent IDH mutant glioma (n=81), separated by RT-treatment (RT+, n=32, RT-, n=49). Two-sided paired Wilcoxon signed-rank test. Right: Y-Axis, proportion of deletions; X-Axis, deletion length >1bp. Proportions calculated for each patient, mean (point) and 95%-CI (line-range) compared longitudinally in RT-treated non-hypermutant glioma (n=44). Two-sided paired Wilcoxon signed-rank test (*=p<0.05, **=p<0.01). Shaded area (5–15 bp): size range for which the most apparent differences were observed. b. Length distribution in HMF. Left: Comparison of mean deletion lengths in RT-naïve vs RT+pal vs. RT+cur samples. Two-sided Kruskal-Wallis test. Right: Y-Axis, proportion of deletions; X-Axis, deletion length >1bp. Proportions calculated for each patient, mean (point) and 95%-CI (line-range) compared between RT-naïve vs. RT+pal vs. RT+cur samples. Two-sided Kruskal-Wallis test (*=p<0.05, **=p<0.01, ***=p<0.001, ****=p<0.0001). c. Relation to genomic features in GLASS. Left: Distribution of deletions in relation to genomic features. Y-Axis: non-B DNA genomic feature, X-Axis: Log10-ratio of mean distance of non-radiation-associated and radiation-associated post-treatment deletions to genomic feature over background distribution in non-hypermutated glioma samples (n=69). Distribution of radiation-associated deletions shows little variability (narrow 95%-CI) and resemble background distribution more closely (closer to 0). Two-sided Mann-Whitney U test. Right: Empirical cumulative distribution function (ECDF, Y-Axis) of distance to non-B DNA features in kb (X-Axis) post-radiated non-hypermutated recurrent samples (n=44). Neither in hypermutated, nor in RT-naïve non-hypermutated gliomas longitudinal differences were observed (Extended Data Fig. 2c). d. Small deletion categories in GLASS. Left: Separation of small deletions in the GLASS cohort into 3 major categories: 1bp (gray), >1bp without microhomology (purple) and >1bp with microhomology (orange) in IDH mutant gliomas (n=81). Microhomology category further classified based on the occurrence of microhomology repeat sequences and length of repeats. Right: Comparison of proportion of deletions for each RT-treated non-hypermutated glioma sample (n=44, further comparisons in Extended Data Fig. 2e) using two-sided paired Wilcoxon signed-rank test.
Fig. 3
Fig. 3. ID8 and APOBEC-SBS signatures associated with radiotherapy.
Indel (ID) and single base substitution (SBS) mutational signatures in the GLASS and HMF cohorts associated with RT (radiotherapy), Hypermutation (HM), Microsatellite instability (MSI) and homologous recombination deficiency (HRD). RT+, mean contribution = 0.22, vs. RT-, mean contribution, P = 7.4e-05, Q = 3.8e-03, two-sided Mann-Whitney U test and false discovery rate, respectively. Bars in the petal plots not reaching statistical significance (defined as FDR < 0.01) are indicated in grey.
Fig. 4.
Fig. 4.. RT is associated with aneuploidy and larger deletions
a. RT-associated increase in large deletions and inversions. Analysis of structural variants (SVs) after RT in IDHmut glioma samples with sufficient quality for calling (n = 70): Translocations, Duplications, Deletions, Inversions. For each patient, number of SVs were calculated pre-and post-treatment. Based on the distribution of percent increase from primary to recurrence, cutoff was set for > 50% increase (Extended Data Fig. 4a). Comparison of proportion of samples with/without increase of given SVs between RT-treated vs RT-naïve. Two-sided Fisher’s exact test. b. RT-associated CDKN2A homozygous deletions. Depicted are proportions of IDHmut glioma samples (n = 81) harboring a homozygous deletion in CDKN2A. Using two-sided Fisher’s exact test, proportions were compared between RT-received recurrence (RT+) vs. RT-naïve recurrence (RT-) vs. samples prior to treatment (Primary). Detailed distributions of whole chromosome deletion scores provided in Extended Data Fig. 4f. c. RT-associated whole chromosome aneuploidy. Upper: Longitudinal comparison of whole chromosome aneuploidy scores separated by RT-treatment for IDHmut glioma samples with sufficient quality for calling and complete treatment annotation (total n = 69, RT-treated n = 42, RT-naïve n = 27). Bottom: Separation of whole chromosome aneuploidy into whole chromosome gain (left) and whole chromosome loss (right) scores, respectively. Dots are proportional to the frequency of whole chromosome loss integer for each subgroup. Two-sided paired Wilcoxon rank-signed test. d. Validation of SV and aneuploidy results in HMF. Upper: Comparison of whole chromosome deletion scores between RT-naïve vs RT+pal vs RT+cur and/or CDKN2A homdel vs. WT samples. Note that CDKN2A homdel is associated with higher whole chromosome deletion scores, independent of RT. Within samples with CDKN2A homdel, samples that were RT-treated with curative intent show the highest deletion scores. Dots are proportional to the frequency of whole chromosome loss integer for each subgroup. Two-sided Kruskal-Wallis test. Detailed distributions of whole chromosome deletion scores provided in Extended Data Fig. 4g. Bottom: Multivariable poisson regression model for whole chromosome deletion scores integrating RT, CDKN2A and tumor types as variables. Two-sided Wald-test was applied.
Fig. 5.
Fig. 5.. RT-associated genomic changes are linked to poor survival
a. Association of RT-related deletions with survival in GLASS. Left: Kaplan-Meier survival plots comparing overall survival dependent on deletion burden at recurrence using log-rank test in RT-treated IDH mutant glioma samples (n = 49 with available survival information). Samples were separated into 3 tertile based on deletion burden at recurrence: High (top tertile), Intermediate (middle tertile) and Low (bottom tertile). Dotted lines indicate median overall survival times. Note the stepwise association of tertiles with survival. Middle: Kaplan-Meier survival plots comparing surgical interval/time to second surgery dependent on deletion burden at recurrence using two-sided log-rank test. Right: Kaplan-Meier survival plots comparing post-recurrence survival dependent on deletion burden at recurrence using two-sided log-rank test. Fig. 5bAssociation of RT-related deletions with survival in HMF. Kaplan-Meier survival plots comparing survival time dependent on deletion burden at metastasis using two-sided log-rank test in RT-treated metastases (n = 958 with available survival information). Samples were separated into 3 tertiles based on deletion burden: High (top tertile), Intermediate (middle tertile) and Low (bottom tertile). Dotted lines indicate median survival times. Note the stepwise association of tertiles with survival.

Similar articles

Cited by

References

    1. Barton MB et al.Estimating the demand for radiotherapy from the evidence: a review of changes from 2003 to 2012. Radiother Oncol 112, 140–4 (2014). - PubMed
    1. Tyldesley S et al.Estimating the need for radiotherapy for patients with prostate, breast, and lung cancers: verification of model estimates of need with radiotherapy utilization data from British Columbia. Int J Radiat Oncol Biol Phys 79, 1507–15 (2011). - PubMed
    1. Chang HHY, Pannunzio NR, Adachi N & Lieber MR Non-homologous DNA end joining and alternative pathways to double-strand break repair. Nat Rev Mol Cell Biol 18, 495–506 (2017). - PMC - PubMed
    1. Campbell BB et al.Comprehensive Analysis of Hypermutation in Human Cancer. Cell 171, 1042–1056 e10 (2017). - PMC - PubMed
    1. Barthel FP et al.Longitudinal molecular trajectories of diffuse glioma in adults. Nature 576, 112–120 (2019). - PMC - PubMed

Publication types