. 2021 May 11:13:683290.
doi: 10.3389/fnsyn.2021.683290. eCollection 2021.

Aberrant Synaptic PTEN in Symptomatic Alzheimer's Patients May Link Synaptic Depression to Network Failure

Affiliations

Aberrant Synaptic PTEN in Symptomatic Alzheimer's Patients May Link Synaptic Depression to Network Failure

Marta Díaz González et al. Front Synaptic Neurosci. .

Abstract

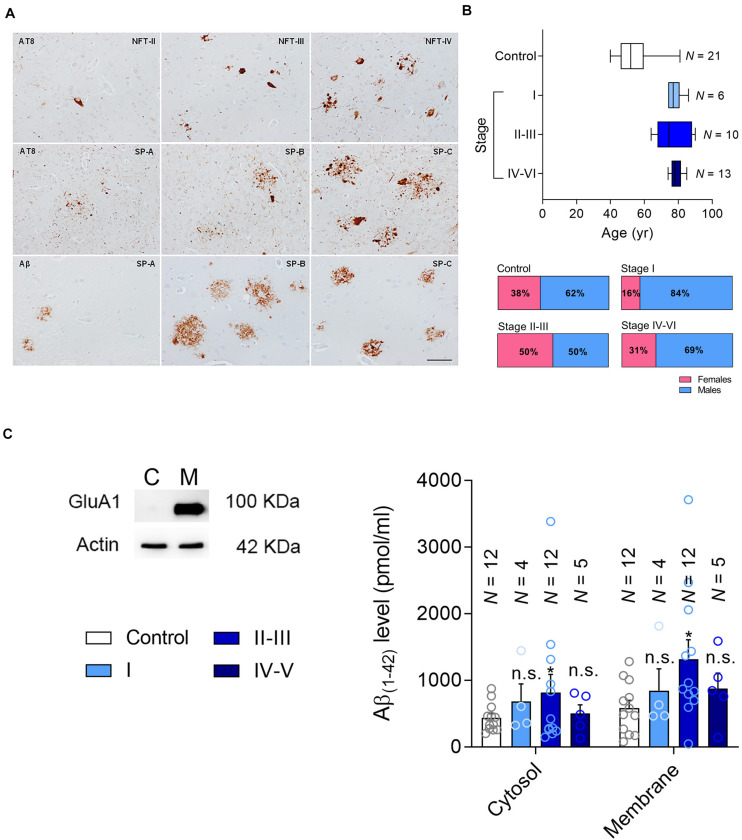
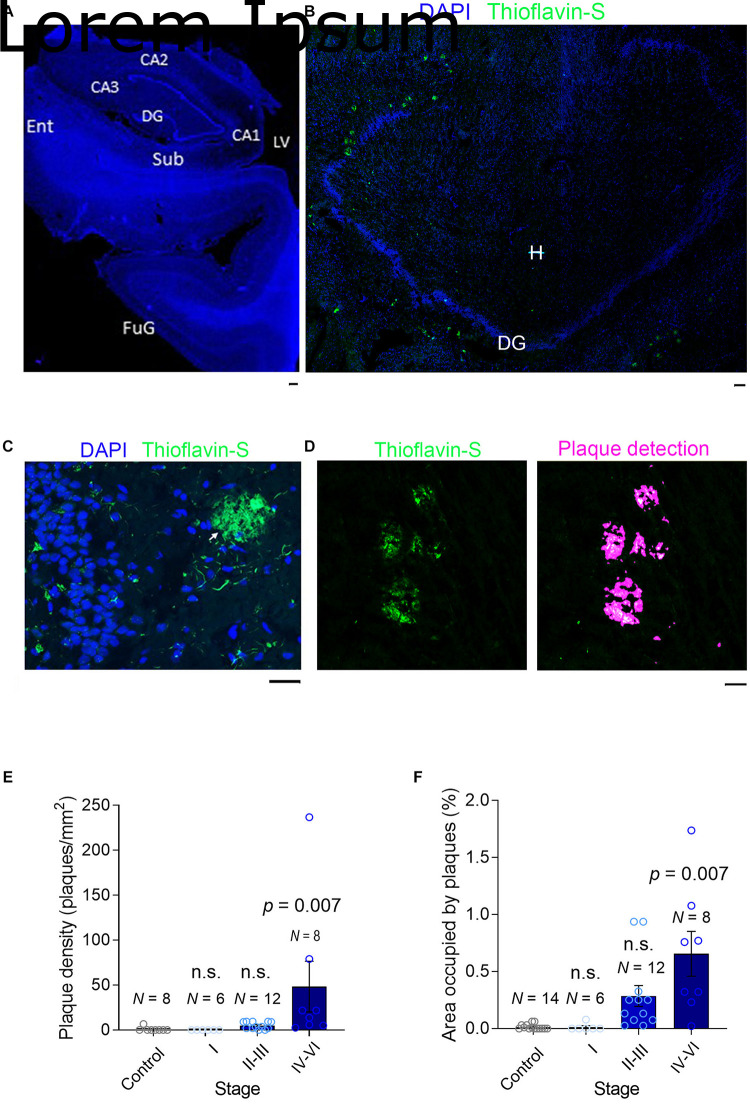
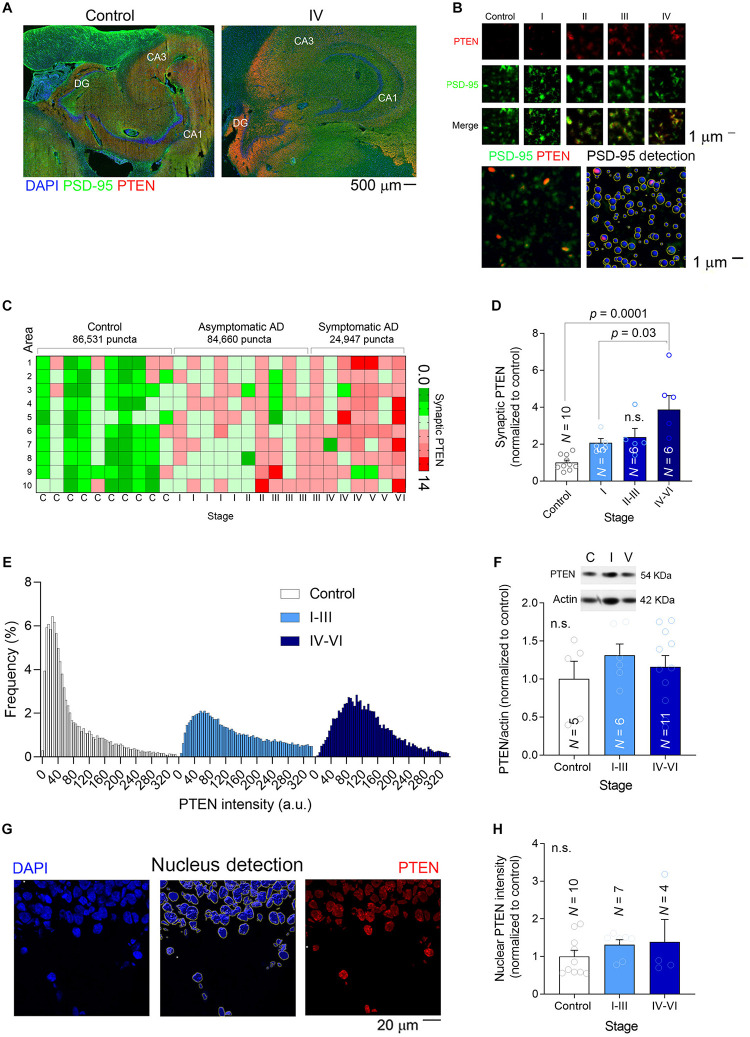
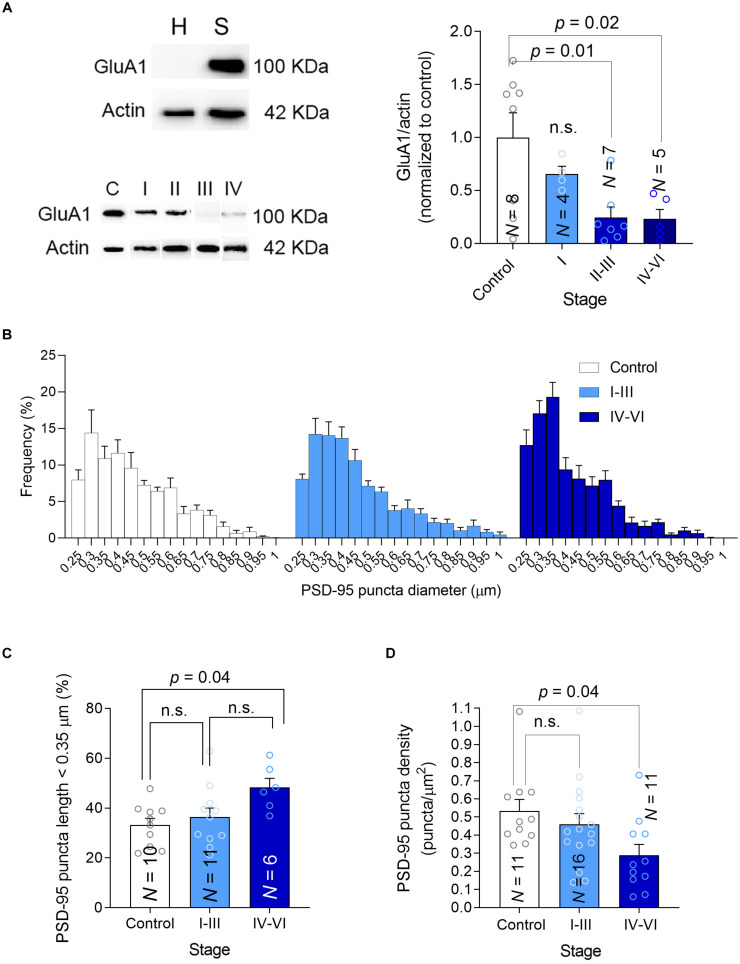
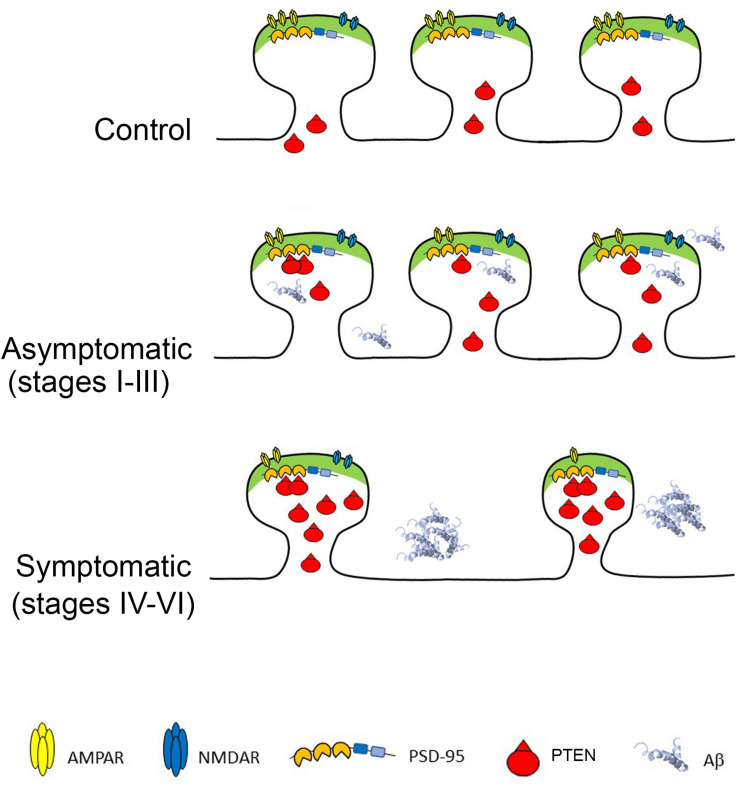
In Alzheimer's disease (AD), Amyloid β (Aβ) impairs synaptic function by inhibiting long-term potentiation (LTP), and by facilitating long-term depression (LTD). There is now evidence from AD models that Aβ provokes this shift toward synaptic depression by triggering the access to and accumulation of PTEN in the postsynaptic terminal of hippocampal neurons. Here we quantified the PTEN in 196,138 individual excitatory dentate gyrus synapses from AD patients at different stages of the disease and from controls with no neuropathological findings. We detected a gradual increase of synaptic PTEN in AD brains as the disease progresses, in conjunction with a significant decrease in synaptic density. The synapses that remain in symptomatic AD patients are more likely to be smaller and exhibit fewer AMPA receptors (AMPARs). Hence, a high Aβ load appears to strongly compromise human hippocampal synapses, as reflected by an increase in PTEN, inducing a loss of AMPARs that may eventually provoke synaptic failure and loss.

Keywords: PSD-95; cognition; hippocampus; human; plasticity; synaptosomes.


Conflict of interest statement

The authors declare that the research was conducted in the absence of any commercial or financial relationships that could be construed as a potential conflict of interest.

Figures

FIGURE 1
FIGURE 1
Patient classification and Aβ measurement. (A) Representative changes in pathological Alzheimer’s disease revealed with anti-phosphorylated tau (clone AT8) and Aβ antibodies, categorized following the Braak and Braak nomenclature adapted for immunohistochemistry in paraffin sections: NFT II, III and IV indicate neurofibrillary tangle pathology stages II, III and IV; SP A, B and C refer to senile plaque burden stages A, B and C. The upper row mainly focuses on the NFT pathology, whereas the middle row on the tau pathology surrounding amyloid deposits. The lower row shows the morphology of diffuse plaques on the left and the core plaques on the right, with a mixture of them in the central image. (B) The age range (Top) and gender of the patients in the current cohort (Bottom). (C) Left, the hippocampal formation was fractionated into the cytosolic (C) and membrane fractions (M), testing the efficacy of this separation in western blots probed for the AMPAR subunit as a marker of the membrane fraction marker. Right, Aβ levels were determined by ELISA [pg/μg protein] in the cytosolic and membrane fractions. N is the number of patients, and the data are presented as the average ± SEM.
FIGURE 2
FIGURE 2
Plaque detection in AD samples. (A) A slide scanner image (×5) of a DAPI-stained section (stage II) containing the hippocampal formation: Sub, Subiculum; Ent, Entorhinal Cortex; DG, Dentate Gyrus; LV, Lateral Ventricle; CA1-3, Cornu Ammonis; FuG, Fusiform Gyrus. (B) A confocal image (×10) of a section (stage V) containing mainly the dentate gyrus stained with DAPI (blue) and Thioflavin-S to detect the Aβ plaques (green): DG, Dentate Gyrus; H, Hilus. (C) High magnification image (×40) of the dentate gyrus (stage V) where small Aβ aggregates can be seen in the granule cell layer (GCL, green) and an extensive Aβ plaque is seen in the molecular layer (ML). (D) Left, Part of a section scanned with a slide scanner (×10) with Aβ plaques. Right, automatic detection of plaques, used to calculate the plaque density and the area occupied by plaques. (E,F) A bar graph showing the plaque density and the area occupied by plaque. N is the number of patients, and the data are presented as the average ± SEM. The scale bar in all the images is 50 μm.
FIGURE 3
FIGURE 3
Synaptic PTEN levels are enhanced in AD patients. (A) Tile-scanned confocal images (×10) of the hippocampal formation stained for PTEN (red) and PSD-95 (green): DG, Dentate Gyrus; CA1-3, Cornu Ammonis. (B) Top, High magnification super-resolution images (63×) showing PSD-95 puncta (green) and PTEN (red) at different stages. Bottom, Detection of PSD-95 puncta with Imaris software. (C) Heat map showing the average relative PTEN levels (normalized to controls) in 10 high-resolution confocal fields per patient. (D) A bar graph depicting the relative synaptic PTEN in each group of patients. N is the number of patients, and the P-values were determined by One Way ANOVA followed by Tukey’s multiple comparisons test. (E) Frequency distribution of the PTEN in individual PSD-95 puncta. (F) The total amount of PTEN in brain lysates was determined in western blots. Inset, a representative example of a blot at different stages. N is the number of patients and the P-values were determined by One Way ANOVA. (G) Left, A confocal image (×40) of part of the dentate gyrus showing the nuclei stained with DAPI. Middle, The detection of nuclei to determine the amount of nuclear PTEN. Right, The pixels outside the nuclear areas were set to zero to observe only nuclear PTEN (red). (H) A bar graph depicting the relative nuclear PTEN in each group of patients. N is the number of patients and the P-value was determined by One Way ANOVA.
FIGURE 4
FIGURE 4
Synaptic GluA1, size and density. (A) Left-top, Hippocampal homogenates (H) were fractionated into crude synaptosomes (S), and the efficacy of fractionation was tested in western blots probed for the GluA1 AMPAR subunit as a synaptic marker. Left-bottom, A western blot showing the PTEN in synaptosomes, using actin as a loading control. Right, The average GluA1 in synaptosomes was determined in western blots. (B) Frequency size distribution of the PSD-95 puncta. (C) Bar graph showing the proportion (%) of small PSD-95 in each group. (D) Bar graph showing the density of PSD-95 puncta. In all the graphs, N is the number of patients and the data are presented as average ± SEM. P-values were determined by One Way ANOVA followed by Tukey’s multiple comparisons test.
FIGURE 5
FIGURE 5
Phosphatase and Tensin Homolog Deleted on Chromosome Ten (PTEN) at AD Synapses provokes Long-Term Depression and synaptic loss. Top: Healthy synapses exhibit basal synaptic transmission due to weak PTEN activity. Middle: in response to Aβ, PTEN is recruited to the postsynaptic membrane via PDZ-dependent interactions with PSD-95. The turnover of PIP3 by PTEN facilitates AMPAR endocytosis and removal from synapses. Bottom: When Aβ is elevated, the sustained recruitment of PTEN at the postsynaptic membrane leads to excessive removal of AMPARs, skewing synaptic plasticity toward depression and producing chronic synaptic weakening, shrinkage and loss. The cell death provoked by Aβ overload also contributes to synaptic loss.

Similar articles

Cited by

References

    1. Arendt K. L., Royo M., Fernandez-Monreal M., Knafo S., Petrok C. N., Martens J. R., et al. (2010). PIP3 controls synaptic function by maintaining AMPA receptor clustering at the postsynaptic membrane. Nat. Neurosci. 13 36–44. 10.1038/nn.2462 - DOI - PMC - PubMed
    1. Bayer T. A., Wirths O., Majtényi K., Hartmann T., Multhaup G., Beyreuther K., et al. (2001). Key factors in Alzheimer’s disease: β-amyloid precursor protein processing, metabolism and intraneuronal transport. Brain Pathol. 11 1–11. 10.1111/j.1750-3639.2001.tb00376.x - DOI - PMC - PubMed
    1. Braak H., Alafuzoff I., Arzberger T., Kretzschmar H., Del Tredici K. (2006). Staging of Alzheimer disease-associated neurofibrillary pathology using paraffin sections and immunocytochemistry. Acta Neuropathol. 112 389–404. 10.1007/s00401-006-0127-z - DOI - PMC - PubMed
    1. Chang E. H., Savage M. J., Flood D. G., Thomas J. M., Levy R. B., Mahadomrongkul V., et al. (2006). AMPA receptor downscaling at the onset of Alzheimer’s disease pathology in double knockin mice. Proc. Natl. Acad. Sci. U.S.A. 103 3410–3415. 10.1073/pnas.0507313103 - DOI - PMC - PubMed
    1. Cummings D. M., Liu W., Portelius E., Bayram S., Yasvoina M., Ho S.-H., et al. (2015). First effects of rising amyloid-β in transgenic mouse brain: synaptic transmission and gene expression. Brain 138 1992–2004. 10.1093/brain/awv127 - DOI - PMC - PubMed