. 2019 Jul 1;9(13):2735.
doi: 10.3390/app9132735. Epub 2019 Jul 6.

Bayesian Inference of Vocal Fold Material Properties from Glottal Area Waveforms Using a 2D Finite Element Model

Affiliations

Bayesian Inference of Vocal Fold Material Properties from Glottal Area Waveforms Using a 2D Finite Element Model

Paul J Hadwin et al. Appl Sci (Basel). .

Abstract

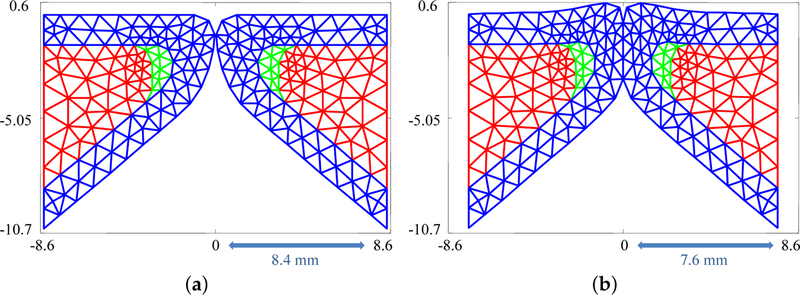
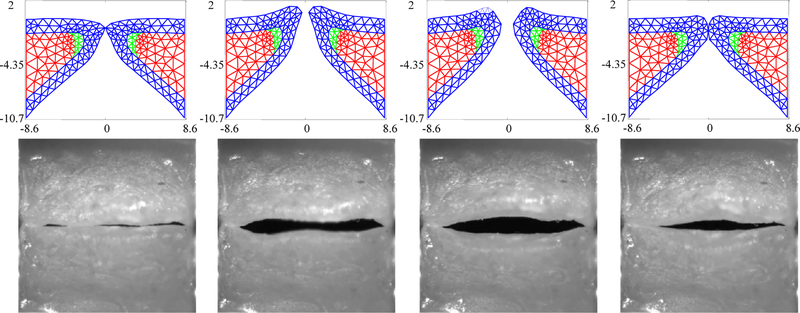
Bayesian estimation has been previously demonstrated as a viable method for developing subject-specific vocal fold models from observations of the glottal area waveform. These prior efforts, however, have been restricted to lumped-element fitting models and synthetic observation data. The indirect relationship between the lumped-element parameters and physical tissue properties renders extracting the latter from the former difficult. Herein we propose a finite element fitting model, which treats the vocal folds as a viscoelastic deformable body comprised of three layers. Using the glottal area waveforms generated by self-oscillating silicone vocal folds we directly estimate the elastic moduli, density, and other material properties of the silicone folds using a Bayesian importance sampling approach. Estimated material properties agree with the "ground truth" experimental values to within 3% for most parameters. By considering cases with varying subglottal pressure and medial compression we demonstrate that the finite element model coupled with Bayesian estimation is sufficiently sensitive to distinguish between experimental configurations. Additional information not available experimentally, namely, contact pressures, are extracted from the developed finite element models. The contact pressures are found to increase with medial compression and subglottal pressure, in agreement with expectation.

Keywords: Bayesian inverse analysis; finite element analysis; patient-specific modeling; silicone vocal fold models.


Conflict of interest statement

Conflicts of Interest: The authors declare no conflict of interest. The funders had no role in the design of the study; in the collection, analyses, or interpretation of data; in the writing of the manuscript, or in the decision to publish the results.

Figures

Figure 1.
Figure 1.
(a) Model of the geometry of the silicone vocal folds; and (b) image of the experimental flow facility.
Figure 2.
Figure 2.
(a) Finite element triangulation used to simulate the silicone vocal folds; and (b) mesh deformation occurring as a result of medial compression. Red region: body; green region: ligament; and blue region: cover.
Figure 3.
Figure 3.
Kinematics of the FE model in comparison with the observed high speed videoendoscopy (HSV) for the case with no medial compression (psub = 1 kPa) at several time points throughout a single oscillation cycle.
Figure 4.
Figure 4.
Comparison of the glottal area waveforms extracted from the FE model and the HSV for the case with no medial compression (psub = 1 kPa). Blue dashed line: HSV; red solid line: FE model; orange solid lines: uncertainty bounds from the FE estimate.
Figure 5.
Figure 5.
The glottal area waveform extracted from HSV of self-oscillating silicone vocal folds at psub = 1.00 kPa (a) without medial compression and (b) with medial compression. Blue dashed line: HSV; red solid line: FE model; orange solid lines: uncertainty bounds from the FE estimate.
Figure 6.
Figure 6.
Comparison on the glottal area waveforms extracted from HSV and the FE predictions from the fitted material properties for (a) psub = 0.91, kPa (b) psub = 1.00 kPa, (c) psub = 1.09 kPa, and (d) psub = 1.18 kPa. Blue dashed line: HSV; red solid line: FE model; orange solid lines: uncertainty bounds from the FE estimate.
Figure 7.
Figure 7.
(a) Relative error of the estimates; and (b) relative uncertainty for increasing ensemble size. Solid blue line: average; dashed red line: maximum.
Figure 8.
Figure 8.
The average (a) relative error and (b) relative uncertainty of the estimates as a function of time step size for various triangulations. Blue with the plus markers: 172 elements; red with circle markers: 205 elements; black with diamond markers: 263 elements.

References

    1. Story BH An overview of the physiology, physics and modeling of the sound source for vowels. Acoust. Sci. Technol 2002, 23, 195–206.
    1. Titze IR; Worley AS Modeling source-filter interaction in belting and high-pitched operatic male singing. J. Acoust. Soc. Am 2009, 126, 1530–1540. - PMC - PubMed
    1. Birkholz P; Kroger B; Neuschaefer-Rube C Model-based reproduction of articulatory trajectories for consonant–vowel sequences. IEEE Trans. Audio Speech Lang. Process 2011, 19, 1422–1433.
    1. Zañartu M; Galindo GE; Erath BD; Peterson SD; Wodicka GR; Hillman RE Modeling the effects of a posterior glottal opening on vocal fold dynamics with implications for vocal hyperfunction. J. Acoust. Soc. Am 2014, 136, 3262–3271. - PMC - PubMed
    1. Xue Q; Zheng X The effect of false vocal folds on laryngeal flow resistance in a tubular three-dimensional computational laryngeal Model. J. Voice 2017, 31, 275–281. - PMC - PubMed

LinkOut - more resources