

A Comparison Between Chemo-Radiotherapy Combined With Immunotherapy and Chemo-Radiotherapy Alone for the Treatment of Newly Diagnosed Glioblastoma: A Systematic Review and Meta-Analysis
- PMID: 34046356
- PMCID: PMC8144702
- DOI: 10.3389/fonc.2021.662302
A Comparison Between Chemo-Radiotherapy Combined With Immunotherapy and Chemo-Radiotherapy Alone for the Treatment of Newly Diagnosed Glioblastoma: A Systematic Review and Meta-Analysis
Abstract
Background: Immunotherapy for GBM is an emerging field which is increasingly being investigated in combination with standard of care treatment options with variable reported success rates.
Objective: To perform a systematic review of the available data to evaluate the safety and efficacy of combining immunotherapy with standard of care chemo-radiotherapy following surgical resection for the treatment of newly diagnosed GBM.
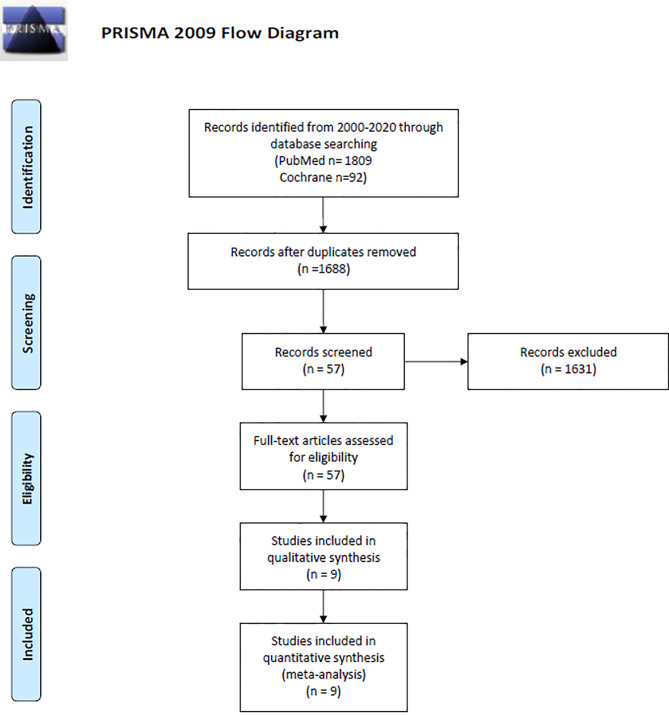
Methods: A literature search was performed for published clinical trials evaluating immunotherapy for GBM from January 1, 2000, to October 1, 2020, in PubMed and Cochrane using PICOS/PRISMA/MOOSE guidelines. Only clinical trials with two arms (combined therapy vs. control therapy) were included. Outcomes were then pooled using weighted random effects model for meta-analysis and compared using the Wald-type test. Primary outcomes included 1-year overall survival (OS) and progression-free survival (PFS), secondary outcomes included severe adverse events (SAE) grade 3 or higher.
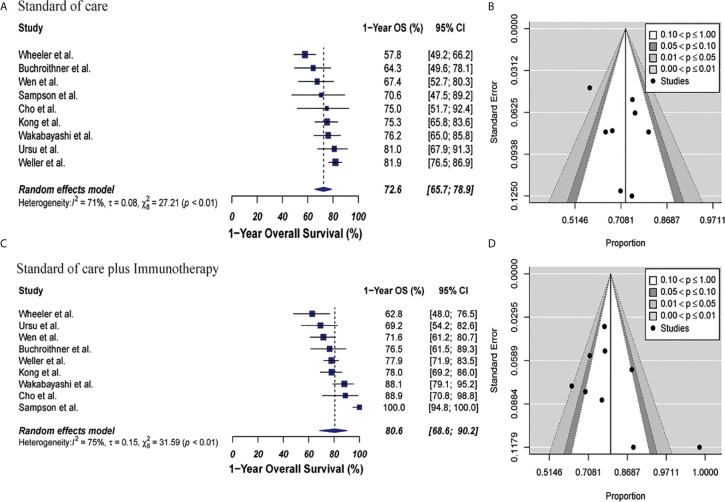
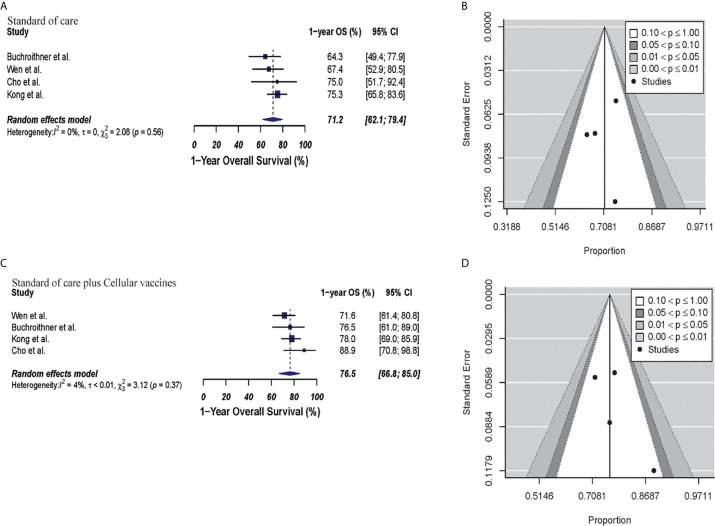
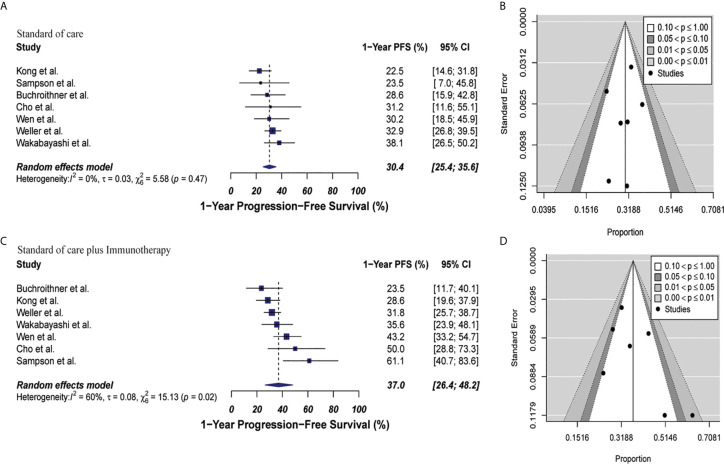
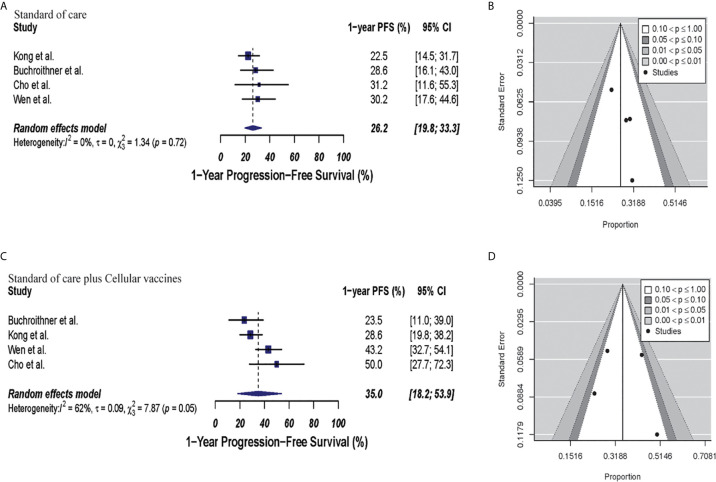
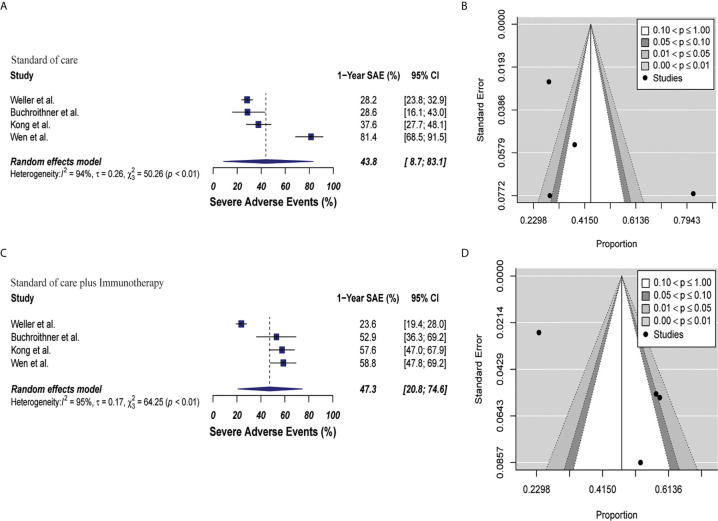
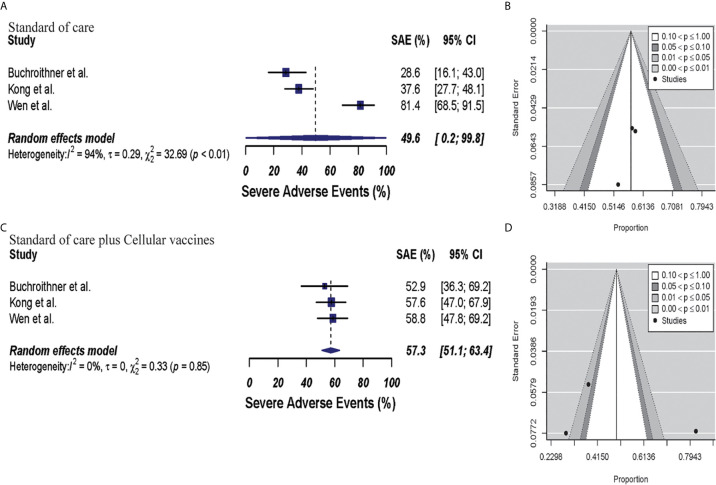
Results: Nine randomized phase II and/or III clinical trials were included in the analysis, totaling 1,239 patients. The meta-analysis revealed no statistically significant differences in group's 1-year OS [80.6% (95% CI: 68.6%-90.2%) vs. 72.6% (95% CI: 65.7%-78.9%), p = 0.15] or in 1-year PFS [37% (95% CI: 26.4%-48.2%) vs. 30.4% (95% CI: 25.4%-35.6%) p = 0.17] when the immunotherapy in combination with the standard of care group (combined therapy) was compared to the standard of care group alone (control). Severe adverse events grade 3 to 5 were more common in the immunotherapy and standard of care group than in the standard of care group (47.3%, 95% CI: 20.8-74.6%, vs 43.8%, 95% CI: 8.7-83.1, p = 0.81), but this effect also failed to reach statistical significance.
Conclusion: Our results suggests that immunotherapy can be safely combined with standard of care chemo-radiotherapy without significant increase in grade 3 to 5 SAE; however, there is no statistically significant increase in overall survival or progression free survival with the combination therapy.
Keywords: chemo-radiotherapy; glioma; high-grade glioma; immunotherapy; newly diagnosed glioblastoma; vaccine.
Copyright © 2021 Lara-Velazquez, Shireman, Lehrer, Bowman, Ruiz-Garcia, Paukner, Chappell and Dey.
Conflict of interest statement
The authors declare that the research was conducted in the absence of any commercial or financial relationships that could be construed as a potential conflict of interest.
Figures
Similar articles
-
Efficacy and safety of innate and adaptive immunotherapy combined with standard of care in high-grade gliomas: a systematic review and meta-analysis.Front Immunol. 2023 Jul 6;14:966696. doi: 10.3389/fimmu.2023.966696. eCollection 2023. Front Immunol. 2023. PMID: 37483593 Free PMC article.
-
Active Immunotherapy for Glioblastoma Treatment: A Systematic Review and Meta-Analysis.Cancer Control. 2022 Jan-Dec;29:10732748221079474. doi: 10.1177/10732748221079474. Cancer Control. 2022. PMID: 36748348 Free PMC article.
-
Safety and Efficacy of PD-1/PD-L1 inhibitors combined with radiotherapy in patients with non-small-cell lung cancer: a systematic review and meta-analysis.Cancer Med. 2021 Feb;10(4):1222-1239. doi: 10.1002/cam4.3718. Epub 2021 Jan 19. Cancer Med. 2021. PMID: 33465302 Free PMC article.
-
Progression-Free but No Overall Survival Benefit for Adult Patients with Bevacizumab Therapy for the Treatment of Newly Diagnosed Glioblastoma: A Systematic Review and Meta-Analysis.Cancers (Basel). 2019 Nov 4;11(11):1723. doi: 10.3390/cancers11111723. Cancers (Basel). 2019. PMID: 31689995 Free PMC article. Review.
-
Survival Outcomes Among Patients With High-Grade Glioma Treated With 5-Aminolevulinic Acid-Guided Surgery: A Systematic Review and Meta-Analysis.Front Oncol. 2019 Jul 17;9:620. doi: 10.3389/fonc.2019.00620. eCollection 2019. Front Oncol. 2019. PMID: 31380272 Free PMC article.
Cited by
-
Glioblastoma Multiforme Selective Nanomedicines for Improved Anti-Cancer Treatments.Pharmaceutics. 2022 Jul 12;14(7):1450. doi: 10.3390/pharmaceutics14071450. Pharmaceutics. 2022. PMID: 35890345 Free PMC article.
-
Exploiting radiation immunostimulatory effects to improve glioblastoma outcome.Neuro Oncol. 2023 Mar 14;25(3):433-446. doi: 10.1093/neuonc/noac239. Neuro Oncol. 2023. PMID: 36239313 Free PMC article.
-
Epigenetic modification in radiotherapy and immunotherapy for cancers.Tzu Chi Med J. 2024 Sep 5;36(4):396-406. doi: 10.4103/tcmj.tcmj_3_24. eCollection 2024 Oct-Dec. Tzu Chi Med J. 2024. PMID: 39421493 Free PMC article. Review.
-
Tumor Microenvironment and Microvascular Density in Human Glioblastoma.Cells. 2022 Dec 20;12(1):11. doi: 10.3390/cells12010011. Cells. 2022. PMID: 36611806 Free PMC article.
-
The IAP antagonist birinapant enhances chimeric antigen receptor T cell therapy for glioblastoma by overcoming antigen heterogeneity.Mol Ther Oncolytics. 2022 Nov 15;27:288-304. doi: 10.1016/j.omto.2022.11.004. eCollection 2022 Dec 15. Mol Ther Oncolytics. 2022. PMID: 36458202 Free PMC article.
References
Publication types
Grants and funding
LinkOut - more resources
Full Text Sources
Other Literature Sources