. 2021 May 11:9:639944.
doi: 10.3389/fcell.2021.639944. eCollection 2021.

Vitamin C Inhibits Blood-Stage Plasmodium Parasites via Oxidative Stress

Affiliations

Vitamin C Inhibits Blood-Stage Plasmodium Parasites via Oxidative Stress

Xiaoyu Shi et al. Front Cell Dev Biol. .

Abstract

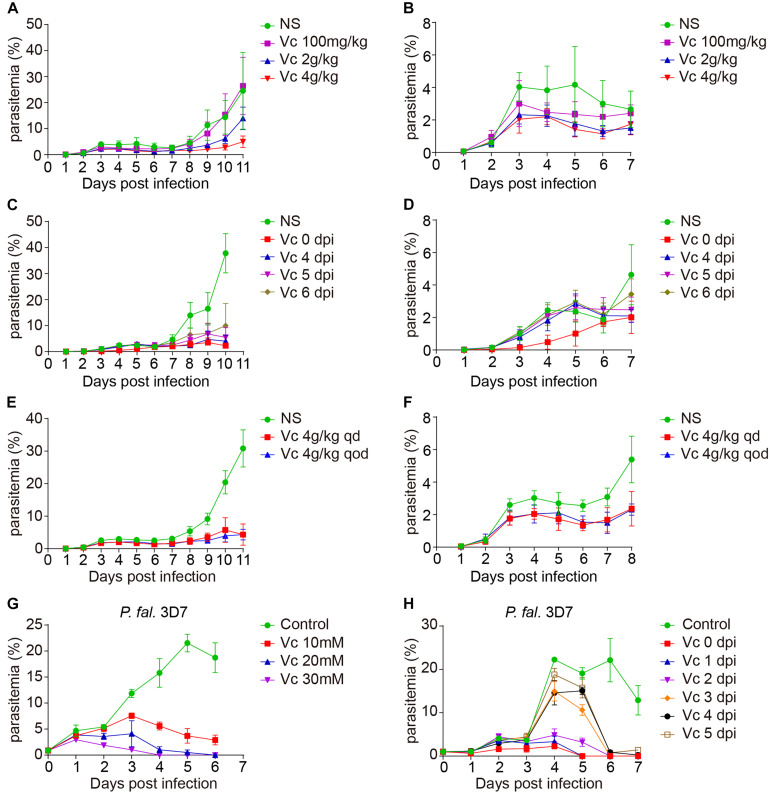
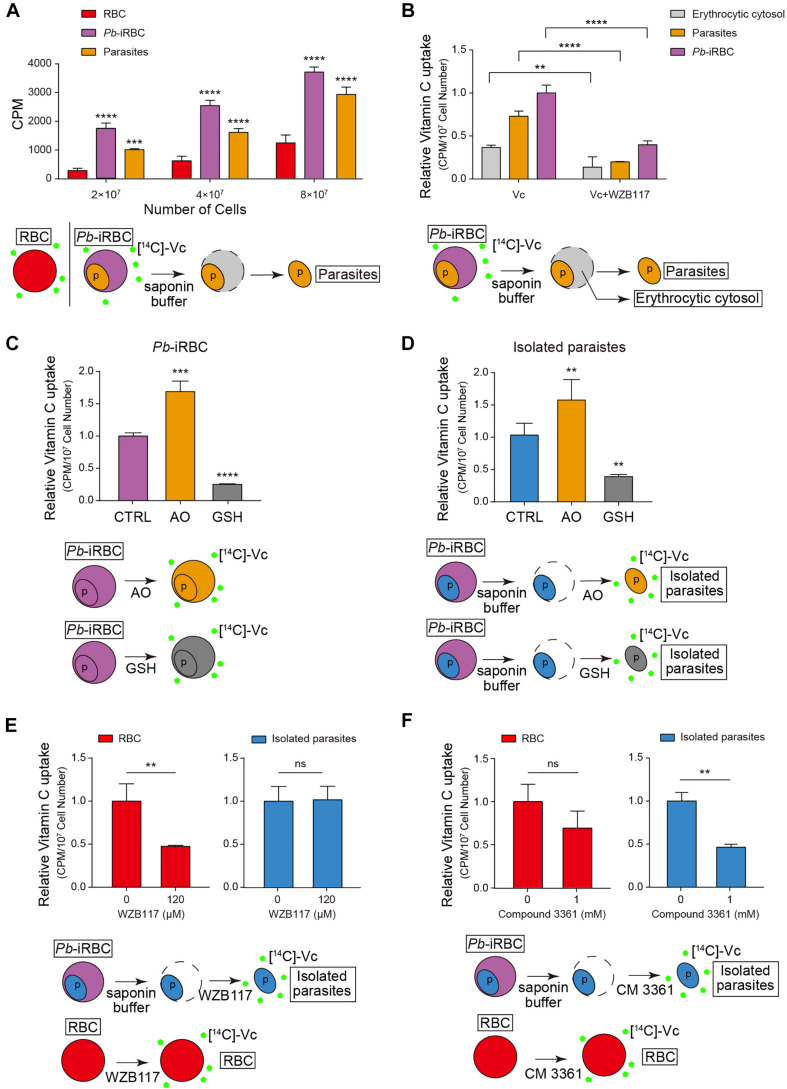
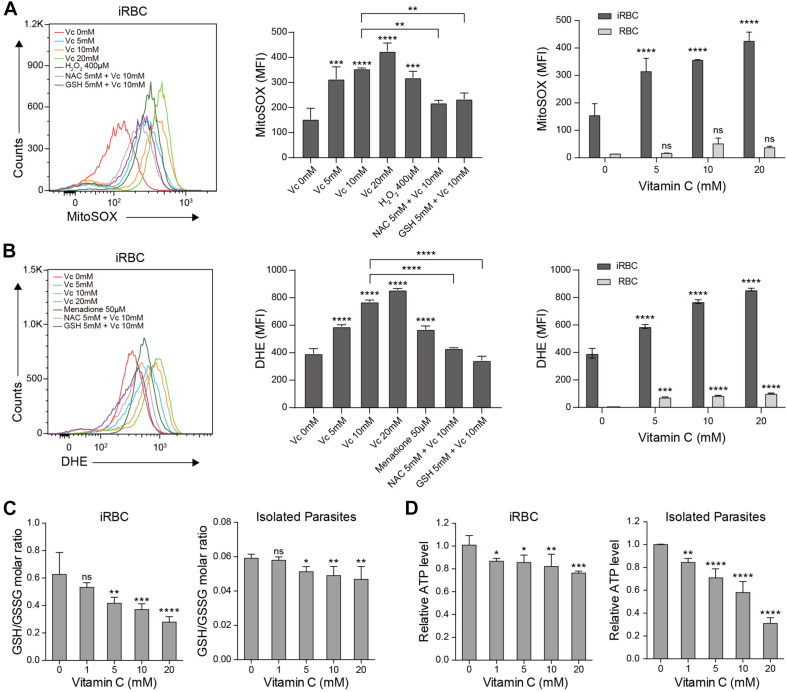
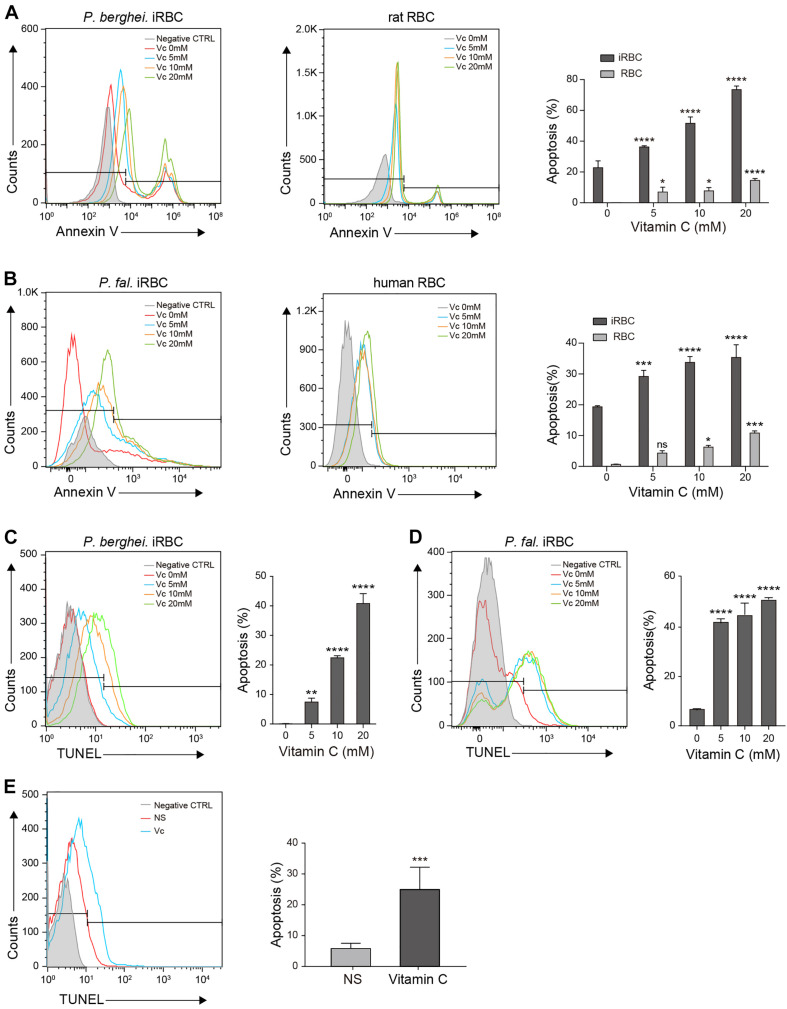
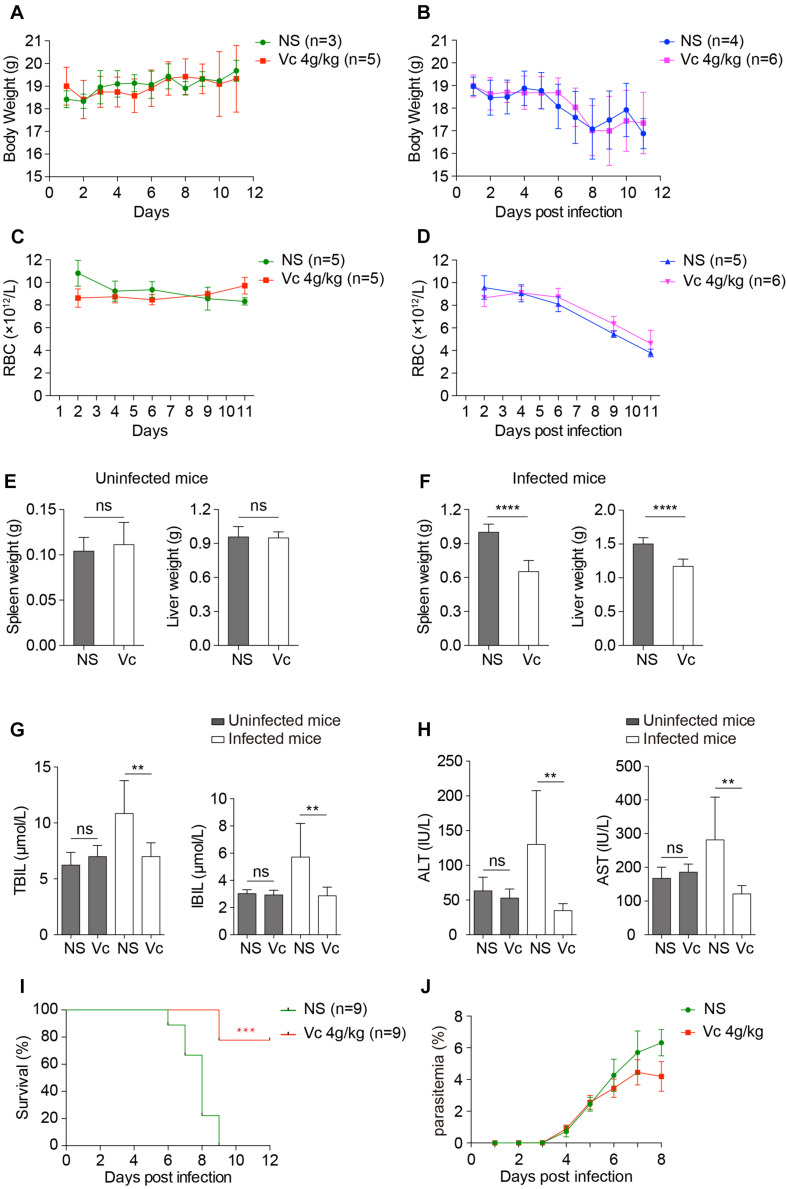
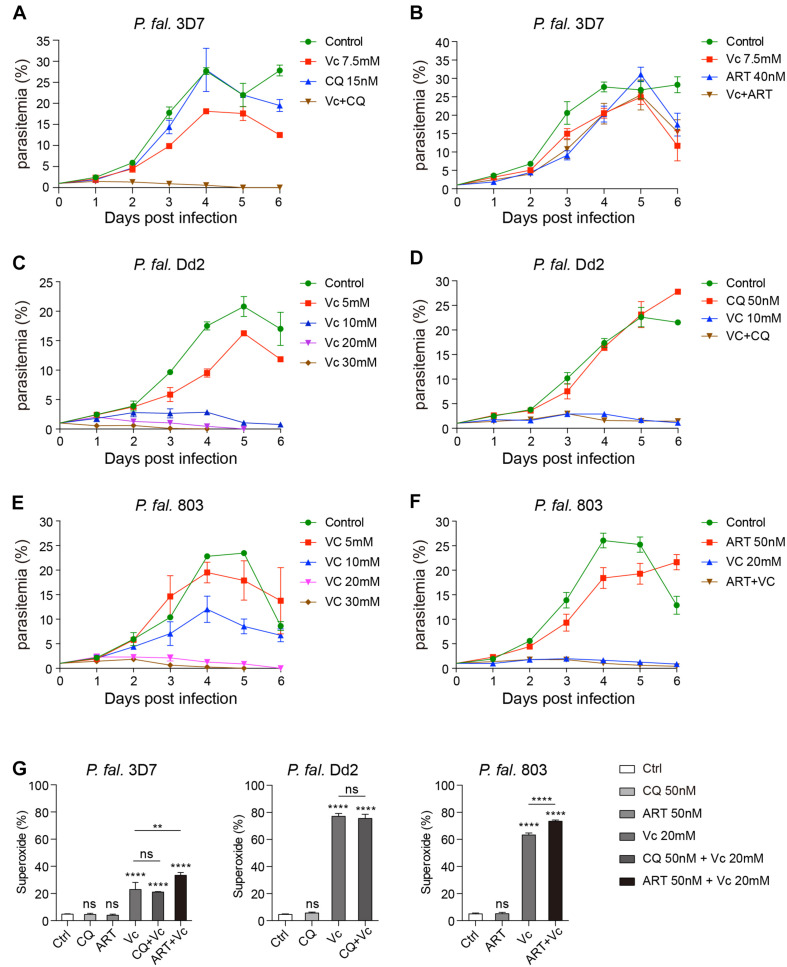
During the Plasmodium erythrocytic cycle, glucose is taken up by glucose transporters (GLUTs) in red blood cells (RBCs) and supplied to parasites via the Plasmodium hexose transporter. Here, we demonstrate that the glucose uptake pathway in infected RBCs (iRBCs) can be hijacked by vitamin C (Vc). GLUTs preferentially transport the oxidized form of Vc, which is subsequently reduced in the cytosol. Vc, which is expected to burden the intracellular reducing capacity, inhibits Plasmodium berghei and Plasmodium falciparum growth. Vc uptake is drastically increased in iRBCs, with a large proportion entering parasites. Increased absorption of Vc causes accumulation of reactive oxygen species, reduced ATP production, and elevated eryptosis in iRBCs and apoptosis in parasites. The level of oxidative stress induced by Vc is significantly higher in iRBCs than uninfected RBCs, not seen in chloroquine or artemisinin-treated iRBCs, and effective in inhibiting chloroquine or artemisinin-resistant parasites. These findings provide important insights into the drug sensitivity of Plasmodium.

Keywords: Plasmodium; eryptosis; glucose transporter; oxidative stress; vitamin C (ascorbic acid).


Conflict of interest statement

The authors declare that the research was conducted in the absence of any commercial or financial relationships that could be construed as a potential conflict of interest.

Figures

FIGURE 1
FIGURE 1
Vitamin C inhibits Plasmodium growth. (A) Vc (4 g/kg) inhibited P. berghei ANKA growth in BALB/c mice (n = 10–11 mice/group). Normal saline (NS) or Vc was injected intraperitoneally once a day from day 0. NS vs. 100 mg/kg Vc: n.s., NS vs. 2 g/kg Vc: P < 0.0001, NS vs. 4 g/kg Vc: P < 0.0001, 2 g/kg Vc vs. 4 g/kgVc: P < 0.01. (B) Parasitemia on days 1–7 p.i. in the mice from (A). (C) Vc treatment inhibited parasite growth when administered from days 4 to 6 p.i. (n = 4–9 mice/group). Similar to (A), 4 g/kg Vc was injected once a day starting from different time points (days 0, 4, 5, and 6 p.i.). NS vs. Vc treatment from days 0/4/5/6 p.i.: P < 0.0001. (D) Parasitemia on days 1–7 p.i. in the mice from (C). (E) Vc treatment was also effective when the administration interval was extended (n = 8 mice/group). The frequency of Vc administration was once every day (qd) or once qod. NS vs. Vc 4 g/kg qd/qod: P < 0.0001; Vc 4 g/kg qd vs. Vc 4 g/kg qod: n.s. (F) Parasitemia on days 1–8 p.i. in the mice from (E). (G) Vc inhibited blood-stage P. falciparum 3D7 growth in vitro. P. falciparum 3D7 was cultured in vitro with a starting parasitemia of 1% at day 0 (n = 3/group). The indicated dose of Vc was added to the media for 3 h daily from day 0 and parasitemia determined daily before Vc treatment. Control vs. Vc 10/20/30 mM: P < 0.0001. (H) 20 mM Vc inhibited P. falciparum 3D7 growth when administered from days 1/2/3/4/5 (n = 3/group). Control vs. Vc treatment from days 0/1/2/3/4/5: P < 0.0001. All data shown are mean ± SD and representative of three independent experiments. Two-way ANOVA with Tukey multiple comparisons was used to analyzed the data. n.s., not significant.
FIGURE 2
FIGURE 2
Vitamin C is taken up by erythrocytes and parasites through different transporters. (A) The amount of Vc taken up by iRBCs increased compared to uninfected RBCs, and Vc was also taken up by parasites in iRBCs. The uptake was measured in the presence of RPMI 1640 medium, which contains 2 g/L of glucose (∼11 mM). Data are mean ± SD and were analyzed by two-way ANOVA with Tukey multiple comparisons. (B) GLUT inhibitor WZB117 inhibited Vc uptake in iRBCs. Infected RBCs were pretreated with or without 120 μM WZB117 and detected the amount of Vc uptaken by iRBCs, isolated parasites, and erythrocytic cytosol, respectively. Uptake values (CPM) were normalized to cell number. Data are shown as mean ± SD and analyzed by two-way ANOVA with Tukey multiple comparisons. (C) Ascorbate oxidase (AO; 10 U/mL) increased Vc uptake in iRBCs, whereas GSH (10 mM) decreased Vc uptake. 2 × 10⁷ iRBCs were pretreated with PBS, 10 U/mL AO, or 10 mM GSH for 5 min and then incubated with [14C]-Vc to detect Vc uptaken. Relative [14C]-Vc uptake in the PBS-treated group was defined as 100%. Data are mean ± SD, and one-way ANOVA was performed. (D) AO increased Vc uptake in isolated parasites, whereas GSH decreased Vc uptake. Parasites isolated from 4 × 10⁷ iRBCs were pretreated with PBS, 10 U/mL AO, or 10 mM GSH, and the amount of Vc taken up was measured. Data are presented and analyzed as described in (C). (E) WZB117 inhibited Vc uptake in normal RBCs but not in isolated parasites; 2 × 10⁷ RBCs or parasites isolated from 4 × 10⁷ iRBCs were pretreated with or without 120 μM WZB117 for 5 min before incubation with [14C]-Vc. Relative [14C]-Vc uptake in RBCs and parasites without WZB117 treatment was defined as 100%. Unpaired two-tailed t test was used. (F) Plasmodium hexose transporter (HT) inhibitor compound 3361 inhibited Vc uptake in isolated parasites but not in normal RBCs. 2 × 10⁷ RBCs or parasites isolated from 4 × 10⁷ iRBCs were pretreated with or without 1 mM compound 3361 for 5 min. Data are expressed and analyzed as described in (E). All data are representative of at least three repetitions. **P < 0.01, ***P < 0.001, ****P < 0.0001, and n.s., not significant.
FIGURE 3
FIGURE 3
Vitamin C causes oxidative stress in P. berghei–infected RBCs and parasites. (A) Vc induced mitochondrial superoxide production in a dose-dependent manner in P. berghei–infected RBCs, which could be reversed by the antioxidants N-acetyl cysteine (NAC) and glutathione (GSH). Left: Representative FACS plots of superoxide production in iRBCs. Middle: Quantitative superoxide production in iRBCs (n = 3/group). One-way ANOVA was performed to detect statistical differences. Right: Quantitative superoxide production in both iRBCs and RBCs (n = 3/group). Differences between Vc-treated iRBCs/RBCs and non-treated iRBCs/RBCs were analyzed by two-way ANOVA with Tukey multiple comparisons. (B) Vc induced superoxide production in a dose-dependent manner in P. berghei–infected RBCs measured by DHE, which could be reversed by NAC and GSH. Left: Representative FACS plots of superoxide production in iRBCs. Middle: Quantitative superoxide production in iRBCs (n = 3/group). Right: Quantitative superoxide production in both iRBCs and RBCs (n = 3/group). (C) Vc treatment decreased the GSH/GSSG ratio in P. berghei–infected RBCs (left panel) and isolated P. berghei parasites (right panel) (n = 5/group). (D) Vc decreased ATP production in P. berghei–infected RBCs (left panel) and isolated parasites (right panel) (n = 5/group). Based on calibration, the ATP concentrations of the tested samples derived from iRBCs and isolated parasites treated with 0 mM Vc are 5.40 ± 0.33 μM and 0.72 ± 0.003 μM. One-way ANOVA was performed to analyzed the results in (C, D). All data are presented as mean ± SD and are representative of at least three repetitions. *P < 0.05, **P < 0.01, ***P < 0.001, ****P < 0.0001, and n.s., not significant.
FIGURE 4
FIGURE 4
Vitamin C promotes apoptosis in Plasmodium-infected RBCs and parasites. (A) Vc induced significant apoptosis in P. berghei–infected RBCs and mild apoptosis in uninfected normal RBCs. Left: Representative FACS plots of iRBCs labeled with annexin V–FITC. Middle: Representative FACS plots of RBCs labeled with annexin V–FITC. Right: Quantitative analysis of apoptosis in iRBCs and RBCs treated with different doses of Vc (n = 3/group). Differences between Vc-treated iRBCs/RBCs and non-treated iRBCs/RBCs were analyzed by two-way ANOVA with Tukey multiple comparisons. (B) Vc induced significant apoptosis in P. falciparum–infected RBCs and mild apoptosis in uninfected normal RBCs. Left: Representative FACS plots of iRBCs labeled with annexin V–FITC. Middle: Representative FACS plots of RBCs labeled with annexin V–FITC. Right: Quantitative analysis of apoptosis in iRBCs and RBCs treated with different doses of Vc (n = 3/group). Differences between Vc-treated iRBCs/RBCs and non-treated iRBCs/RBCs were analyzed as described in (A). (C) Vc induced apoptosis in P. berghei parasites. Representative FACS plots of iRBCs stained with TUNEL are displayed in the left panel. Quantitative analysis of apoptosis in P. berghei parasites is shown in the right panel, and the non-treated group was used as a control (n = 3/group). Data were analyzed by one-way ANOVA. (D) Vc induced apoptosis in P. falciparum parasites. Representative FACS plots of iRBCs stained with TUNEL are displayed in the left panel. Quantitative analysis of apoptosis in P. falciparum parasites is shown in the right panel, and the non-treated group was used as a control (n = 3/group). One-way ANOVA was performed. (E) Vc induced apoptosis in parasites cultured in vivo. P. berghei–infected mice were treated with NS or 4 g/kg Vc from day 0 for 3–4 days until parasitemia reached 2%. Isolated parasites were analyzed by TUNEL assay (n = 6 mice/group). The results were analyzed by unpaired two-tailed t test. Data are expressed as mean ± SD and representative of three independent experiments. *P < 0.05, **P < 0.01, ***P < 0.001, ****P < 0.0001, and n.s., not significant.
FIGURE 5
FIGURE 5
Vitamin C treatment improves the health conditions of infected mice and inhibits cerebral malaria development. (A, B) Vc treatment did not influence body weight in uninfected mice (A) or P. berghei–infected mice (B). (A): NS vs. Vc, n.s. (B): NS vs. Vc, n.s. (C, D) Vc treatment did not influence total RBC number in uninfected mice (C) or P. berghei–infected mice (D). (C): NS vs. Vc, n.s. (D): NS vs. Vc, n.s. Two-way ANOVA was performed in (A–D). (E) Vc treatment at 4 g/kg for 12 days did not influence spleen and liver weight in normal uninfected mice (n = 5 mice/group). (F) Vc treatment 4 g/kg remarkably alleviated hepatosplenomegaly on day 11 p.i. compared to the NS-treated group (n = 5–7 mice/group). (G) Daily treatment of 4 g/kg Vc significantly decreased TBIL and IBIL serum levels in infected mice but had no influence on uninfected mice (n = 10/group). (H) Daily treatment of 4 g/kg Vc significantly decreased ALT and AST serum levels in infected mice but had no influence on uninfected mice (n = 10/group). Results in (E–H) were analyzed by unpaired two-tailed t test. (I) Vc treatment significantly inhibited cerebral malaria development in C57BL/6 mice. Survival rates between two groups were compared by the log-rank test. (J) Parasitemia of mice in (I). Data are presented as mean ± SD and representative of three repetitions. **P < 0.01, ***P < 0.001, ****P < 0.0001, and n.s., not significant.
FIGURE 6
FIGURE 6
Vitamin C inhibits chloroquine- and artemisinin-resistant P. falciparum growth through induction of oxidative stress. (A) Vc had a synergistic effect with chloroquine (CQ) on P. falciparum 3D7 growth inhibition in vitro. Compared to the control group and the 7.5 mM Vc or 15 nM CQ treatment groups, the parasite growth was remarkably inhibited when treated with both 7.5 mM Vc and 15 nM CQ (P < 0.0001). (B) Combined treatment with Vc and artemisinin (ART) limited parasite growth inhibition. Vc + ART vs. Control: P < 0.01, Vc + ART vs. Vc 7.5 mM/ART 40 nM: n.s. (C) Vc significantly inhibited the growth of CQ-resistant P. falciparum Dd2. Control vs. Vc 5 mM/10 mM/20 mM/30 mM: P < 0.0001. (D) CQ did not influence the treatment effect of Vc in P. falciparum Dd2. Control vs. CQ 50 nM: n.s., control vs. Vc 10 mM/Vc + CQ: P < 0.0001, Vc 10 mM vs. Vc + CQ: n.s. (E) Vc significantly inhibited the growth of ART-resistant P. falciparum 803. Control vs. Vc 5 mM: n.s., control vs. Vc 10 mM/20 mM/30 mM: P < 0.0001. (F) ART did not influence the treatment effect of Vc in P. falciparum 803. Control vs. ART 50 nM: P < 0.01, control vs. Vc 20 mM/Vc + ART: P < 0.0001, Vc 20 mM vs. Vc + ART: n.s. The three P. falciparum strains were cultured with a starting parasitemia of 1% on day 0. All drugs were administered from day 0. The indicated dose of Vc and ART was administered for 3 h, whereas CQ was administered for 24 h from day 0. Parasitemia was determined daily before drug treatment. Differences between each drug treatment group and the control group were analyzed by two-way ANOVA with Tukey multiple comparisons. (G) Vc induced mitochondrial superoxide production in P. falciparum 3D7, chloroquine-resistant P. falciparum Dd2 and artemisinin-resistant P. falciparum 803 parasites cultured in vitro (n = 3/group). The superoxide production of P. falciparum–infected RBCs was measured by MitoSOX Red, and analyzed by one-way ANOVA. Data shown as mean ± SD. **P < 0.01, ****P < 0.0001, and n.s., not significant.

Similar articles

Cited by

References

    1. Agar N. S., Sadrzadeh S. M., Hallaway P. E., Eaton J. W. (1986). Erythrocyte catalase. A somatic oxidant defense? J. Clin. Invest. 77 319–321. 10.1172/JCI112294 - DOI - PMC - PubMed
    1. Agathocleous M., Meacham C. E., Burgess R. J., Piskounova E., Zhao Z., Crane G. M., et al. (2017). Ascorbate regulates haematopoietic stem cell function and leukaemogenesis. Nature 549 476–481. 10.1038/nature23876 - DOI - PMC - PubMed
    1. Altenberg B., Greulich K. O. (2004). Genes of glycolysis are ubiquitously overexpressed in 24 cancer classes. Genomics 84 1014–1020. 10.1016/j.ygeno.2004.08.010 - DOI - PubMed
    1. Cameron E., Pauling L. (1976). Supplemental ascorbate in the supportive treatment of cancer: prolongation of survival times in terminal human cancer. Proc. Natl. Acad. Sci. U.S.A. 73 3685–3689. 10.1073/pnas.73.10.3685 - DOI - PMC - PubMed
    1. Cameron E., Pauling L. (1978). Supplemental ascorbate in the supportive treatment of cancer: reevaluation of prolongation of survival times in terminal human cancer. Proc. Natl. Acad. Sci. U.S.A. 75 4538–4542. 10.1073/pnas.75.9.4538 - DOI - PMC - PubMed

LinkOut - more resources