. 2021 May 22;3(2):lqab043.
doi: 10.1093/nargab/lqab043. eCollection 2021 Jun.

A map of the SARS-CoV-2 RNA structurome

Affiliations

A map of the SARS-CoV-2 RNA structurome

Ryan J Andrews et al. NAR Genom Bioinform. .

Abstract

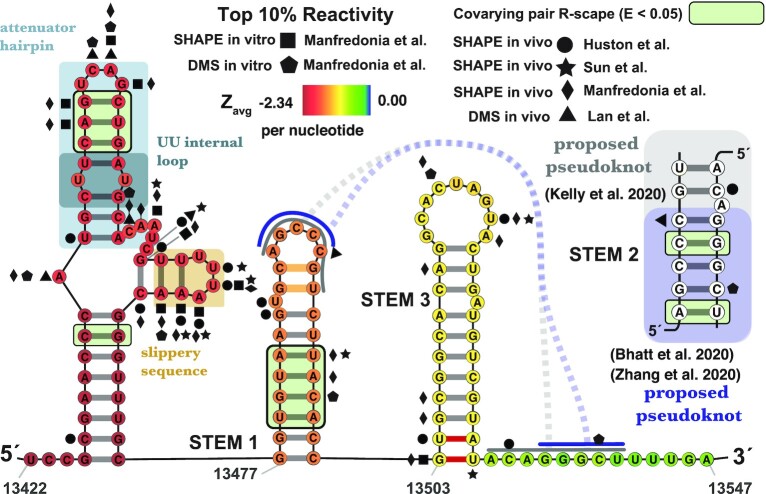
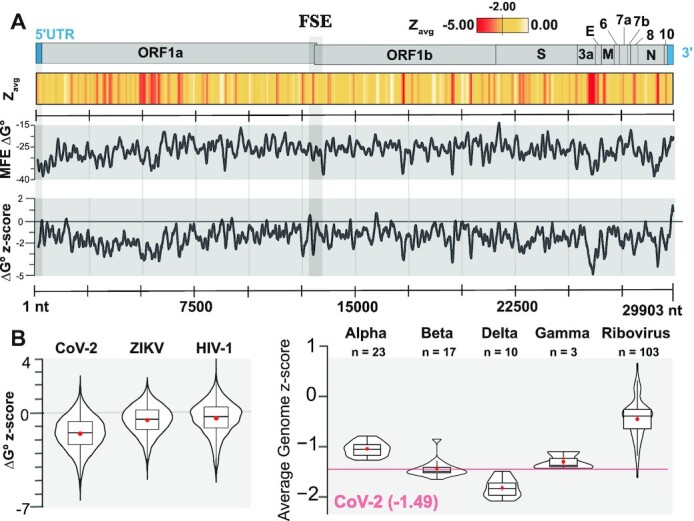
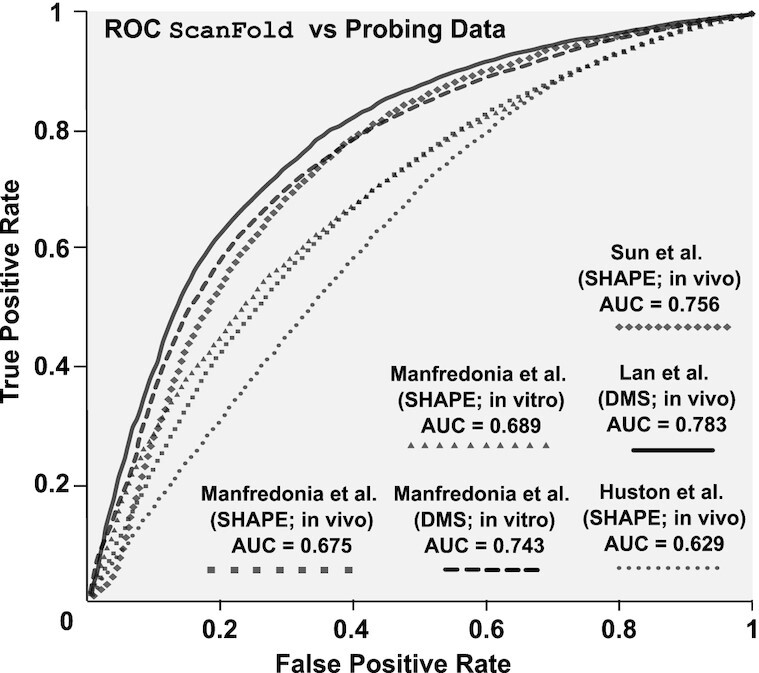
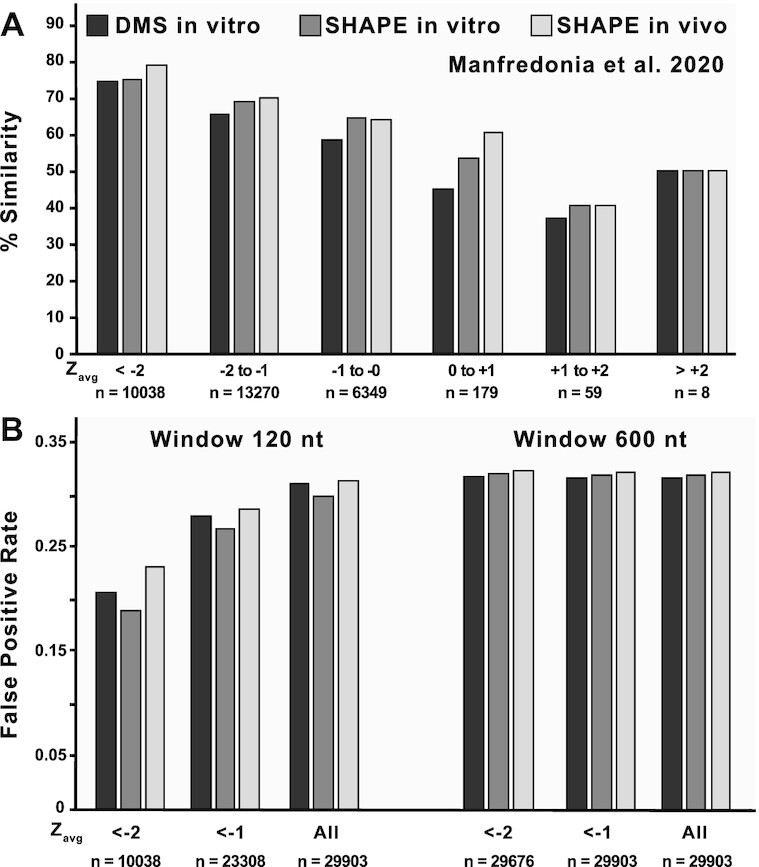
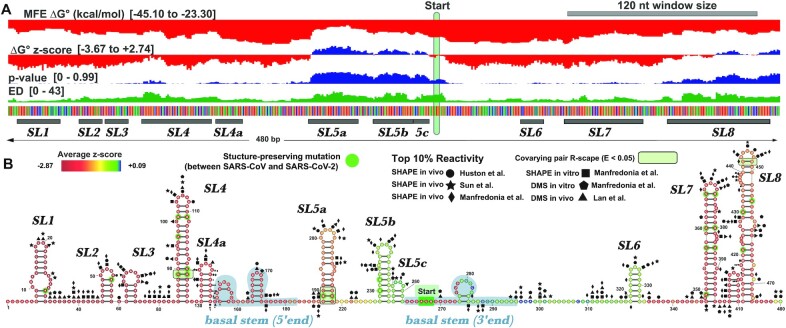
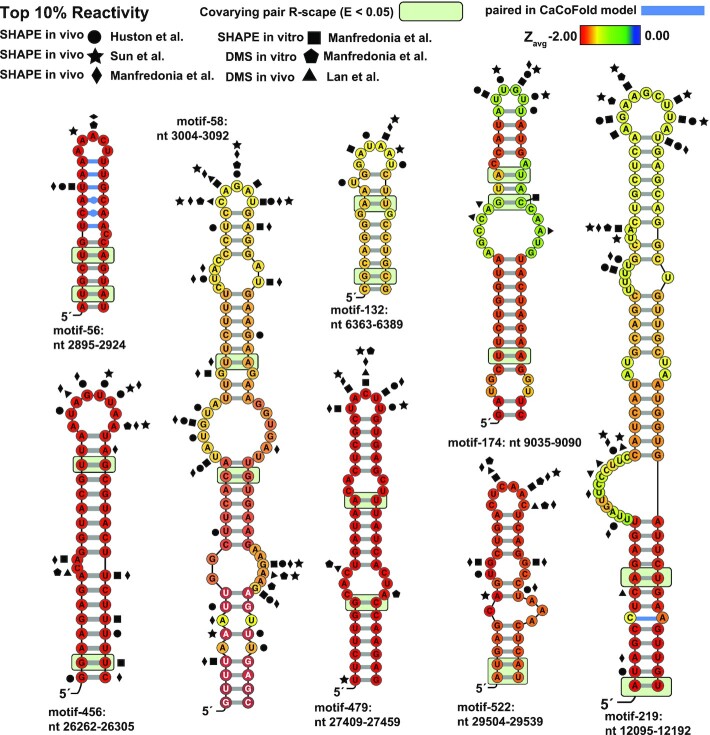
SARS-CoV-2 has exploded throughout the human population. To facilitate efforts to gain insights into SARS-CoV-2 biology and to target the virus therapeutically, it is essential to have a roadmap of likely functional regions embedded in its RNA genome. In this report, we used a bioinformatics approach, ScanFold, to deduce the local RNA structural landscape of the SARS-CoV-2 genome with the highest likelihood of being functional. We recapitulate previously-known elements of RNA structure and provide a model for the folding of an essential frameshift signal. Our results find that SARS-CoV-2 is greatly enriched in unusually stable and likely evolutionarily ordered RNA structure, which provides a large reservoir of potential drug targets for RNA-binding small molecules. Results are enhanced via the re-analyses of publicly-available genome-wide biochemical structure probing datasets that are broadly in agreement with our models. Additionally, ScanFold was updated to incorporate experimental data as constraints in the analysis to facilitate comparisons between ScanFold and other RNA modelling approaches. Ultimately, ScanFold was able to identify eight highly structured/conserved motifs in SARS-CoV-2 that agree with experimental data, without explicitly using these data. All results are made available via a public database (the RNAStructuromeDB: https://structurome.bb.iastate.edu/sars-cov-2) and model comparisons are readily viewable at https://structurome.bb.iastate.edu/sars-cov-2-global-model-comparisons.


Figures

Figure 1.
Figure 1.
In silico ScanFold-Fold predicted secondary structure for the SARS-CoV-2 frameshift stimulatory element (FSE) spanning nts 13422–13547. Average z-scores are overlaid on each nt via a heat map ranging from –2.34 (red) to 0.00 (blue). Top 10% of reactivities are shown for Manfredoina et al. (squares, pentagons and diamonds), Huston et al. (circles), Sun et al. (stars) and Lan et al. (triangles) at their corresponding nt positions (17–20). The attenuator hairpin and UU internal loop, recently targeted with small molecule inhibitors of –1 PRF (16), are depicted in blue shaded boxes and the slippery sequence in a gold shaded box. The interactions of the pseudoknot proposed by other groups (17–20) are shown with solid and dashed gray lines and the specific base pairing pattering are also shown in an inset. The smaller pseudoknot structure as determined by cyro-EM (14,73) is highlighted in lavender (dashed line and inset). The two orange colored pairs at the top of Stem 1 were not detected by Bhatt et al. (73) in their cryo-EM and the two red pairs at the base of stem 3 were not detected by either Bhatt et al. or Zhang et al. (14,73). All significantly covarying bps (R-scape APC corrected G-test; E < 0.05) have been highlighted with a green box.
Figure 2.
Figure 2.
Global results for SARS-CoV-2 and comparisons to other viral genomes. (A) At the top is a cartoon depiction of the SARS-CoV-2 genome with the major regions annotated. Below this is a heatmap of average per nt z-scores (Zavg) with colors ranging from red (–5.00) to white (>=0.00) with yellow set to midrange (–2.00). Next, the MFE ΔG° for each ScanFold analysis window is shown across the genome (black line demarcated every 2500 nts) with values ranging from –47.50 to –8.80 (kcal/mol); here, a moving average of MFE values calculated across 120 nts is shown. Further down is a depiction of the ΔG° z-score for each ScanFold analysis window across the genome and values range from –6.40 to +2.74 with an average of –1.49; here, a moving average of ΔG° z-scores calculated across 120 nts is shown. Finally, there is a positional track from 1 to 29 903 nts with markers spaced 2500 nts apart. Just past the 12500 mark, there is a region shaded with a light gray box that represents the location of the frameshift stimulatory element (FSE). (B) On the left, violin plots depicting the distribution of ΔG° z-scores for ScanFold analysis windows are shown for SARS-CoV-2, ZIKV, and HIV-1. On the right, violin plots depicting the average genome ΔG° z-scores for all NCBI Coronaviridae reference genomes, along with the NCBI reference sequences for all human ribovirus genomes for comparison (genomes accessed from NCBI on 20 March 2020). The number of genomes included in the analysis is shown above each plot. The red line represents the average genome z-score, –1.49, of SARS-CoV-2.
Figure 3.
Figure 3.
Comparisons of ScanFold vs. experimental data. Receiver-operating characteristic (ROC) analysis of the in silico (at a 120 nt analysis window) ScanFold-Fold predicted base pair structure of SARS-CoV-2 against SHAPE and DMS reactivity data sets generated from SARS-CoV-2 probing experiments. Reactivities are progressively evaluated from the lowest reactivity values to the highest, at intervals of 1% of the total number of reactivity values (see Materials and Methods) and compared to the ScanFold predicted secondary structure yielding a true positive rate (y axis) and a false positive rate (x axis). Progressively increasing reactivity thresholds have their respective TPR and FPR plotted from 0% (coordinate (0,0)) to 100% (coordinate (1,1)) and each respective dataset is indicated by a line with a unique marker (see figure legend). The area under the curve (AUC) is calculated for each curve (listed in the figure legend and Supplementary Table S6) and is an indication of how well the reactivity datasets agree with the in silicoScanFold-Fold predicted structure.
Figure 4.
Figure 4.
Comparisons of in silicoScanFoldZavg values against three different reactivity-informed secondary structural models of SARS-CoV-2. (A) In silicoScanFold Zavg values were binned based on their magnitude from < -2 to > +2 at intervals of 1 and are labelled across the x axis along with the number of values that are present in each bin. The positions corresponding to each Zavg value were cross referenced between the in silicoScanFold predicted secondary structure of SARS-CoV-2 and the three model conditions proposed by Manfredonia et al. (DMS in vitro, black shading; SHAPE in vitro, dark gray shading; SHAPE in vivo, light gray shading) to calculate a percent similarity which is plotted on the y axis. Across all three model conditions, the lowest Zavg bins consistently have the highest similarity to the reactivity informed global models. (B) The < -1 and < -2 binned Zavg values for in silicoScanFold models of SARS-CoV-2, at both a 120 and 600 nt analysis window, were compared to the three separate models from Manfredonia et al. and a false positive rate (FPR) was calculated. The Zavg bins are labelled across the x axis along with the number of nt positions associated with each bin and the FPR is plotted along the y axis. For the 120nt scanning analysis window, the most negative Zavg bin (i.e. < -2) had the lowest FPR compared to the < -1 Zavg bin and the All Zavg bin (which had the highest FPR). The distribution of Zavg values for the ScanFold model utilizing a 600 nt analysis window were significantly shifted to be more negative, resulting in almost all (>99%) of the Zavg values to be in the < -2 bin, therefore there is little variation in the FPR for these Zavg bins and the FPR in all bins are higher compared to the < -2 bin utilizing the 120 nt analysis window.
Figure 5.
Figure 5.
Full analysis of the 5′ UTR of SARS-CoV-2. (A) The results of the full ScanFold pipeline are shown. ScanFold metrics and base pairs have been loaded into the IGV desktop browser (91). Metric type and ranges are shown on the left side of the panel (metric descriptions can be found in Material and Methods). Here the start codon has been highlighted with a green bar and structures which correspond to previously named elements have been annotated. (B) ScanFold RNA 2D structures are shown for the 5′ UTR. All base pairs shown are consistent between SARS-CoV and SARS-CoV-2, and nucleotide variations which are present within structures have been highlighted with green circles. Structures have been visualized here using VARNA (92). Top 10% of reactivities are shown for Manfredoina et al. (squares, pentagons and diamonds), Huston et al. (circles), Sun et al. (stars) and Lan et al. (triangles) at their corresponding nt positions (17–20).
Figure 6.
Figure 6.
ScanFold predicted motifs annotated with conservation and probing data. Nucleotides are colored based on the Zavg value predicted in the standard ScanFold run. Particularly interesting base pairs which were identified in CaCoFold models are shown in blue. Significantly covarying bps (R-scape APC corrected G-test; E<0.05) have been highlighted with a green box. Nucleotide coordinates are relative to the SARS-CoV-2 reference genome NC_045512.2. Top 10% of reactivities are shown for Manfredoina et al. (squares, pentagons and diamonds), Huston et al., (circles), Sun et al. (stars) and Lan et al. (triangles) at their corresponding nt positions (17–20).

Update of

References

    1. Yang D., Leibowitz J.L.. The structure and functions of coronavirus genomic 3′ and 5′ ends. Virus Res. 2015; 206:120–133. - PMC - PubMed
    1. Madhugiri R., Fricke M., Marz M., Ziebuhr J.. Ziebuhr J. Advances in Virus Research. 2016; 96:Academic Press; 127–163. - PMC - PubMed
    1. Kalvari I., Argasinska J., Quinones-Olvera N., Nawrocki E.P., Rivas E., Eddy S.R., Bateman A., Finn R.D., Petrov A.I.. Rfam 13.0: shifting to a genome-centric resource for non-coding RNA families. Nucleic Acids Res. 2018; 46:D335–D342. - PMC - PubMed
    1. Nawrocki E.P., Burge S.W., Bateman A., Daub J., Eberhardt R.Y., Eddy S.R., Floden E.W., Gardner P.P., Jones T.A., Tate J.et al. .. Rfam 12.0: updates to the RNA families database. Nucleic Acids Res. 2015; 43:D130–D137. - PMC - PubMed
    1. Burge S.W., Daub J., Eberhardt R., Tate J., Barquist L., Nawrocki E.P., Eddy S.R., Gardner P.P., Bateman A.. Rfam 11.0: 10 years of RNA families. Nucleic Acids Res. 2013; 41:D226–D232. - PMC - PubMed