. 2021 May 22;3(2):lqab044.
doi: 10.1093/nargab/lqab044. eCollection 2021 Jun.

Assessing the functional relevance of splice isoforms

Affiliations

Assessing the functional relevance of splice isoforms

Fernando Pozo et al. NAR Genom Bioinform. .

Abstract

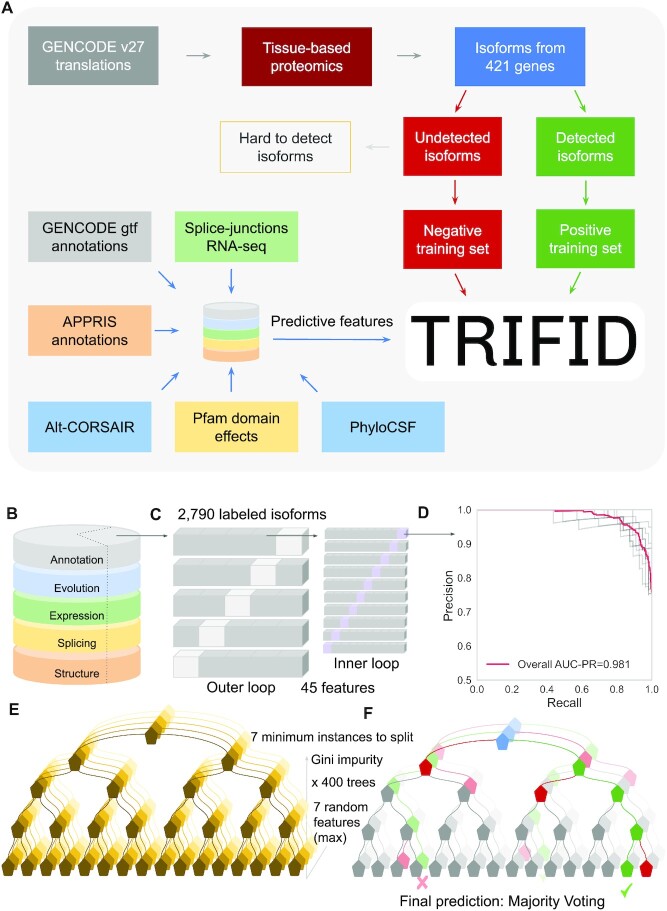
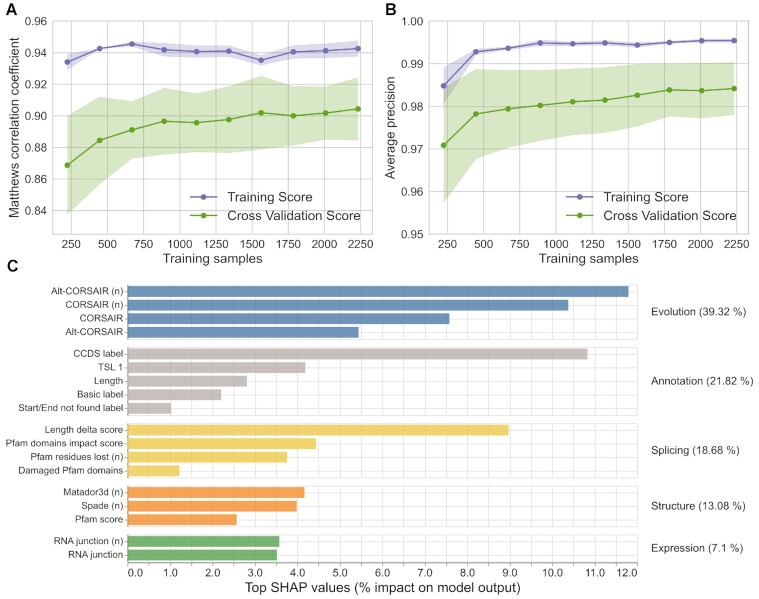
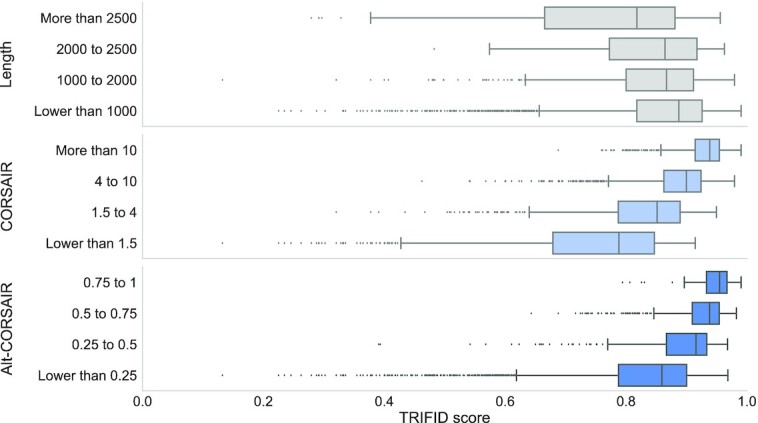
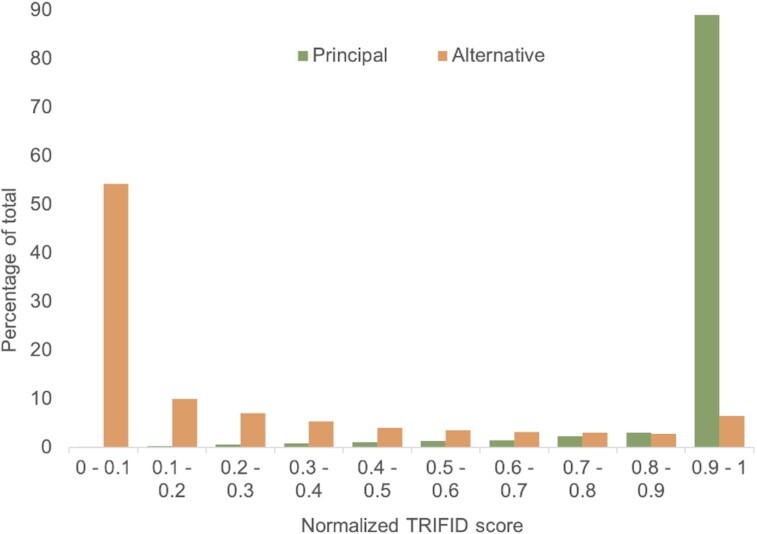
Alternative splicing of messenger RNA can generate an array of mature transcripts, but it is not clear how many go on to produce functionally relevant protein isoforms. There is only limited evidence for alternative proteins in proteomics analyses and data from population genetic variation studies indicate that most alternative exons are evolving neutrally. Determining which transcripts produce biologically important isoforms is key to understanding isoform function and to interpreting the real impact of somatic mutations and germline variations. Here we have developed a method, TRIFID, to classify the functional importance of splice isoforms. TRIFID was trained on isoforms detected in large-scale proteomics analyses and distinguishes these biologically important splice isoforms with high confidence. Isoforms predicted as functionally important by the algorithm had measurable cross species conservation and significantly fewer broken functional domains. Additionally, exons that code for these functionally important protein isoforms are under purifying selection, while exons from low scoring transcripts largely appear to be evolving neutrally. TRIFID has been developed for the human genome, but it could in principle be applied to other well-annotated species. We believe that this method will generate valuable insights into the cellular importance of alternative splicing.


Figures

Figure 1.
Figure 1.
Schema and model selection, training and feature importance in the final RF model. (A) A simplified schema of the design of the TRIFID algorithm. (B) Isoforms in the training set were annotated with features. (C) Nested cross validation (CV) strategy using an external test set to evaluate the performance of the model (to overcome the risk of test set bias). (D) Precision-recall curves from stratified 10-fold cross validation for the best model selected in the inner loop (75% of the training set, 2062 isoforms) once the hyperparameter tuning step has been performed. (E) Graphical representation of the RF training process. The RF had 400 de-correlated decision trees, and the best split of each tree was based on the Gini impurity function. At each leaf node, the minimum number of samples was set to 7, which also helps to avoid overfitting. (F) The predicted functionality score of an input isoform is the average predicted class probabilities of the trees in the forest.
Figure 2.
Figure 2.
TRIFID learning curve and feature importance. The Matthews correlation coefficient (A) and the average precision (B) for the training score and cross-validation score using subsets of the data set to train the model. Results clearly show that the model is stable even with smaller subsets. (C) The SHAP feature importance calculation (60) is a game theoretic approach that explains models globally by combining local contributions of individual features and is supposed to perform better than any other global approximation. The top 18 features are divided into five sub-types (evolutionary, annotation, structure/functional, expression and splicing effects) as described in the methods section. A lower case ‘n’ indicates that the feature was normalized.
Figure 3.
Figure 3.
Length and conservation scores versus TRIFID scores. Boxplots of the highest TRIFID score per gene against the length of the longest isoform in each gene and against the highest scoring CORSAIR and Alt-CORSAIR values in each gene. Results are only shown for singleton genes with a last common ancestor before the split with Bilateria. Bilateria gene family age was calculated from Ensembl Compara in a previous study (32,46). Box plots show the interquartile range, median, 95% confidence interval and outliers as black dots. We binned genes by the length of their longest isoform and by the highest CORSAIR and Alt-CORSAIR scores, and calculated average TRIFID scores for each of these bins. Since these genes are conserved back to Bilateria, we would expect them all to have the highest possible CORSAIR and Alt-CORSAIR scores. However, many CORSAIR and Alt-CORSAIR scores are lower than expected. The longer the protein and the lower the conservation scores, the lower the TRIFID scores. Genes with lower conservation scores had substantially lower TRIFID values.
Figure 4.
Figure 4.
Normalized TRIFID scores and for alternative and principal isoforms. Non-redundant isoforms were divided into principal or alternative according to their annotation in APPRIS. Normalized TRIFID scores for the alternative and principal isoforms were binned in increments of 0.1 and the percentage of all isoforms in each bin plotted. Most alternative isoforms have TRIFID scores <0.1. Almost all principal isoforms have predictor scores above 0.9.
Figure 5.
Figure 5.
A schematic illustration of the two functionally important ERCC6 isoforms. Both isoforms have a common N-terminal, represented by the resolved coiled coil structure of residues 84 to 160 from PDB (73) structure 4CVO, left. The principal isoform (above right, red arrows) is represented by structures of the SNF2 family N-terminal domain (PDB: 5HZR) and C-terminal helicase domain (PDB: 6A6I). Pathogenic mutations from ClinVar (74) that map to the N-terminal domain are shown in red (stop gained) and yellow (missense). The alternative isoform (below right, blue arrows) is represented by the structure of the transposase IS4 domain (PDB: 6×67). The pathogenic mutation that affects ovary function (72) is mapped to this domain and shown in red. Mapping to the PDB structures where necessary was carried out using HHPRED (75) and all images were generated using PyMol.
Figure 6.
Figure 6.
Model predictions for four fibroblast growth factor receptor 1 (FGFR1) isoforms. (A) A representation of the architecture of fibroblast growth factor receptors with domains shown in red. The protein forms dimers through its kinase domain. The extracellular region is shaded. (B) A comparison of principal transcript (ENST00000447712) and alternative transcript ENST00000356207. The top half of the panel shows the extracellular region coding exon composition. ENST00000356207 loses an exon with respect to ENST00000447712 (shown with a gold box), the effect of which would be to remove the first immunoglobulin domain, coloured in gold on the model of the extracellular portion of fibroblast growth factor receptor 1. (C) A comparison of principal transcript and alternative transcript ENST00000397103. The top of the panel shows the coding exon composition. ENST00000397103 loses the same exon as ENST00000356207, but would also swap exon 8 (blue box) for exon 9 (coloured in blue) and lose six bases as a result of NAGNAG splicing (shown by an arrow). The effect on the isoform would be to remove domain 1 (gold), two residues in the region between domains 1 and 2 (shown by arrow), and to generate a distinct but homologous version of domain 3 (residues that would differ in the domain are shown in blue). (D) A comparison of the principal transcript and alternative transcript ENST00000619564. The top of the panel shows the coding exon composition. ENST00000619564 loses exon 8 and all downstream exons and replaces them with a shorter non-homologous exon (shown in green). The effect on fibroblast growth factor receptor 1 would be to damage domain 3 (residues lost from domain 3 in green) and eliminate the entire downstream sequence of the protein, including the trans-membrane helix and the tyrosine kinase domain.
Figure 7.
Figure 7.
A comparison between TRIFID and PULSE. (A) A scatter plot of PULSE and TRIFID scores over alternative isoforms that coincide between the two analyses. The comparison was carried out over 2692 sequences present in both data sets. The distribution of scores for the predictors is shown above or to the right of the graphic. Spearman's rank correlation between the two sets was 0.504. (B) The 346-residue splice variant of IL1RAP mapped onto PDB structure 5VI4. This isoform is generated from an exon skip that changes the frame of the protein. The exon skip occurs in the middle of the third immunoglobulin domain (in purple) and as a result of the frame shift, the variant loses half of the domain (lost region shown in light grey) and the downstream trans-membrane helix and downstream TIR domain. The interaction with interleukin-33 (yellow) and interleukin 1 receptor like 1 (teal) will also be affected. The isoform is annotated only in the human genome. PULSE predicts that this isoform is functional (0.831), while TRIFID does not (0.002). (C) The 475-residue splice variant of ATE1 mapped onto PDB structure 2ATR using HHPRED. This isoform is generated from an exon skip that removes 41 residues including the first part of the Arginine-tRNA-protein transferase domain (lost region shown in light grey). This splice event skips a pair of mutually exclusively spliced exons that appear to be important in substrate selection (85) and that are conserved even in Orb weaver spiders. It seems unlikely that such important exons can be skipped without consequence for the function of the protein. PULSE predicts that this isoform is functional (0.707) and TRIFID does not (0.037). (D) Two splice variants of MACROH2A1 mapped onto PDB structure 6fy5 using HHPRED. The first isoform is generated from an exon skip that changes the frame at the start of the macro domain. The section of the structure that would be maintained is shown in teal, the remainder (in yellow and light grey) would be replaced by 27 residues as a result of the frame shift. PULSE predicts that this isoform is functional (0.676), while TRIFID does not (0.184). A second exon skip produces another frame shift that affects the same domain. Here the conserved region is shown in purple and yellow, and the region of the domain replaced by frame-shifted residues in light grey. Neither method predicts that this isoform is functional, but the PULSE score for this improbable protein is much higher, 0.484 against 0.008. All images were generated using PyMol.
Figure 8.
Figure 8.
TRIFID scores and genomic variation for principal and alternative exons. (A) Non-synonymous to synonymous ratios for rare (yellow) and common allele frequencies (purple) for exons from principal transcripts binned by the TRIFID score of the transcript. (B) Non-synonymous to synonymous ratios for rare (yellow) and common allele frequencies (purple) for exons that do not overlap principal transcripts binned by the TRIFID score of their transcript. Error bars show the confidence intervals for each subset of exons.

Similar articles

Cited by

  • Identification of senescent cell subpopulations by CITE-seq analysis.
    Abdelmohsen K, Mazan-Mamczarz K, Munk R, Tsitsipatis D, Meng Q, Rossi M, Pal A, Shin CH, Martindale JL, Piao Y, Fan J, Yanai H, De S, Beerman I, Gorospe M. Abdelmohsen K, et al. Aging Cell. 2024 Nov;23(11):e14297. doi: 10.1111/acel.14297. Epub 2024 Aug 14. Aging Cell. 2024. PMID: 39143693 Free PMC article.
  • Transcriptomic Profiling Provides Insight into the Molecular Basis of Heterosis in Philippine-Reared Bombyx mori Hybrids.
    Conde MYED, Planta J, Bautista MAM. Conde MYED, et al. Insects. 2025 Feb 26;16(3):243. doi: 10.3390/insects16030243. Insects. 2025. PMID: 40266772 Free PMC article.
  • Ensembl 2024.
    Harrison PW, Amode MR, Austine-Orimoloye O, Azov AG, Barba M, Barnes I, Becker A, Bennett R, Berry A, Bhai J, Bhurji SK, Boddu S, Branco Lins PR, Brooks L, Ramaraju SB, Campbell LI, Martinez MC, Charkhchi M, Chougule K, Cockburn A, Davidson C, De Silva NH, Dodiya K, Donaldson S, El Houdaigui B, Naboulsi TE, Fatima R, Giron CG, Genez T, Grigoriadis D, Ghattaoraya GS, Martinez JG, Gurbich TA, Hardy M, Hollis Z, Hourlier T, Hunt T, Kay M, Kaykala V, Le T, Lemos D, Lodha D, Marques-Coelho D, Maslen G, Merino GA, Mirabueno LP, Mushtaq A, Hossain SN, Ogeh DN, Sakthivel MP, Parker A, Perry M, Piližota I, Poppleton D, Prosovetskaia I, Raj S, Pérez-Silva JG, Salam AIA, Saraf S, Saraiva-Agostinho N, Sheppard D, Sinha S, Sipos B, Sitnik V, Stark W, Steed E, Suner MM, Surapaneni L, Sutinen K, Tricomi FF, Urbina-Gómez D, Veidenberg A, Walsh TA, Ware D, Wass E, Willhoft NL, Allen J, Alvarez-Jarreta J, Chakiachvili M, Flint B, Giorgetti S, Haggerty L, Ilsley GR, Keatley J, Loveland JE, Moore B, Mudge JM, Naamati G, Tate J, Trevanion SJ, Winterbottom A, Frankish A, Hunt SE, Cunningham F, Dyer S, Finn RD, Martin FJ, Yates AD. Harrison PW, et al. Nucleic Acids Res. 2024 Jan 5;52(D1):D891-D899. doi: 10.1093/nar/gkad1049. Nucleic Acids Res. 2024. PMID: 37953337 Free PMC article.
  • Toward a comprehensive profiling of alternative splicing proteoform structures, interactions and functions.
    Laine E, Freiberger MI. Laine E, et al. Curr Opin Struct Biol. 2025 Feb;90:102979. doi: 10.1016/j.sbi.2024.102979. Epub 2025 Jan 7. Curr Opin Struct Biol. 2025. PMID: 39778413 Free PMC article. Review.
  • Profiling genetically driven alternative splicing across the Indonesian archipelago.
    Ibeh N, Kusuma P, Crenna Darusallam C, Malik SG, Sudoyo H, McCarthy DJ, Gallego Romero I. Ibeh N, et al. Am J Hum Genet. 2024 Nov 7;111(11):2458-2477. doi: 10.1016/j.ajhg.2024.09.004. Epub 2024 Oct 8. Am J Hum Genet. 2024. PMID: 39383868 Free PMC article.

References

    1. Wang E.T., Sandberg R., Luo S., Khrebtukova I., Zhang L., Mayr C., Kingsmore S.F., Schroth G.P., Burge C.B.. Alternative isoform regulation in human tissue transcriptomes. Nature. 2008; 456:470–476. - PMC - PubMed
    1. Black D.L. Protein diversity from alternative splicing: a challenge for bioinformatics and post-genome biology. Cell. 2000; 103:367–370. - PubMed
    1. Graveley B.R. Alternative splicing: increasing diversity in the proteomic world. Trends Genet. 2001; 17:100–107. - PubMed
    1. The UniProt Consortium UniProt: the universal protein knowledgebase. Nucleic Acids Res. 2017; 45:D158–D159. - PMC - PubMed
    1. Frankish A., Diekhans M., Ferreira A.M., Johnson R., Jungreis I., Loveland J., Mudge J.M., Sisu C., Wright .J, Armstrong J.et al. .. GENCODE reference annotation for the human and mouse genomes. Nucleic Acids Res. 2019; 47:D766–D773. - PMC - PubMed