. 2019 Dec:1:177-196.
doi: 10.1146/annurev-devpsych-121318-085204. Epub 2019 Dec 6.

Cognitive Aging and Dementia: A Life Span Perspective

Affiliations

Cognitive Aging and Dementia: A Life Span Perspective

Elliot M Tucker-Drob. Annu Rev Dev Psychol. 2019 Dec.

Abstract

This article summarizes empirical findings and theoretical concepts in cognitive aging and late-life dementia research. Major emphases are placed on (1) person-to-person heterogeneity in trajectories of cognitive change over time, (2) how trajectories of child cognitive development determine peak levels of adult cognitive function from which aging-related cognitive declines occur, and (3) how lifelong trajectories of cognitive function relate to the timing of severe cognitive impairments characteristic of dementia. I consider conceptual issues surrounding categorical vs. dimensional models of late-life dementia, and how current diagnostic approaches affect inferences in the empirical study of disease progression. The incomplete current understanding of the biological foundations of aging-related cognitive declines and the continuous nature of many biomarkers commonly used in dementia diagnosis and classification together pose both opportunities and challenges in the current research landscape. Research moving forward will benefit from accurately measuring and analyzing continuous variation in longitudinal trajectories of cognitive function.

Keywords: Alzheimer’s Disease; Cognitive Aging; Cognitive Reserve; Dementia; Longitudinal; Neurocognitive.


Figures

Figure 1.
Figure 1.
Cross-sectional age trends in fluid reasoning, crystallized knowledge, and dementia prevalence. Data on fluid reasoning (N=5,712) and crystallized knowledge (N=5,315) from the Woodcock Johnson – III Tests of Cognitive Abilities (Woodcock, McGrew, & Mather, 2001). Fluid and crystallized abilities have each been scaled such that the mean and standard deviation of performance between ages 18 and 21 are 100 and 15, respectively. Dementia prevalence rate statistics from Medical Research Council Cognitive Function and Ageing Study – II (N=7,720; Matthews et al., 2013).
Figure 2.
Figure 2.
A stylized representation of life span curves for cognitive function for individuals (thin blue lines) and the population-average (thicker black line). Individual curves vary in the age at which they cease in order to represent person-to-person variation in age at mortality. The dotted red horizontal line represents a functional threshold, below which cognitive function is too low to function independently in everyday life. All individuals begin life below this functional threshold, and typically developing individuals surpass it over the course of childhood. As individual cognitive function declines over the course of adulthood, some individuals drop back below the functional threshold. These individuals are typically diagnosed with cognitive impairment or dementia. In this plot, cognitive function has been scaled such that the mean and standard deviation of performance in early adulthood are 100 and 15, respectively. In these hypothetical exampels, the functional threshold of 70 is approximate, and is likely to vary across assessment protocols. Simulated data.
Figure 3.
Figure 3.
Two stylized scenarios representing how a dementia risk factor may operate with respect to cognitive aging. The top scenario represents what Salthouse has termed differential preservation whereby low and high risk groups differentially preserve their cognitive function with advancing adult age. The bottom scenario represents what Salthouse has termed preserved differentiation, whereby the differences observed between low and high risk groups is preserved across adulthood. Both scenarios lead to differences in the rate of dementia diagnosis by level of the risk factor. In thes plots, cognitive function has been scaled such that the mean and standard deviation of performance in early adulthood are 100 and 15, respectively. In these hypothetical exampels, the functional threshold of 70 is approximate, and is likely to vary across assessment protocols. Simulated data.
Figure 4.
Figure 4.
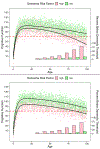
Plots of average cognitive function by age (left) and average scores on a dementia screening instrument (right) stratified by an early childhood risk factor for dementia (e.g. childhood socioeconomic status). Both plots are based on the same set of simulated data. Data were generated such that the risk factor was only related to rates of childhood cognitive development but not rates of aging-related cognitive change. Scores on the dementia screening instrument were derived directly from cognitive function scores using a transformation to reflect lower test sensitivity at higher levels of cognitive function. It can be seen that the dementia screening instrument gives the misimpression of differential preservation, i.e. that the risk factor is related to rate of aging-related cogntiive decline. Simulated data.
Figure 5.
Figure 5.
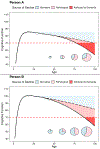
A categorical model of pathological aging projected onto simulated data for two hypothetical individuals. The solid black lines portray the observed trajectories in cognitive function for persons A and B, whereas the dotted black lines portray the expected trajectories in cognitive function for these individuals under a counterfactual of no pathology. The dotted red lines represent the threshold of cognitive functioning beyond which dementia is typically diagnosed. The light blue shaded regions indicate the total amount of change from peak performance that is attributable to normative processes, the light pink shaded regions indicate the amount of additional change from peak that is attributable to pathological processes, and the red shaded regions indicates the amount of change in cognitive function beyond the dementia threshold. The inset sequences of pie charts indicate the relative amount of change during each period of adulthood attributable to normative vs pathological sources. Simulated data.
Figure 6.
Figure 6.
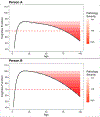
A continuous model of pathological aging projected onto simulated data for two hypothetical individuals. The solid black lines portray the observed trajectories in cognitive function for persons A and B. The shading represents the degree of pathology. The dotted red lines represent the threshold of cognitive functioning beyond which dementia is typically diagnosed. Simulated data.

References

    1. Allaire JC, & Marsiske M (2002). Well- and ill- defined measures of everyday cognition: Relationship to older adults’ intellectual ability and functional status. Psychology and Aging, 17, 101–115. - PMC - PubMed
    1. American Psychiatric Association. (2013). Diagnostic and statistical manual of mental disorders (5th ed.). Washington, DC: Author.
    1. Baltes PB (1987). Theoretical propositions of life-span developmental psychology: On the dynamics between growth and decline. Developmental Psychology, 23(5), 611.
    1. Baltes P, Reese HW, & Nesselroade JR (1977). Life-span developmental psychology: Introduction to research methods. Monterey, CA: Brooks.
    1. Baltes PB, & Schaie KW (1974). The myth of the twilight years: Intelligence does not slide downhill from adulthood through old age. Psychology Today, 8, 35–40.

LinkOut - more resources