. 2021 Aug;142(2):339-360.
doi: 10.1007/s00401-021-02327-x. Epub 2021 May 27.

Targeting fibroblast growth factor receptors to combat aggressive ependymoma

Affiliations

Targeting fibroblast growth factor receptors to combat aggressive ependymoma

Daniela Lötsch et al. Acta Neuropathol. 2021 Aug.

Abstract

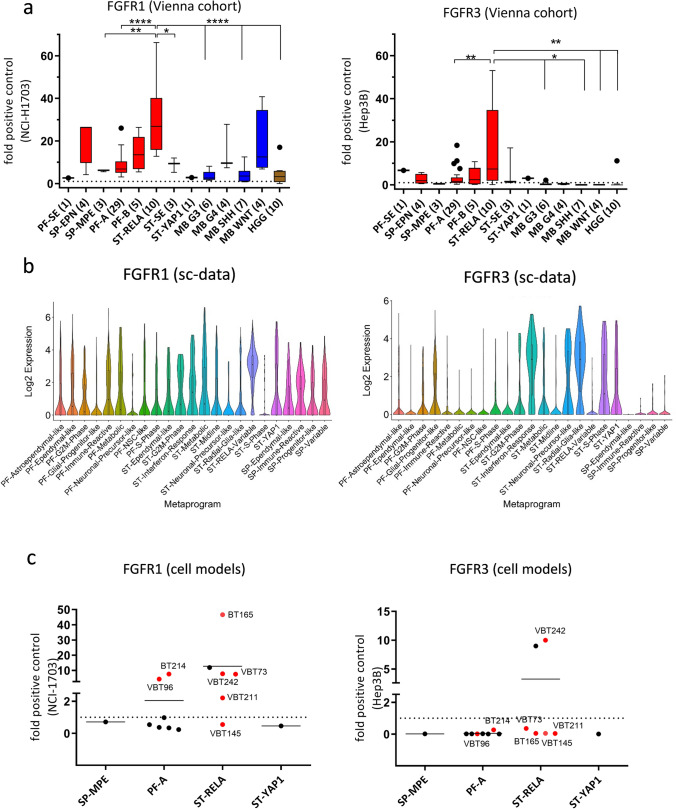
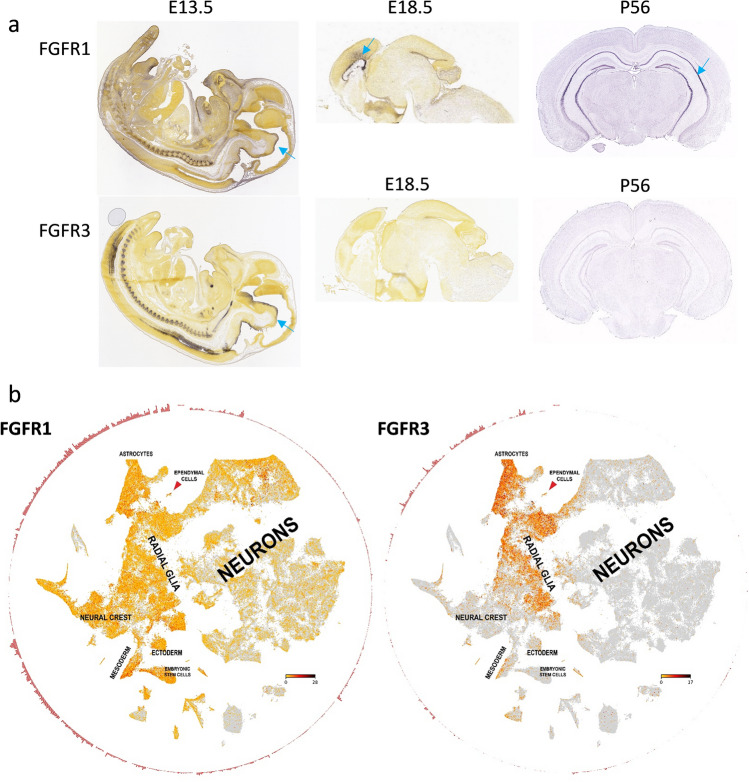
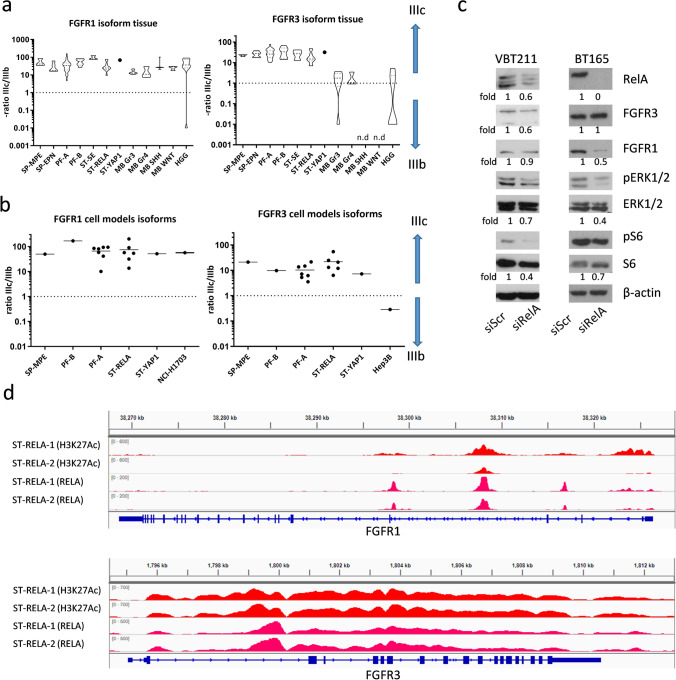
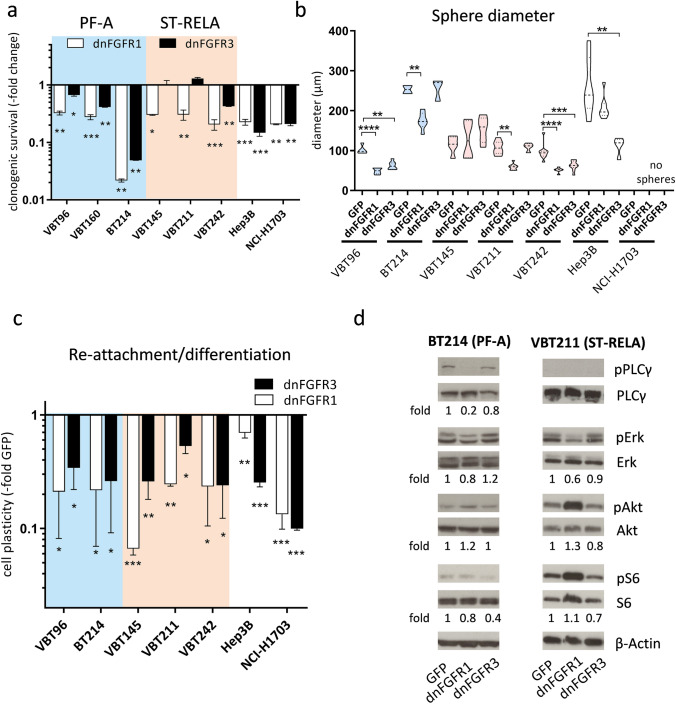
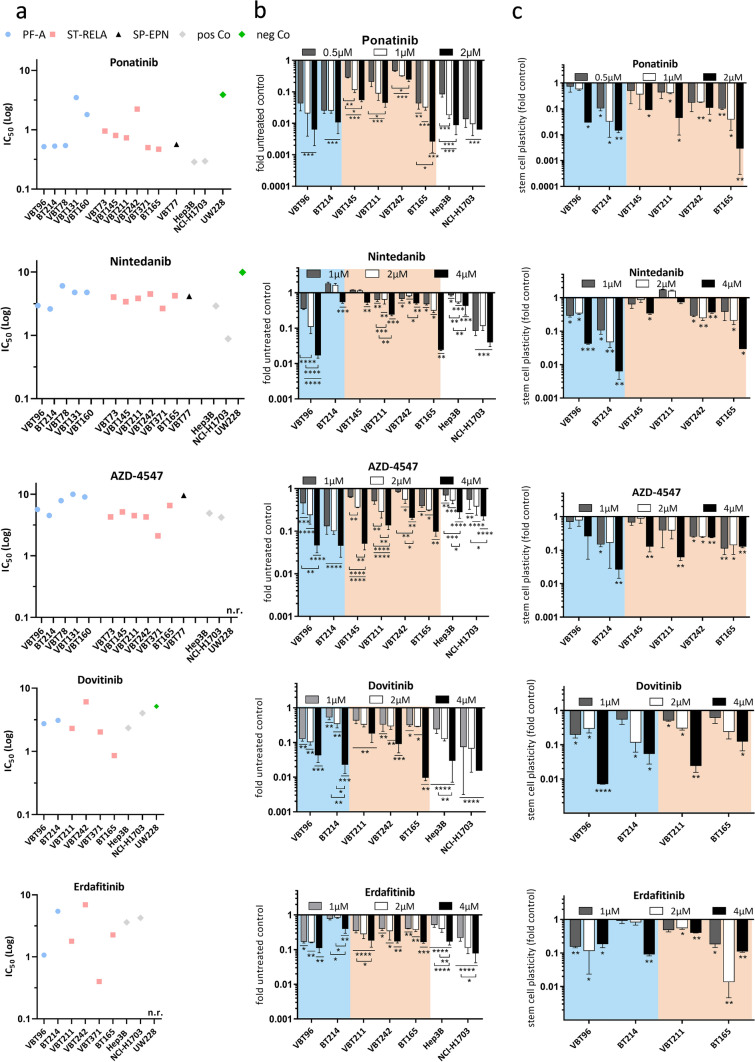
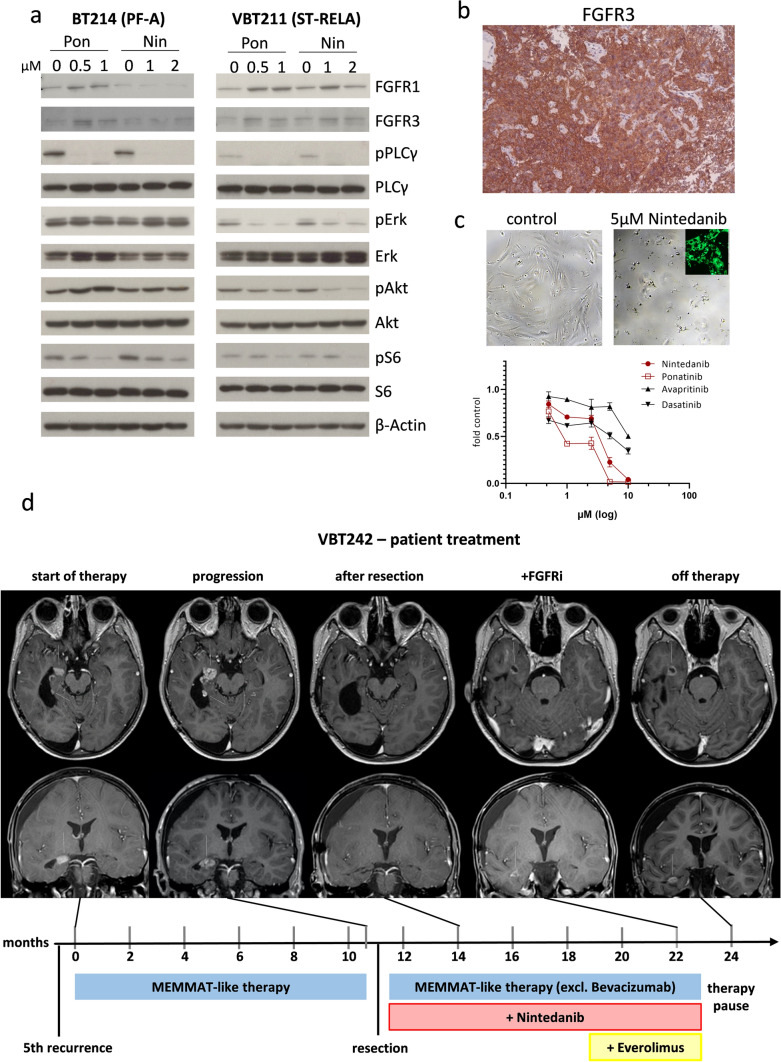
Ependymomas (EPN) are central nervous system tumors comprising both aggressive and more benign molecular subtypes. However, therapy of the high-risk subtypes posterior fossa group A (PF-A) and supratentorial RELA-fusion positive (ST-RELA) is limited to gross total resection and radiotherapy, as effective systemic treatment concepts are still lacking. We have recently described fibroblast growth factor receptors 1 and 3 (FGFR1/FGFR3) as oncogenic drivers of EPN. However, the underlying molecular mechanisms and their potential as therapeutic targets have not yet been investigated in detail. Making use of transcriptomic data across 467 EPN tissues, we found that FGFR1 and FGFR3 were both widely expressed across all molecular groups. FGFR3 mRNA levels were enriched in ST-RELA showing the highest expression among EPN as well as other brain tumors. We further identified high expression levels of fibroblast growth factor 1 and 2 (FGF1, FGF2) across all EPN subtypes while FGF9 was elevated in ST-EPN. Interrogation of our EPN single-cell RNA-sequencing data revealed that FGFR3 was further enriched in cycling and progenitor-like cell populations. Corroboratively, we found FGFR3 to be predominantly expressed in radial glia cells in both mouse embryonal and human brain datasets. Moreover, we detected alternative splicing of the FGFR1/3-IIIc variant, which is known to enhance ligand affinity and FGFR signaling. Dominant-negative interruption of FGFR1/3 activation in PF-A and ST-RELA cell models demonstrated inhibition of key oncogenic pathways leading to reduced cell growth and stem cell characteristics. To explore the feasibility of therapeutically targeting FGFR, we tested a panel of FGFR inhibitors in 12 patient-derived EPN cell models revealing sensitivity in the low-micromolar to nano-molar range. Finally, we gain the first clinical evidence for the activity of the FGFR inhibitor nintedanib in the treatment of a patient with recurrent ST-RELA. Together, these preclinical and clinical data suggest FGFR inhibition as a novel and feasible approach to combat aggressive EPN.

Keywords: Brain tumor; Ependymoma; FGFR; Pediatric cancer; Small molecule inhibitors.


Conflict of interest statement

The authors declare that they have no conflict of interest.

Figures

Fig. 1
Fig. 1
FGFR1 (left) and FGFR3 (right) mRNA expression in EPN tissues and cell models. a mRNA expression levels were analyzed in 86 surgical samples (Vienna cohort) comprising: posterior fossa (PF) subependymoma (PF-SE), spinal ependymoma WHO grade II (SP-EPN), myxopapillary ependymoma (SP-MPE), posterior fossa group A (PF-A) and B (PF-B), supratentorial (ST) RelA fusion-positive (ST-RELA), ST-subependymoma (ST-SE), and ST-Yap1 fusion-positive (ST-YAP1) ependymomas, medulloblastoma group 3 (MB G3), group 4 (MB G4), sonic hedgehog-activated (MB SHH) and wingless-activated (MB WNT) as well as high-grade glioma (HGG). Expression levels were normalized to the housekeeping gene β-actin (ΔCT), converted to a linear form using 2−ΔCT and are finally given as fold change (2−ΔΔCT) relative to the FGFR-positive controls (NCI-H1703 and Hep3B) shown as dashed line. Numbers in brackets indicate cases analyzed. Significance levels were calculated by one-way ANOVA. ****p < 0.0001, ***p < 0.001, **p < 0.01, *p < 0.05. b FGFR1 and FGFR3 expression in cellular subpopulations of EPN-derived from scRNA-seq data as published in [23]. FGFR1 is significantly enriched in the ST-RELA-variable program, FGFR3 in ST-interferon-response, ST-S-Phase, ST-neuronal-precursor-like, ST-radial-glia-like and in PF-glial-progenitor-like metaprograms. c mRNA expression levels in EPN cell models of the indicated subtypes and in the respective FGFR-positive controls (NCI-H1703 and Hep3B) were analyzed by qRT-PCR, normalized to the housekeeping gene β-actin (ΔCT) and are finally given as fold change (2−ΔΔCT) relative to the FGFR-positive controls (NCI-H1703 and Hep3B). Models used for further investigations are highlighted in red
Fig. 2
Fig. 2
FGFR expression of cell populations during brain development. a Expression of FGFR1 and FGFR3 mRNA in diverse stages of mouse brain development as indicated. In situ hybridization data was derived from the Allen Developing Mouse Brain Atlas (Copyright Allen Institute for Brain Science, http://developingmouse.brain-map.org). Blue arrows indicate the subventricular zone. b Single-cell mRNA expression of FGFR1 and FGFR3 in diverse cell populations within the developing mouse brain. Data was generously provided by Sten Linnarsson and adapted from www.mousebrain.org. Expression levels are indicated by color (yellow = low; red = intermediate; black = high)
Fig. 3
Fig. 3
FGFR1 and FGFR3 mRNA splice variants in EPN tissue samples and cell models. FGFR1-IIIb and -IIIc as well as FGFR3-IIIb and -IIIc mRNA levels in EPN (a) tissue samples and (b) cell models were determined by qRT-PCR, normalized to the housekeeping gene β-actin (ΔCT), converted to a linear form using 2−ΔCT and were finally expressed as ratios IIIc/IIIb. FGFR-positive controls (NCI-H1703 and Hep3B) are included. The cohort comprises myxopapillary ependymoma (SP-MPE), spinal ependymoma WHO grade II (SP-EPN), posterior fossa group A (PF-A) and B (PF-B), supratentorial subependymoma (ST-SE), RelA fusion-positive (ST-RELA), and Yap1 fusion-positive (ST-YAP1) ependymomas, medulloblastoma group 3 (MB G3), group 4 (MB G4), sonic hedgehog-activated (MB SHH), wingless-activated (MB WNT), and high-grade glioma (HGG). c Immunoblots depict protein expression and phosphorylation levels 72 h post transfection of the ST-RELA cell models VBT211 and BT165 with siRELA or non-targeting siRNA (siScr). Fold changes of the indicated proteins are given relative to respective siScr controls. d Red and pink peaks represent chromatin immunoprecipitation (ChIP) sequencing read coverage for the activating histone mark H3K27-acetyl (H3K27Ac) and RELA, respectively, at FGFR1 and FGFR3 gene loci. Sequencing reads of two ST-RELA tissue samples (ST-RELA-1 and ST-RELA-2) were mapped to hg19 human genome and visualized utilizing an integrative genome viewer
Fig. 4
Fig. 4
Transduction with dominant-negative (dn) FGFR1 or dnFGFR3 impairs clonogenicity, stem cell capacity and FGFR-downstream signaling cascades. a Bar graphs depict fold changes of clonogenic survival upon expression of dnFGFR1 or dnFGFR3 in comparison to GFP-vector controls (set as 1) in the indicated PF-A (blue; n = 3) and ST-RELA (pink; n = 3) cell models. Cells were seeded at low density, infected with the indicated adenoviral constructs and followed for 14 days. Hep3B and NCI-H1703 served as positive controls. b Sphere diameters (in µM) of PF-A (n = 2), ST-RELA (n = 3) and FGFR-positive control cells expressing either GFP-empty vectors, dnFGFR1 or dnFGFR3 are given. Experiments were performed in duplicates and statistical differences between GFP-controls and dnFGFR1 or dnFGFR3 were determined by one-way ANOVA with Tukey correction for multiple comparison. c six days after transduction of the indicated adenoviral constructs (compare b), spheres were seeded back in medium containing FCS and the capacity to attach and re-grow was followed. Results are presented as mean ± SD in comparison to respective GFP-vector controls, set as 1. Statistical power was calculated using one-way ANOVA with Tukey correction for multiple comparison. d Western blot analyses of the PF-A, BT214 and ST-RELA, VBT211, cell models upon expression of dnFGFR1 and dnFGFR3. Total protein expression and phosphorylation levels of the indicated PLC-γ (PLCγ, pPLCγ), MAPK (ERK, pERK) and PI3K (Akt, pAkt, S6, pS6) pathway mediators are depicted. ß-actin served as a loading control. Fold changes of the indicated proteins are given relative to respective GFP-transduced controls. ****p < 0.0001, ***p < 0.001, **p < 0.01, *p < 0.05
Fig. 5
Fig. 5
Targeting FGFR with tyrosine kinase inhibitors (FGFRis) impairs survival, clonogenicity and stem cell capacity of EPN cells. a Mean IC50 values, calculated from three independent experiments, of five different FGFRis (ponatinib, nintedanib, AZD-4547, dovitinib and erdafitinib) are depicted for the indicated cell models of different EPN subtypes in comparison to FGFR-positive (Hep3B, NCI-H1703) and negative (UW228 = MB SHH) controls. b Bar graphs depict fold changes of clonogenic survival upon treatment with the indicated FGFRi in comparison to untreated controls (set as 1) in PF-A (blue) and ST-RELA (pink) cell models. Cells were seeded at low density, exposed to the indicated drug concentrations and followed for 14 days. Hep3B and NCI-H1703 served as positive controls. c six days after treatment with the indicated inhibitors, spheres were seeded back into medium containing FCS and the capacity to attach and re-grow was followed. Results are presented as mean ± SD in comparison to untreated controls, set as 1. b, c Every value was evaluated from two independent experiments performed in duplicates and represented as mean ± SD. For b and c statistical differences between untreated and drug-exposed samples were determined by one-way ANOVA with Tukey correction for multiple comparison. n.r., not reached, ****p < 0.0001, ***p < 0.001, **p < 0.01, *p < 0.05
Fig. 6
Fig. 6
Targeting FGFR inhibits MAPK and PI3K pathway activation, induces differentiation and is applicable in the clinic. a Effects of long-term treatment (24 h) with ponatinib (Pon) and nintedanib (Nin) on FGFR1 and FGFR3, on PLCγ, MAPK and PI3K signaling activation (indicated by changes in the phosphorylation status) in PF-A (BT214) and ST-RELA (VBT211) cells was analyzed by Western blot. ß-actin served as a loading control. b Immunohistochemical staining of FGFR3 in tissue section of VBT242 at resection prior to FGFRi treatment is depicted. c Cell viability of VBT242 upon treatment with the FGFR inhibitor nintedanib and the FGFR/multikinase inhibitor ponatinib, compared to avapritinib and dasatinib targeting PDGFRA and Src, respectively, was determined and is expressed as dose–response curve. Representative pictures at 72 h nintedanib exposure (5 µM) are depicted above. Intracellular accumulation of the drug is verified by the green fluorescence photomicrograph. d Course of disease and treatment regimen in a patient suffering from ST-RELA EPN (corresponding to the VBT242 model). Time zero represents the time when the patient was admitted to our center for treatment of the 5th recurrence. The timeline indicates therapeutic interventions and clinical course. MEMMAT-like therapy was carried out as previously published [50] and NCT01356290. Tumor manifestations are indicated with white arrows on axial und coronal contrast-enhanced T1-weighted magnetic resonance images (MRI) at indicated time points. FGFRi FGFR-inhibitor

References

    1. Allerstorfer S, Sonvilla G, Fischer H, Spiegl-Kreinecker S, Gauglhofer C, Setinek U, et al. FGF5 as an oncogenic factor in human glioblastoma multiforme: autocrine and paracrine activities. Oncogene. 2008;27:4180–4190. doi: 10.1038/onc.2008.61. - DOI - PMC - PubMed
    1. Ameur LB, Marie P, Thenoz M, Giraud G, Combe E, Claude JB, et al. Intragenic recruitment of NF-κB drives splicing modifications upon activation by the oncogene Tax of HTLV-1. Nat Commun. 2020 doi: 10.1038/s41467-020-16853-x. - DOI - PMC - PubMed
    1. Anders S, Reyes A, Huber W. Detecting differential usage of exons from RNA-seq data. Genome Res. 2012;22:2008–2017. doi: 10.1101/gr.133744.111. - DOI - PMC - PubMed
    1. Arabzade A, Zhao Y, Varadharajan S, Chen H-C, Jessa S, Rivas B, et al. ZFTA-RELA dictates oncogenic transcriptional programs to drive aggressive supratentorial ependymoma. Cancer Discov. 2021 doi: 10.1158/2159-8290.CD-20-1066. - DOI - PMC - PubMed
    1. Babina IS, Turner NC. Advances and challenges in targeting FGFR signalling in cancer. Nat Rev Cancer. 2017;17:318–332. doi: 10.1038/nrc.2017.8. - DOI - PubMed

Publication types

MeSH terms

Substances

LinkOut - more resources