. 2021 Nov;24(4):823-842.
doi: 10.1007/s10456-021-09796-4. Epub 2021 May 27.

Pericyte hypoxia-inducible factor-1 (HIF-1) drives blood-brain barrier disruption and impacts acute ischemic stroke outcome

Affiliations

Pericyte hypoxia-inducible factor-1 (HIF-1) drives blood-brain barrier disruption and impacts acute ischemic stroke outcome

Chih-Chieh Tsao et al. Angiogenesis. 2021 Nov.

Abstract

Pericytes play essential roles in blood-brain barrier integrity and their dysfunction is implicated in neurological disorders such as stroke although the underlying mechanisms remain unknown. Hypoxia-inducible factor-1 (HIF-1), a master regulator of injury responses, has divergent roles in different cells especially during stress scenarios. On one hand HIF-1 is neuroprotective but on the other it induces vascular permeability. Since pericytes are critical for barrier stability, we asked if pericyte HIF-1 signaling impacts barrier integrity and injury severity in a mouse model of ischemic stroke. We show that pericyte HIF-1 loss of function (LoF) diminishes ischemic damage and barrier permeability at 3 days reperfusion. HIF-1 deficiency preserved barrier integrity by reducing pericyte death thereby maintaining vessel coverage and junctional protein organization, and suppressing vascular remodeling. Importantly, considerable improvements in sensorimotor function were observed in HIF-1 LoF mice indicating that better vascular functionality post stroke improves outcome. Thus, boosting vascular integrity by inhibiting pericytic HIF-1 activation and/or increasing pericyte survival may be a lucrative option to accelerate recovery after severe brain injury.

Keywords: Cerebral ischemia; Pericyte coverage; Pericyte death; Vascular permeability.


Conflict of interest statement

The authors declare that they have no conflict of interest.

Figures
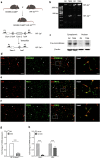
Fig. 1
Fig. 1
Generation and characterization of SMMHC-CreER T2; HIF-1α flox/flox mouse line. a Schematic representation of conditional HIF-1 gene disruption. Since HIF-1α exon 2 is floxed, tamoxifen treatment induces Cre-mediated recombination and exon 2 deletion. P1: primer 1; P2: primer 2; HIF-1αF: floxed HIF-1α allele; HIF-1αΔ: HIF-1α exon 2 deleted allele. b PCR-based confirmation of Cre-mediated recombination in brain cortices isolated from SMMHC-CreERT2; HIF-1αflox/flox mice after vehicle (Oil) or tamoxifen (TAM) injection with primers designated in schematic (a). Tamoxifen treatment generates a short 300 bp band (HIF-1αΔ) compared to the oil control 1.1Kb fragment (HIF-1αF) allele. c Cre-recombinase nuclear translocation is mediated by tamoxifen treatment as observed by immunoblotting of cytoplasmic and nuclear protein fractions. β-actin is the loading control. d–f Double-staining of brain sections with pericyte markers PDGFR-β, NG-2 or CD13 (green) and Cre-recombinase (red) confirms Cre-recombinase expression in brain pericytes. Arrowheads highlight vascular localization of PDGFR-β (d), NG-2 (e) and CD13 (f) positive cells. Scale bar = 100 μm. Inserts are 1.6x magnified images of boxed regions. g Quantitative RT-PCR of HIF-1α exon 2 expression in primary brain pericytes isolated from SMMHC-CreERT2; HIF-1αflox/flox mice exposed either to tamoxifen (2 µM) or vehicle (Oil) for 48 h. h Analysis of gene expression of HIF-1 targets in primary pericytes with or without tamoxifen treatment after 48 h hypoxia (Hx, 1 % O2). Glut-1: Glucose transporter 1, VEGF: Vascular endothelial growth factor. Unpaired student’s t test *P < 0.05; **P < 0.01; ***P < 0.001. Mean ± SD. n = 3–4
Fig. 2
Fig. 2
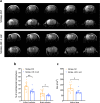
Loss of pericyte HIF-1 function reduces brain damage. a T2-weighted MRI scanning was used to determine brain infarction at 3 days post stroke. Representative consecutive coronal T2-weighted images of Stroke-Ctrl and Stroke-HIF-1 LoF animals, hyperintense (bright) areas indicate the lesion. b Histogram of infarct volume and brain edema in % of contralateral hemispheric volume c Total infarct size (not corrected for brain swelling) calculated via integration of under the curve analysis. Unpaired t test *P < 0.05; **P < 0.01; Mean ± SD. n = 11–13
Fig. 3
Fig. 3
Pericyte HIF-1 LoF attenuates ischemic severity of the peri-infarct area. a Schematic of coronal brain section showing regions-of-interest (ROIs) for quantitative analysis. b–c Representative images (b) and quantification (c) of TUNEL (apoptotic cells) and Fluoro-Jade C (degenerated neurons) staining in the peri-infarct area of stroke animals at 3 days after surgery. d, e Representative images (d) and quantification (e) of NeuN (neuronal nuclei) staining in peri-infarct area of stroke and sham animal groups. f, g Representative images (f) and quantification (g) of GFAP (astrocytes) staining of stroke and sham animal groups. Cell nuclei are counterstained with DAPI (blue). The border between the peri-infarct area (upper left) and ischemic area (lower right) is indicated by the white dotted line. Scale bars = 100 μm. Unpaired t-test vs. Stroke-Ctrl group; *P < 0.05; **P < 0.01; Two-way ANOVA for comparison of four groups. *P < 0.05; **P < 0.01 Mean ± SD. n = 4–6
Fig. 4
Fig. 4
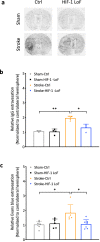
Decreased stroke-induced barrier permeability upon loss of HIF-1 function. a, b Representative images (a) and quantification (b) of IgG extravasation in stroke and sham groups. c Quantification of Evans blue dye extravasation into brain tissue. Relative change of barrier leakage was obtained by normalizing to values of the contralateral hemisphere. Two-way ANOVA *P < 0.05; **P < 0.01; Mean ± SD. n = 4–6
Fig. 5
Fig. 5
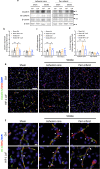
Pericyte HIF-1 LoF sustains tight junction organization in peri-infarct regions. a–d Representative immunoblots (a) and quantification of Claudin-5 (b), VE-cadherin (c) and β-catenin (d) protein levels in the ischemic core and peri-infarct areas of sham and stroke animals 3 days post surgery. β-actin is the loading control. Two-way ANOVA; *P < 0.05; **P < 0.01; Mean ± SD. n = 3–6. e-f Representative images of ischemic core and peri-infarct areas from brain sections of sham and stroke animals co-immunostained for CD31 and the junctional proteins Claudin-5 (e) and ZO-1 (f). Nuclei are counterstained with DAPI. Scale bar = 100 μm. Arrows indicate intact continuous TJ staining whereas arrowheads highlight disrupted regions at vessel walls
Fig. 6
Fig. 6
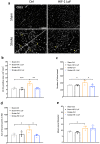
Pericytic HIF-1 deficiency abrogates post stroke vascular remodeling. a Representative images of CD31 staining in the peri-infarct of all animal groups at 3 days reperfusion. Scale bar = 100 μm. Arrowheads mark clearly dilated vessels. The border between peri-infarct areas and ischemic regions is indicated by the white dotted line. b–e Quantification of CD31 positive area (b), number of blood vessels (c), total branch points (d) and mean vessel diameter (e). Two-way ANOVA *P < 0.05; **P < 0.01; ***P < 0.001; Mean ± SD. n = 4–6
Fig. 7
Fig. 7
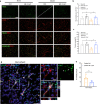
Loss of HIF-1 signaling prevents pericyte death and improves coverage. a Representative images of NG-2 or PDGFR-β (green; pericytes) and CD31 (red; endothelial cells) staining in peri-infarct areas at 3 days reperfusion. The border between the peri-infarct area and ischemic core is indicated by a white dotted line. b-c Histograms of NG-2 positive areas (b) and pericyte coverage (c) i.e. the area of overlap of NG-2-positive pericytes and CD31-positive endothelial cells. Scale bar = 100 μm. d Representative images showing pericyte death in the peri-infarct region of Stroke Ctrl mice. Sections are stained with TUNEL (green), NG-2 (red), CD31 (white) and counterstained with DAPI (blue). The images on the right are 1.6X magnifications of the boxed region with TUNEL/NG-2 double positive cells within a vessel highlighted with arrowheads. Merged orthogonal views of horizontal and vertical Z-stack images confirm localization of TUNEL to the nucleus of an NG-2 positive pericyte. Scale bars = 50 μm. f Quantification of % pericyte death in peri-infarct areas of Stroke mice groups. Unpaired t-test compared to Stroke-Ctrl *P < 0.05; Two-way ANOVA for comparison between four groups. *P < 0.05 Mean ± SD. n = 4–6
Fig. 8
Fig. 8
HIF-1 LoF mice show reduced neurological deficits post surgery. Graphs of Clark’s score general (a) and focal (b) deficits at 1 day and 3 days post tMCAo or sham surgery. Neurobehavioural assessment of sensorimotor coordination using latency to move test (c), ladder rung test (d) and corner test (e) 1 day prior to surgery and after 3 days reperfusion. The schematics show the testing platform for each behavioural assessment. Ms: mouse. Two-way ANOVA. *P < 0.05, *P < 0.01 Mean ± SD. n = 12–14 for sham-operated animals; n = 16–18 for stroke groups

References

    1. Profaci CP, Munji RN, Pulido RS, Daneman R. The blood–brain barrier in health and disease: important unanswered questions. J Exp Med. 2020;217:e20190062. doi: 10.1084/jem.20190062. - DOI - PMC - PubMed
    1. Engelhardt S, Patkar S, Ogunshola OO. Cell-specific blood-brain barrier regulation in health and disease: a focus on hypoxia. Br J Pharmacol. 2014;171:1210–1230. doi: 10.1111/bph.12489. - DOI - PMC - PubMed
    1. Del Zoppo GJ. The neurovascular unit in the setting of stroke. J Intern Med. 2010;2:156–171. doi: 10.1111/j.1365-2796.2009.02199.x. - DOI - PMC - PubMed
    1. Abbott NJ, Patabendige AAK, Dolman DEM, et al. Structure and function of the blood–brain barrier. Neurobiol Dis. 2010;37:13–25. doi: 10.1016/J.NBD.2009.07.030. - DOI - PubMed
    1. Saeid T, Charles G, HB N, et al. Blood–brain barrier permeability abnormalities in vascular cognitive impairment. Stroke. 2011;42:2158–2163. doi: 10.1161/STROKEAHA.110.611731. - DOI - PMC - PubMed

Publication types

Substances

LinkOut - more resources