

Differential regulation of glycinergic and GABAergic nanocolumns at mixed inhibitory synapses
- PMID: 34047007
- PMCID: PMC8256292
- DOI: 10.15252/embr.202052154
Differential regulation of glycinergic and GABAergic nanocolumns at mixed inhibitory synapses
Abstract
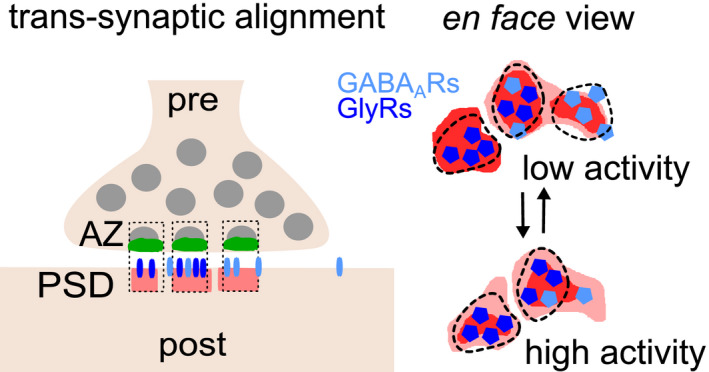
Super-resolution imaging has revealed that key synaptic proteins are dynamically organized within sub-synaptic domains (SSDs). To examine how different inhibitory receptors are regulated, we carried out dual-color direct stochastic optical reconstruction microscopy (dSTORM) of GlyRs and GABAA Rs at mixed inhibitory synapses in spinal cord neurons. We show that endogenous GlyRs and GABAA Rs as well as their common scaffold protein gephyrin form SSDs that align with pre-synaptic RIM1/2, thus creating trans-synaptic nanocolumns. Strikingly, GlyRs and GABAA Rs occupy different sub-synaptic spaces, exhibiting only a partial overlap at mixed inhibitory synapses. When network activity is increased by 4-aminopyridine treatment, the GABAA R copy numbers and the number of GABAA R SSDs are reduced, while GlyRs remain largely unchanged. This differential regulation is likely the result of changes in gephyrin phosphorylation that preferentially occurs outside of SSDs. The activity-dependent regulation of GABAA Rs versus GlyRs suggests that different signaling pathways control the receptors' sub-synaptic clustering. Taken together, our data reinforce the notion that the precise sub-synaptic organization of GlyRs, GABAA Rs, and gephyrin has functional consequences for the plasticity of mixed inhibitory synapses.
Keywords: GABAAR; GlyR; direct stochastic optical reconstruction microscopy; single-molecule localization microscopy; sub-synaptic domains.
© 2021 The Authors. Published under the terms of the CC BY NC ND 4.0 license.
Conflict of interest statement
The authors declare that they have no conflict of interest.
Figures
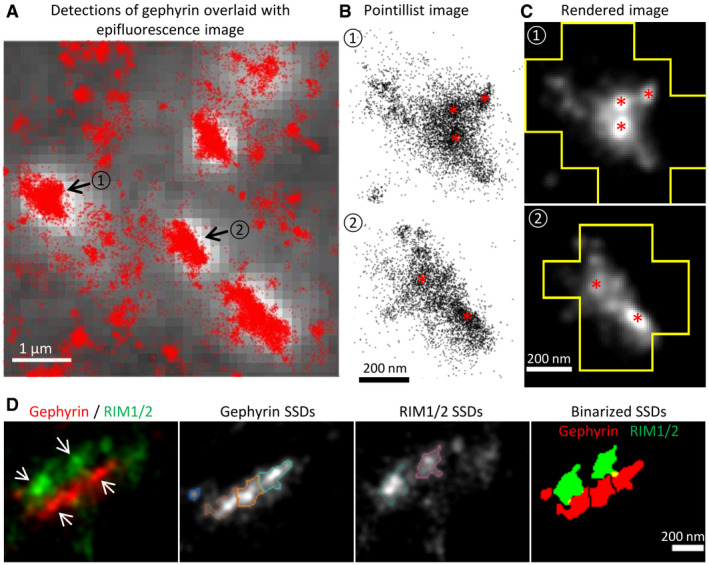
- A–C
dSTORM imaging of gephyrin in sucrose impregnated cryosections of adult mouse spinal cord. (A) dSTORM detections of gephyrin (red dots) overlaid with the epifluorescence image (white with gray background). Synaptic clusters of gephyrin in dSTORM images were identified by the epifluorescence puncta. Scale bar: 1 µm. (B) Enlarged pointillist images of the two gephyrin clusters indicated in (A). (C) Rendered images of the two gephyrin clusters outlined with the boundaries of the epifluorescence mask. Gephyrin SSDs are indicated with red asterisks in (B) and (C). Scale bar: 200 nm.
- D
Two‐color dSTORM imaging of RIM1/2 and gephyrin in cryosections. From left to right: rendered images of RIM1/2 and gephyrin clusters showing the aligned SSDs (arrows); gephyrin SSDs segmented by H‐watershed outlined with different colors; RIM1/2 SSDs outlined with different colors; binary SSDs of gephyrin and RIM1/2. Inhibitory synapses were identified by the gephyrin clusters in the epifluorescence images. Scale bar: 200 nm. RIM1/2 was labeled with Alexa 647, gephyrin (mAb7a) with Cy3B in these experiments.
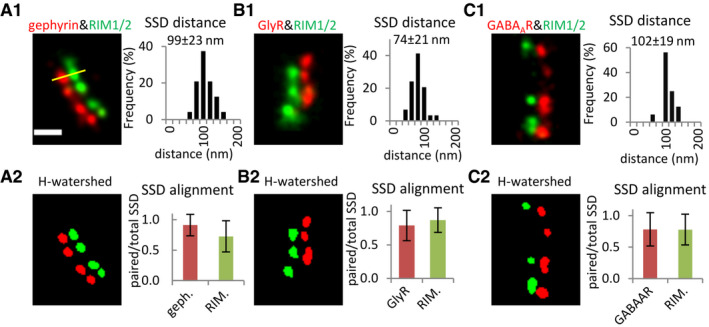
- A–C
Alignment of SSDs of pre‐synaptic RIM1/2 and SSDs of post‐synaptic gephyrin, GlyRs, and GABAARs, respectively. (A1–C1) Distances were measured between the intensity peaks of paired SSDs in rendered dual‐color dSTORM images (yellow line, values given in mean ± SD). RIM1/2 was labeled with Alexa 647 and gephyrin (mAb7a) with Cy3B in (A1). RIM1/2 was labeled with Cy3B, while GlyRs or GABAARs were labeled with Alexa 647 in (B1) and (C1). (A2–C2) Trans‐synaptic alignment of SSDs of gephyrin, GlyRs, GABAARs, and RIM1/2. SSDs were segmented by H‐watershed. Data are plotted as mean ± SD. Number of synapses: n = 48 (A1, A2) from three independent experiments (no treatment), n = 30 (B1, B2) from two experiments with TTX treatment, n = 16 (C1, C2) from two experiments with TTX. Only synapses with side view profiles were included. All images are adjusted to the same scale. Scale bar: 200 nm.
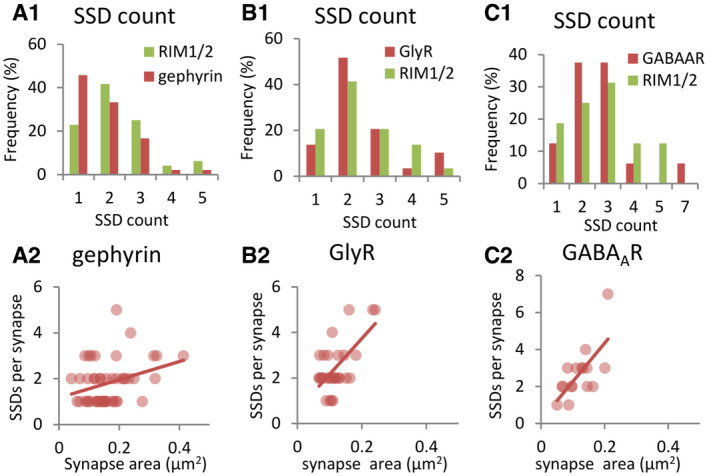
- A–C
Number of SSDs per synapse. (A1–C1) Histograms of SSD numbers of RIM1/2 and gephyrin, GlyRs, and GABAARs, respectively. (A2–C2) Correlation between SSD numbers and synaptic cluster sizes of different post‐synaptic proteins. Spearman R test, P > 0.5 in (A2) and (B2), P < 0.5 in (C2). Quantification was done on synapses with side view profiles as shown in Fig 2. Number of synapses: n = 48 (A1, A2), n = 30 (B1, B2), n = 16 (C1, C2).
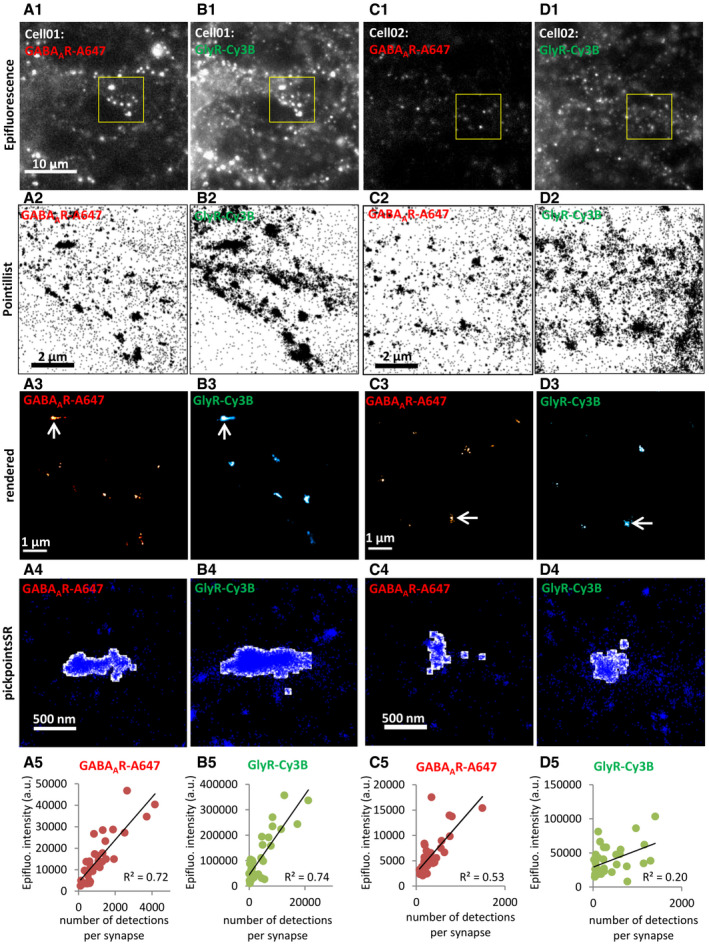
- A–D
Workflow of the dual‐color dSTORM experiments. (A1–D1) Epifluorescence images of two fields of views of spinal cord neurons labeled for GABAARs (with Alexa 647) and GlyRs (with Cy3B). The brightness and contrast between A1 and C1, and between B1 and D1 are adjusted to the same dynamic range. Scale bar: 10 µm. (A2–D2) Pointillist images showing the dSTORM detections within the regions in the yellow boxes in A1–D1. Scale: 2 µm. (A3–D3) Rendered images from the detections shown in A2–D2. Super‐resolution GABAAR clusters are shown in red hot false colors, GlyR clusters in cyan hot. Arrows indicate the synaptic clusters shown in the magnified images A4–D4. Scale: 1 µm. (A4–D4) Detections (blue dots) overlaid with synaptic masks (in white) in the pickpointsSR program in Matlab. Synaptic masks were produced by binarizing the corresponding super‐resolution clusters indicated by arrows in A3–D3. Scale: 500 nm. (A5–D5) Correlation between the total fluorescence intensity of synaptic clusters measured in epifluorescence images and the number of detections per synapse in dSTORM. Spearman R test, P < 0.0001 in A5, B5, C5, P < 0.05 in D5. Each data point represents one synapse (n = 33 in A5 and B5, n = 35 in C5 and D5).
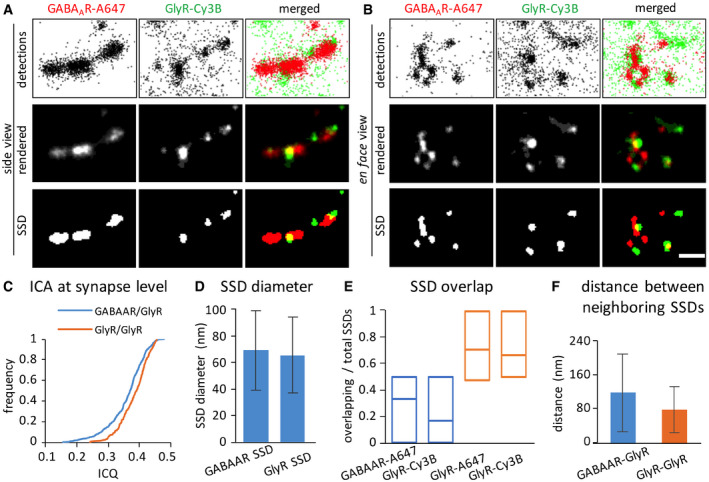
- A, B
Representative dSTORM images of GlyRs and GABAARs at synapses in side view (A) or en face view (B). The top row of images shows the pointillist representation of the detections, the second row the rendered images, and the bottom row the corresponding segmented SSDs. GlyRs were labeled with Cy3B and GABAARs with Alexa Fluor 647 in these experiments. Scale bar: 200 nm.
- C
Image correlation analysis (ICA) of GlyR and GABAAR clusters at the same PSDs. The ICQ values between GlyR and GABAAR clusters (blue trace, 0.36 ± 0.06, n = 395 synapses from three independent experiments) are significantly lower than between GlyR clusters labeled with two secondary antibodies conjugated with different fluorophores (yellow trace, 0.38 ± 0.04, n = 218 synapses from two independent experiments; MW test, P < 0.0001).
- D
The mean diameter of GlyR SSDs is 65 ± 29 nm (mean ± SD, n = 1,105 SSDs from 395 synapses and three independent experiments), that of GABAAR SSDs is 69 ± 30 nm (mean ± SD, n = 733 SSDs from 395 synapses and three experiments).
- E
Partial overlap between the SSDs of GlyRs and GABAARs. The fraction of overlapping SSDs was calculated based on the binarized images for each synapse (without selection for synapse orientation), dividing the number of overlapping SSDs by the total number of SSDs for each receptor. Data are shown as median, 25 and 75% quartiles of the population (only synaptic clusters with ≥ 2 SSDs in the respective channel; n = 183 for GABAAR‐A647, n = 277 for GlyR‐Cy3B, from three independent experiments). GlyRs labeled with both A647‐ and Cy3B‐conjugated secondary antibodies for the same primary antibody were used as positive control (n = 158 GlyR‐A647 and n = 171 GlyR‐Cy3B clusters from two independent experiments). The GABAAR‐GlyR overlap is significantly lower than the GlyR‐GlyR match (KW test, P < 0.0001).
- F
Distance measurement between GlyR SSDs and GABAAR SSDs (blue bar; mean ± SD, n = 556 SSDs from 395 synapses and three independent experiments) and between double‐labeled GlyR SSDs (yellow, mean ± SD, n = 403 SSDs from 218 synapses and two experiments).
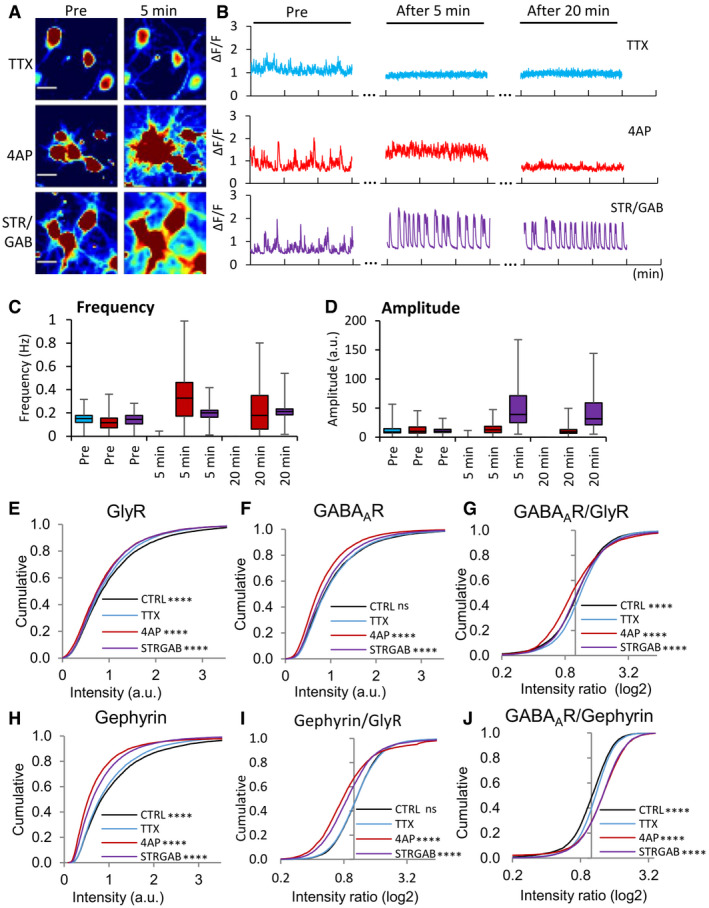
- A
Calcium signals before treatment (pre) and after a 5‐min application of TTX (top), 4‐AP (middle), or strychnine/gabazine (bottom, false color). The brightness and contrast were adjusted to the same range across all the images. Note that cells active at baseline were chosen in order to better illustrate the effects of the treatments. Scale bar: 20 μm.
- B
Measurement of calcium signals at the beginning of the recording (pre) and after 5 and 20 min of bath application of TTX (top, blue traces), 4‐AP (middle, red traces), or strychnine/gabazine (bottom, purple traces) to induce changes in neuronal network activity.
- C, D
Quantification of the amplitudes and frequency of the calcium signals. The amplitude was calculated as the average intensity of calcium transients per cell during the 3 min recordings. Before treatment (pre), baseline activity had a frequency of 0.15 ± 0.06 Hz/0.12 ± 0.07 Hz/0.14 ± 0.06 Hz, and an amplitude of 12.72 ± 9.21/12.34 ± 8.04/11.33 ± 5.25 (in cells treated with TTX, 4‐AP, and strychnine/gabazine, respectively). TTX blocked all neuronal activity, as judged by the lack of calcium signals after application. Five minutes after 4‐AP treatment, the frequency of calcium transients was greatly increased (0.33 ± 0.21 Hz, Friedman test with Dunn's post hoc test, P < 0.0001) and the amplitude was unchanged (14.56 ± 9.43, P = 0.31). On the other hand, 5 min strychnine/gabazine treatment increased both the frequency (0.20 ± 0.06, P < 0.0001) and the amplitude (52.68 ± 39.23, P < 0.0001). Number of cells: n = 117 for 4‐AP (red bars), n = 70 for TTX treatment (blue bars), n = 114 for strychnine/gabazine (purple bars), from three independent experiments, data are represented as box plots showing the median, 25 and 75% quartiles, as well as the minimum and the maximum of the population.
- E–J
Differential regulation of GlyRs, GABAARs, and gephyrin through altered network activity. (E–G) Quantification of synaptic levels of GlyRs, GABAARs, and GABAAR/GlyR ratios using ICC. Some of these data are the same as in Fig 4 (TTX and 4‐AP treatment). (H) Treatment of cultured spinal cord neurons with 4‐AP strongly reduced gephyrin immuno‐labeling (KW test, P < 0.0001). Gephyrin was detected with mAb7a antibody that recognizes the phosphorylated S270 epitope of gephyrin. (I, J) Intensity ratios of gephyrin/GlyR and GABAAR/gephyrin, showing their relative changes at the same synapses (KW test, P < 0.0001 in I and J). The control (CTRL) condition was without any pharmacological treatment. Number of synapses: n = 9,416 in TTX (blue traces), n = 6,949 in 4‐AP (red), n = 8,856 in CTRL (black), n = 8,150 in strychnine/gabazine conditions (purple) from three independent experiments. KW test/Dunn's test, P values indicate the comparison to the TTX condition. ns: not significant, ****P < 0.0001.
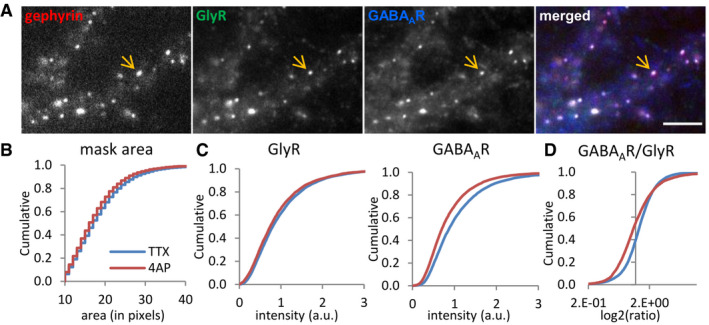
Triple immuno‐labeling of gephyrin, GlyRs, and GABAARs at mixed inhibitory synapses (arrow) imaged with conventional fluorescence microscopy. Scale bar: 5 µm.
Quantification of the apparent synaptic area (in pixels) of gephyrin clusters (KS test P < 0.0001).
Lower fluorescence intensity of GABAARs but only a minor reduction of GlyRs at synaptic gephyrin clusters (KS test, P < 0.0001, both panels).
Reduced GABAAR/GlyR intensity ratio at mixed inhibitory synapses (KS test, P < 0.0001). Number of synapses: n = 9,416 in TTX and n = 6,949 in 4‐AP conditions from three independent experiments.
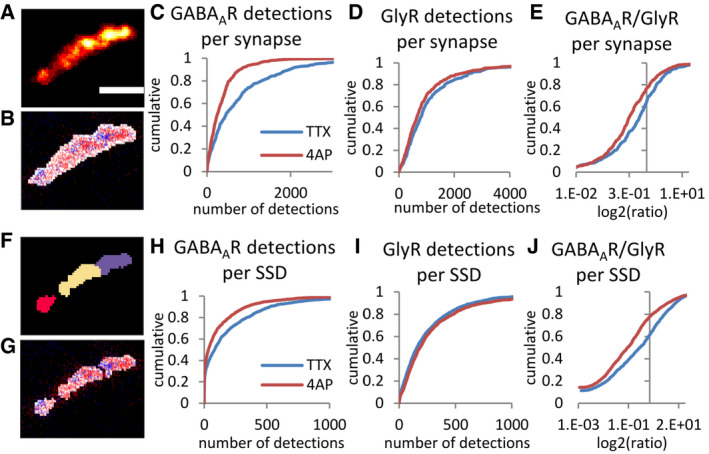
- A–E
Characterization of the nanoscale organization of GABAARs and GlyRs at mixed inhibitory synapses. (A) Synaptic receptor cluster rendered from detections of both GABAARs (labeled with Alexa 647) and GlyRs (labeled with Cy3B). (B) Detections of GABAARs (red dots) and GlyRs (blue dots) overlaid with binary synaptic mask (white). (C–E) Detections of GABAARs, but not GlyRs were strongly decreased at mixed synapses after 4‐AP treatment (KS test, P < 0.0001 in C and E, P < 0.001 in D). Scale bar: 200 nm.
- F–J
Sub‐synaptic characterization of GABAAR and GlyR domains. (F) Watershed segmentation of sub‐synaptic domains (SSDs). Each SSD is shown in different colors. (G) Detections of GABAARs (red dots) and GlyRs (blue dots) overlaid with SSDs (white). (H–J) Detections of GABAARs but not GlyRs at the same SSDs were reduced after 4‐AP treatment (KS, P < 0.0001 in H and J, P < 0.01 in I). Number of synapses: n = 439 in TTX, n = 531 in 4‐AP condition, from three independent experiments.
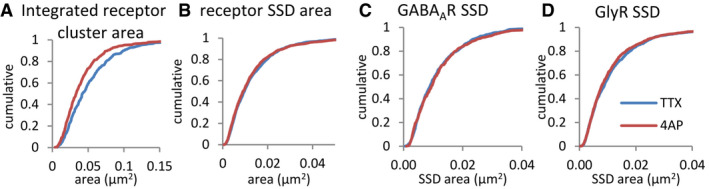
- A
Synaptic receptor areas were calculated from the combined clusters of GABAARs and GlyRs in dSTORM images.
- B
Receptor SSDs were segmented from the combined receptor clusters.
- C, D
GABAAR SSDs were segmented from rendered dSTORM images of GABAAR detections, and GlyR SSDs from dSTORM images of GlyR detections. 4‐AP treatment led to a decrease in the total synapse area (A, KS test, P < 0.0001), but not the size of receptor SSDs (B, KS test, P = 0.21), GABAAR SSDs (C, KS test, P = 0.50) or GlyR SSDs (D, KS test, P = 0.23).
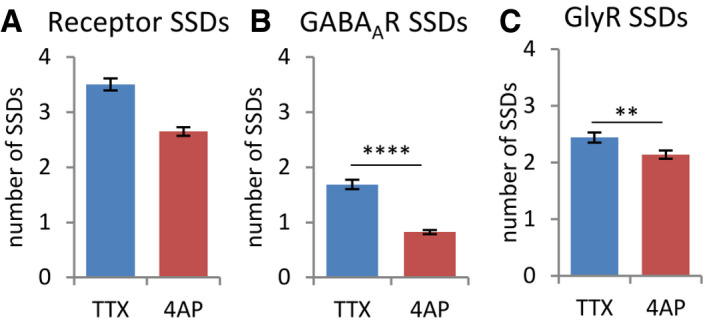
The number of receptor SSDs, segmented from the combined receptor clusters of GABAARs and GlyRs, was decreased after 4‐AP treatment (MW test, P < 0.0001).
This was mostly due to the loss of GABAAR SSDs that were segmented from the rendered images of GABAAR detections only (MW, ****P < 0.0001).
The number of GlyR SSDs (based on GlyR detections) was only marginally reduced (MW, **P < 0.01).
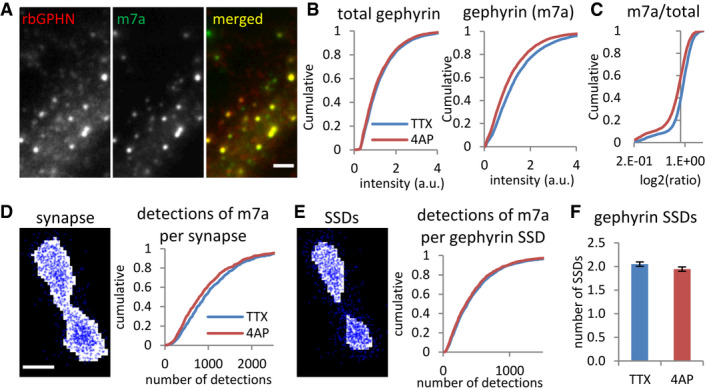
- A–C
Reduced immunoreactivity of S270 phosphorylated gephyrin but not total gephyrin levels after 4‐AP treatment, revealed by conventional fluorescence microscopy (KS test, P < 0.001 in B1 and P < 0.0001 in B2, P < 0.0001 in C). Total gephyrin was probed with polyclonal rabbit primary antibody (rbGPHN), and pS270 phosphorylated gephyrin with monoclonal mouse primary antibody (m7a). Number of synapses: n = 4,040 in TTX and n = 3,818 in 4‐AP conditions from two independent experiments. Scale bar: 2 µm.
- D–F
Reduced numbers of pS270 gephyrin (m7a) detections were recorded by dSTORM for the entire synaptic area (D, KS test, P < 0.01). The number of detections of pS270 gephyrin per SSD (E, KS test, P = 0.18) and the number of SSDs (F, MW test, P = 0.11) were not changed by 4‐AP treatment. Gephyrin was probed with mAb7a antibody and Alexa 647 dye. Number of synapses: n = 810 in TTX and n = 727 in 4‐AP conditions from three independent experiments; (F) mean ± SEM. Scale bar: 100 nm.
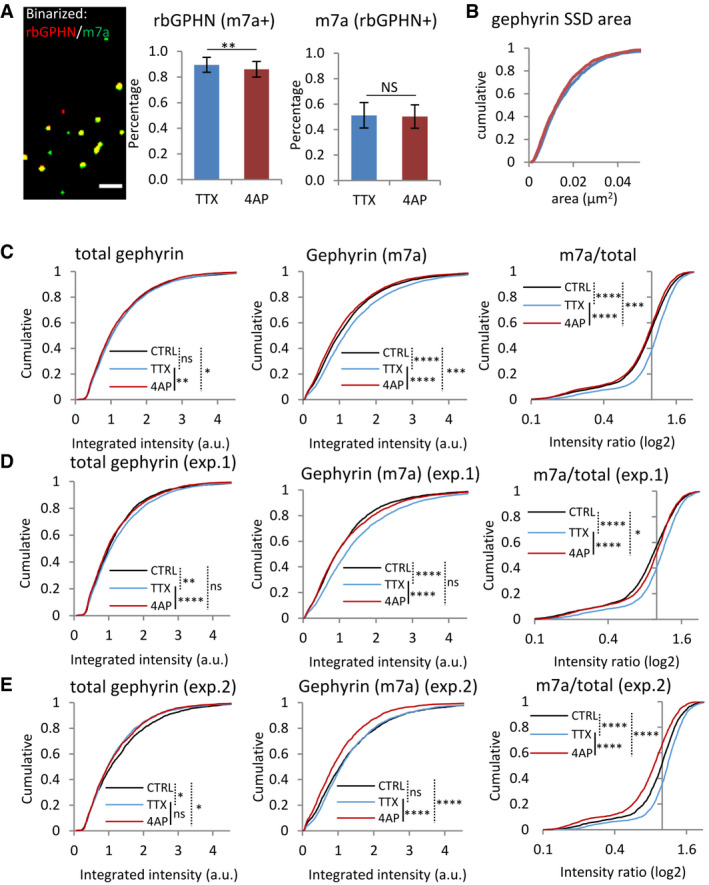
- A
Co‐localization of total gephyrin (rbGPHN) and phosphorylated pS270 gephyrin clusters (mAb7a) in conventional epifluorescence images. This is a binarized version of the image shown in Fig 7A. Scale bar: 2 µm. After 4‐AP treatment, the percentage of rbGPHN clusters positive for mAb7a (binarized) showed only a minor reduction (middle panel, MW test, **P < 0.01), possibly as a result of decreased mAb7a immunoreactivity. The percentage of mAb7a clusters positive for rbGPHN was not changed (right panel, MW test P = 0.74). mean ± SD; TTX: n = 4,040 synapses, 4‐AP: n = 3,818, from two independent experiments.
- B
Gephyrin SSDs segmented from mAb7a clusters in dSTORM images did not show differences in size after 4‐AP treatment (KS test, P = 0.05, n = 810 synapses in TTX and n = 727 in 4‐AP conditions from three experiments).
- C–E
Variability of network activity in the control condition (CTRL, no treatment) in primary spinal cord neuron cultures. (C) The pooled results of two independent experiments (shown in D and E) show that the immunoreactivity of pS270 gephyrin (mAb7a antibody) is differentially modulated by pharmacological treatments that increase (4‐AP, red traces) or decrease (TTX, blue) network activity, relative to the control condition (CTRL, black). Some of these data (TTX and 4‐AP) are the same as the ones shown in Fig 7B and C. Number of synapses: n = 4,040 in TTX (blue traces), n = 3,818 in 4‐AP (red), n = 3,946 in the CTRL condition (black) from two independent experiments. (D, E) Separate analysis of the two experiments shows that while the difference between the TTX and 4‐AP conditions is consistent, the control can vary substantially between experiments. Number of synapses: n = 2,362 in CTRL, n = 2,577 in TTX and n = 2,283 in 4‐AP conditions in (D), and n = 1,584 in CTRL, n = 1,463 in TTX and n = 1,535 in 4‐AP in (E). KW test/Dunn's test, ns: not significant, *P < 0.05, **P < 0.01, ***P < 0.001, ****P < 0.0001.
References
-
- Alvarez FJ (2017) Gephyrin and the regulation of synaptic strength and dynamics at glycinergic inhibitory synapses. Brain Res Bull 129: 50–65 - PubMed
-
- Bolte S, Cordelières FP (2006) A guided tour into subcellular colocalization analysis in light microscopy. J Microsc 224: 213–232 - PubMed
-
- Brocher J (2014) Qualitative and quantitative evaluation of two new histogram limiting binarization algorithms. Int J Image Process 8: 30–48
Publication types
MeSH terms
Substances
Grants and funding
LinkOut - more resources
Full Text Sources
Other Literature Sources
