. 2021 Aug;8(15):e2100363.
doi: 10.1002/advs.202100363. Epub 2021 May 27.

Calcium-Collagen Coupling is Vital for Biomineralization Schedule

Affiliations

Calcium-Collagen Coupling is Vital for Biomineralization Schedule

Jinglun Zhang et al. Adv Sci (Weinh). 2021 Aug.

Abstract

Biomineralization is a chemical reaction that occurs in organisms in which collagen initiates and guides the growth and crystallization of matched apatite minerals. However, there is little known about the demand pattern for calcium salts and collagen needed by biomineralization. In this study, natural bone biomineralization is analyzed, and a novel interplay between calcium concentration and collagen production is observed. Any quantitative change in one of the entities causes a corresponding change in the other. Translocation-associated membrane protein 2 (TRAM2) is identified as an intermediate factor whose silencing disrupts this relationship and causes poor mineralization. TRAM2 directly interacts with the sarcoplasmic/endoplasmic reticulum calcium ATPase 2b (SERCA2b) and modulates SERCA2b activity to couple calcium enrichment with collagen biosynthesis. Collectively, these findings indicate that osteoblasts can independently and directly regulate the process of biomineralization via this coupling. This knowledge has significant implications for the developmentally inspired design of biomaterials for bone regenerative applications.

Keywords: biomineralization; bone biomaterials; bones; calcium-collagen coupling; collagen.


Conflict of interest statement

The authors declare no conflict of interest.

Figures
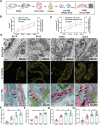
Figure 1
Figure 1
Correlation between Ca2+ and Col1 during mineralization in vivo. A) Schematic illustration of the experimental design. Embryonic cranial bones collected at different time points were analyzed by ICP‐OES, STEM and immune‐TEM to determine relationship between the Ca2+ and collagen contents during development of cranium. B) Total Ca2+ concentrations and collagen levels of whole cranial bones (N = 7 replicates; means of each group are connected; ** P = 0.0064). C) Intracellular Ca2+ concentrations and collagen levels of cranial bones (N = 7 replicates; means of each group are connected; ** P = 0.0012). D) STEM–EDX elemental mapping and unstained immune‐TEM images of cranial bones. Scale bar = 200 nm. M, mitochondria; N, nucleus; ER, endoplasmic reticulum. Unstained sections are pseudo‐colored. Backgrounds are light blue. ERs are pink. Mitochondria are green. Arrows = Col1. E) The comparison of Col1 positive dots per cell. N = 7. F) The comparison of elemental compositions (at%) among regions containing ER in the same area of the groups. N = 6. G) The comparison of the percentage of cells bearing dilated ER. Dilated ER elements are defined as ribosome‐studded organelles with expanded lumina (>0.05 µm2 in cross‐sectional area). N = 7. H) The comparison of sectional size of dilated ER. N = 10. E–H) Data represent the mean with standard deviation. ** P < 0.005, **** P<0.0001, ns, no significant difference. All of the experiments are performed at least three times. Unless otherwise stated, data presented in all figures are the mean standard deviation with one‐way ANOVA with Tukey's post‐test.
Figure 2
Figure 2
Changes in the Ca2+ concentration led to corresponding changes in ER collagen content. A) Schematic illustration. Based on quantitative consistency of Ca2+ and collagen, BMSCs underwent osteogenic induction by OM, and then two kinds of treatments was administered for 6 h, followed by determination of Ca2+ and collagen changes. Ion, ionomycin; TG, thapsigargin. B) The D1ER fluorescence images. Scale bar = 10 µm. The relative basal FRET ratio (FRET/CFP) of D1ER in three groups. N = 6. B) ER Ca2+ levels were monitored in control (grey line, N = 80), + Ion group (red line, N = 65), + TG group (blue line, N = 70) after the stimulation of 100 × 10−6 m ATP. Error bars represent ± SEM. Histogram shows the average ER Ca2+ levels in resting cells. N = 10. C) Col1 and GAPDH (loading control) immunoblots of total protein. The three forms of the α(I) chain of collagen I: Pro is the unprocessed form with the N‐ and C‐propeptides; pC is collagen with the N‐propeptide cleaved; an α1(I) is the fully processed α(I) band. Quantification of data. N = 5; two‐tailed Student's t‐test. D) Col1, GAPDH and CANX (loading control) immunoblots of cell fractions. Quantification of data. N = 3; two‐way ANOVA with Dunnett's multiple comparisons test. E) STEM‐EDX elemental mapping and unstained immune‐TEM images. Insets show a high magnification of selected areas. Scale bar = 500 nm and = 200 nm in insets. Unstained sections are pseudo‐colored. Arrows = Col1. F) The comparison of elemental compositions (at%) among regions containing ER. N = 6. G) The comparison of Col1 positive dots per cell. N = 7. H) The comparison of sectional size of dilated ER. N = 10. I) The comparison of the percentage of cells bearing dilated ER. N = 10. Cells in this figure are osteogenic induced for 3 days and then treated for 6 h. ** P < 0.005, *** P < 0.0005, and **** P < 0.0001. All of the experiments are performed at least three times.
Figure 3
Figure 3
Alteration of the Col1 biosynthesis caused consistent changes in ER Ca2+ concentrations. A) Schematic illustration. Based on quantitative consistency of Ca2+ and collagen, BMSCs underwent osteogenic induction by OM, and then the collagen expression was inhibited and recovered, followed by determination of Ca2+ and collagen changes. Lv‐Col1 indicates lentiviral Col1 plasmids. B,C) The inhibitory effects of FT011 and the retrieval effects of Lv‐Col1 in dose‐dependent manner. N = 5. D) Fura‐2‐AM fluorescence changes. Scale bar = 10 µm. Histogram shows the fluorescence intensity (arbitrary units). N = 9. E) Cytosolic Ca2+ changes tested by Fluo‐4‐AM (Fluo 4) (presented in ΔF/F). Error bars represent ± SEM (control group, grey line, N = 30; inhibitory group, red line, N = 35; retrieval group, blue line, N = 30). Bar chart showing the area under the curves (AUC). N = 5. F) The D1ER fluorescence images. Scale bar = 10 µm. The relative basal FRET ratio (FRET/CFP) of D1ER. N = 6. G) STIM1 localization. Arrowheads = STIM1 puncta. Scale bar = 5 µm. F P/F TOT is calculated as the ratio of fluorescence intensity in the peripheral region (F P) to the total cell fluorescence (F TOT). N = 5. H) STEM‐EDX elemental mapping and unstained immune‐TEM images. Insets are high magnification of selected areas. Scale bar = 500 nm and = 200 nm in insets. Unstained sections are pseudo‐colored. Arrows = Col1. I,J) The comparison of Col1 positive dots per cell and elemental compositions (at%) among regions containing ER. N = 6. K,L) The comparison of sectional size of dilated ER and the percentage of cells bearing dilated ER. N = 10. Cells in this figure are osteogenic induced for 3 days and then treated for 2h, with or without transfection. All of the experiments are performed at least three times. *P < 0.05, **P < 0.005, ***P < 0.0005, and ****P < 0.0001, ns, no significant difference.
Figure 4
Figure 4
ER‐related proteins were candidates involved in the bidirectional relationship. A) Venn diagram of DEGs. B,C) KEGG pathway enrichment and significant GO terms of differentially expressed genes. DEGs (4593) were analyzed for the KEGG and GO pathway. Bar charts present the significant terms in each category sorted by mean −log10 (P‐values). Gene Ratio of “Protein processing in ER” is 0.0413 and that of “Response to ER stress” is 0.0315. D) Venn diagram of 2 candidate genes by intersecting differentially expressed genes with ER component of ion transport collection and collagen biosynthetic collection. E,H) SERCA2b and GAPDH (loading control) immunoblots (N = 7; normalized fold‐changes were analyzed using two‐tailed Student's t‐test comparing the two conditions). F,I) Relative mRNA levels of SERCA2b. N = 5; two‐tailed Student's t‐test. G,J) Relative SERCA2b activity. N = 7; two‐tailed Student's t‐test. All of the experiments are performed at least three times. *P < 0.05, **P < 0.005, ***P < 0.0005, and ****P < 0.0001, ns, no significant difference.
Figure 5
Figure 5
Knockdown of TRAM2 disrupted the connection between Ca2+ and Col1. A) Schematic illustration. After bioinformatics analysis and preliminary screening, TRAM2‐knockdown BMSCs underwent osteogenic induction by OM, finding the inhibition and depletion of Ca2+ and collagen, with the coupling disrupted. B) The D1ER fluorescence images. Scale bar = 10 µm. The relative basal FRET ratio (FRET/CFP) of D1ER. N = 6. C) STIM1 localization. Arrowheads = STIM1 puncta. Scale bar = 10 µm. F P/F TOT calculation is performed as mentioned above. N = 5; one‐way ANOVA with Dunnett's multiple comparisons test. D‐E) Col1 and GAPDH (loading control) or CANX (loading control for ER protein) immunoblots of total and ER proteins. N = 4; two‐tailed Student's t‐test. F) Col1 and GAPDH (loading control) immunoblots of cell (without extracellular matrix) and cytoplasm proteins. N = 4. G) Fura‐2‐AM fluorescence changes. Scale bar = 10 µm. Histogram shows the fluorescence intensity (arbitrary units). N = 9. H) Cytosolic Ca2+ changes tested by Fluo4 (ΔF/F) treated in the absence of Ca2+. Error bars represent ± SEM (control group, grey line, N = 40; knockdown group, red line, N = 35; + FT011 group, blue line, N = 40; retrieval group, green line, N = 45). Bar chart showing the area under the curves (AUC). N = 5. I) The D1ER fluorescence images. Scale bar = 10 µm. The relative basal FRET ratio (FRET/CFP) of D1ER. N = 6. J) ER Ca2+ levels were monitored by D1ER in control group, N = 40; knockdown group, N = 35; + FT011 group, N = 40; retrieval group, N = 45, after the stimulation of 100 × 10−6 m ATP. Error bars represent ± SEM. Histogram shows the average ER Ca2+ levels in resting cells in each group. N = 10. Lv‐sh indicates TRAM2 knockdown cells. All of the experiments are performed at least three times. *P < 0.05, **P < 0.005, ***P < 0.0005, and ****P < 0.0001, ns, no significant difference.
Figure 6
Figure 6
TRAM2 coupled ER Ca2+ and collagen by directly binding to SERCA2b and collagen, which is critical to biomineralization. A,B) Using His antibody to pull down, endogenous SERCA2b and Col1 coimmunoprecipitate with His‐tagged TRAM2. N = 4; two‐way ANOVA with Tukey's post‐test. C) TEM images. Backgrounds are light blue. ERs are pink. Mitochondria are green. Nuclei are navy blue. Scale bar = 200 nm. D) The comparison of the percentage of cells bearing dilated ER and the sectional size of dilated ER. N = 10. E) SERCA2b, TRAM2, and GAPDH (loading control) immunoblots of total proteins. N = 4; two‐way ANOVA with Tukey's post‐test. F) Relative SERCA2b activity. N = 7; two‐tailed Student's t‐test. All of the experiments are performed at least three times. *P < 0.05, **P < 0.005, ***P < 0.0005, and ****P < 0.0001, ns, no significant difference.
Figure 7
Figure 7
Schematic representation of the calcium–collagen coupling. TRAM2 can bind with naïve collagen protein and maintain the activity of SERCA2b by binding to it, which enables control of the translocation of Col1 and the transport of Ca2+ into the ER. Then, Ca2+ clusters and collagen are transported into the mitochondria and Golgi apparatus, respectively, followed by exocytosis, to be involved in bone matrix mineralization.

Similar articles

Cited by

References

    1. a) Wang S. J., Jiang D., Zhang Z. Z., Chen Y. R., Yang Z. D., Zhang J. Y., Shi J., Wang X., Yu J. K., Adv. Mater. 2019, 31, 1904341; - PubMed
    2. b) Yuan X., Wei Y., Villasante A., Ng J. J. D., Arkonac D. E., Chao P. G., Vunjak‐Novakovic G., Biomaterials 2017, 132, 59; - PMC - PubMed
    3. c) Lee C. S., Kim S., Fan J., Hwang H. S., Aghaloo T., Lee M., Sci. Adv. 2020, 6, eaaz7822; - PMC - PubMed
    4. d) McDermott A. M., Herberg S., Mason D. E., Collins J. M., Pearson H. B., Dawahare J. H., Tang R., Patwa A. N., Grinstaff M. W., Kelly D. J., Alsberg E., Boerckel J. D., Sci. Transl. Med. 2019, 11, eaav7756. - PMC - PubMed
    1. Nudelman F., Pieterse K., George A., Bomans P. H., Friedrich H., Brylka L. J., Hilbers P. A., de With G., Sommerdijk N. A., Nat. Mater. 2010, 9, 1004. - PMC - PubMed
    1. Wang Y., Azais T., Robin M., Vallee A., Catania C., Legriel P., Pehau‐Arnaudet G., Babonneau F., Giraud‐Guille M. M., Nassif N., Nat. Mater. 2012, 11, 724. - PubMed
    1. a) Kim D., Lee B., Thomopoulos S., Jun Y. S., Nat. Commun. 2018, 9, 962; - PMC - PubMed
    2. b) Song Q., Jiao K., Tonggu L., Wang L. G., Zhang S. L., Yang Y. D., Zhang L., Bian J. H., Hao D. X., Wang C. Y., Ma Y. X., Arola D. D., Breschi L., Chen J. H., Tay F. R., Niu L. N., Sci. Adv. 2019, 5, eaav9075. - PMC - PubMed
    1. He K., Sawczyk M., Liu C., Yuan Y., Song B., Deivanayagam R., Nie A., Hu X., Dravid V. P., Lu J., Sukotjo C., Lu Y. P., Kral P., Shokuhfar T., Shahbazian‐Yassar R., Sci. Adv. 2020, 6, eaaz7524. - PMC - PubMed

Publication types

LinkOut - more resources