

Delta power robustly predicts cognitive function in Angelman syndrome
- PMID: 34047077
- PMCID: PMC8283185
- DOI: 10.1002/acn3.51385
Delta power robustly predicts cognitive function in Angelman syndrome
Abstract
Objective: Angelman syndrome (AS) is a severe neurodevelopmental disorder caused by loss of function of the maternally inherited UBE3A gene in neurons. Promising disease-modifying treatments to reinstate UBE3A expression are under development and an early measure of treatment response is critical to their deployment in clinical trials. Increased delta power in EEG recordings, reflecting abnormal neuronal synchrony, occurs in AS across species and correlates with genotype. Whether delta power provides a reliable biomarker for clinical symptoms remains unknown.
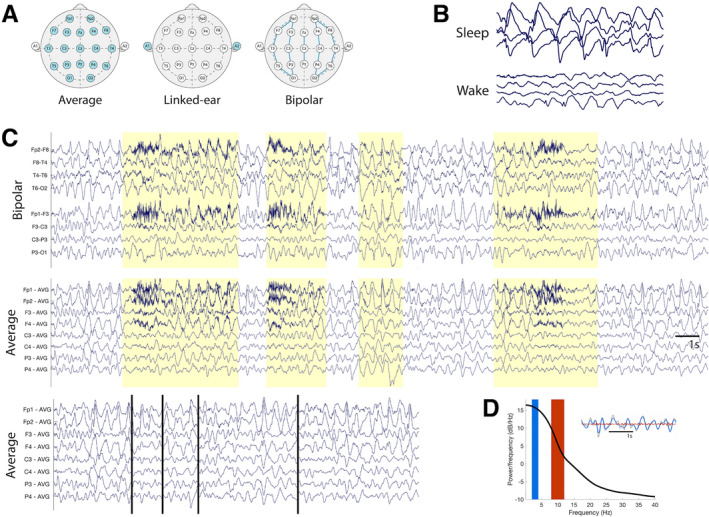
Methods: We analyzed combined EEG recordings and developmental assessments in a large cohort of individuals with AS (N = 82 subjects, 133 combined EEG and cognitive assessments, 1.08-28.16 years; 32F) and evaluated delta power as a biomarker for cognitive function, as measured by the Bayley Cognitive Score. We examined the robustness of this biomarker to varying states of consciousness, recording techniques and analysis procedures.
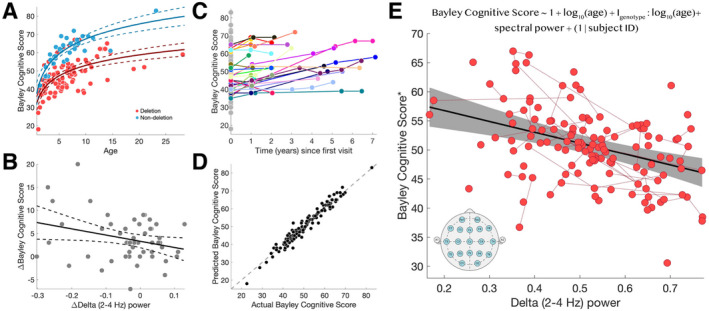
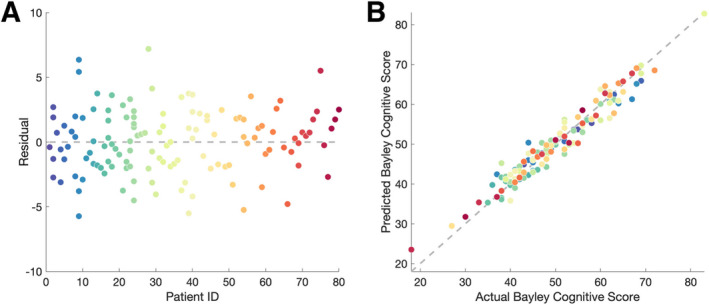
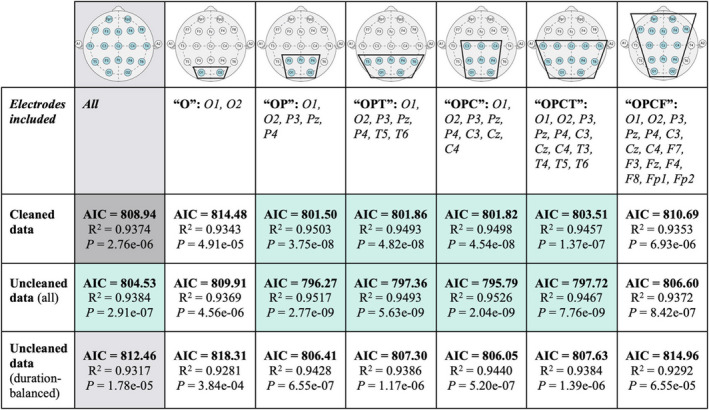
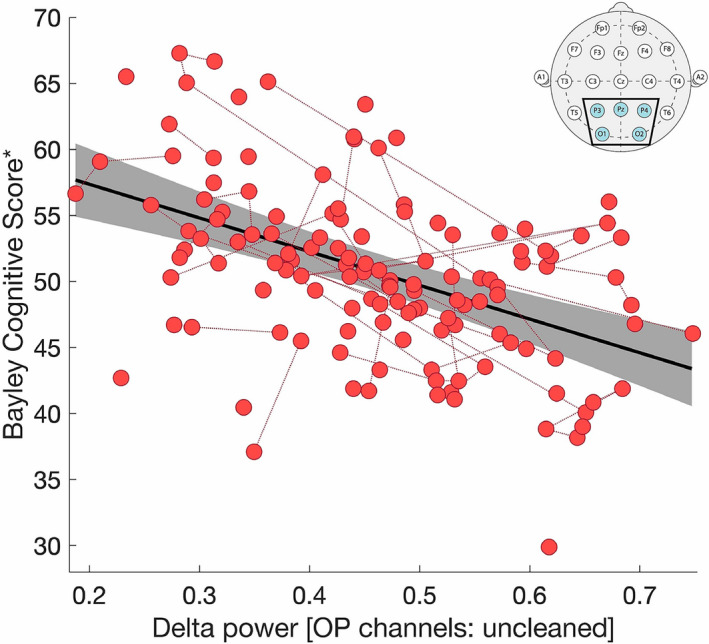
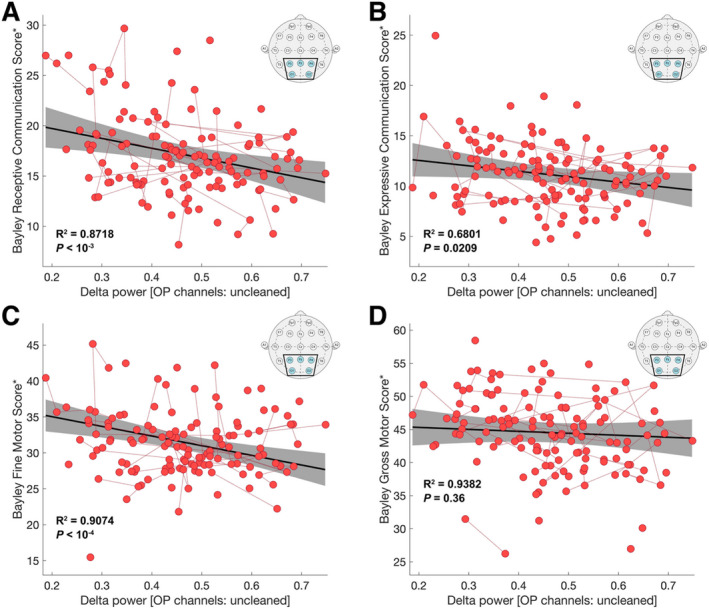
Results: Delta power predicted the Bayley Scale cognitive score (P < 10-5 , R2 = 0.9374) after controlling for age (P < 10-24 ), genotype:age (P < 10-11 ), and repeat assessments (P < 10-8 ), with the excellent fit on cross validation (R2 = 0.95). There were no differences in model performance across states of consciousness or bipolar versus average montages (ΔAIC < 2). Models using raw data excluding frontal channels outperformed other models (ΔAIC > 4) and predicted performance in expressive (P = 0.0209) and receptive communication (P < 10-3 ) and fine motor skills (P < 10-4 ).
Interpretation: Delta power is a simple, direct measure of neuronal activity that reliably correlates with cognitive function in AS. This electrophysiological biomarker offers an objective, clinically relevant endpoint for treatment response in emerging clinical trials.
© 2021 The Authors. Annals of Clinical and Translational Neurology published by Wiley Periodicals LLC on behalf of American Neurological Association.
Conflict of interest statement
C.J.C. and M.A.K. have provided consulting services for Biogen Inc. R.K. is employed at Biogen Inc. R.T. receives clinical support from the Angelman Foundation and consults for Ovid Pharmaceuticals and Roche Pharma.
Figures
Similar articles
-
Electrophysiological Phenotype in Angelman Syndrome Differs Between Genotypes.Biol Psychiatry. 2019 May 1;85(9):752-759. doi: 10.1016/j.biopsych.2019.01.008. Epub 2019 Jan 19. Biol Psychiatry. 2019. PMID: 30826071 Free PMC article.
-
Longitudinal EEG model detects antisense oligonucleotide treatment effect and increased UBE3A in Angelman syndrome.Brain Commun. 2022 Apr 26;4(3):fcac106. doi: 10.1093/braincomms/fcac106. eCollection 2022. Brain Commun. 2022. PMID: 35611307 Free PMC article.
-
Neurodevelopmental profile of siblings with Angelman syndrome due to pathogenic UBE3A variants.J Intellect Disabil Res. 2020 Mar;64(3):246-250. doi: 10.1111/jir.12700. Epub 2019 Dec 19. J Intellect Disabil Res. 2020. PMID: 31854050 Free PMC article.
-
Angelman syndrome - insights into a rare neurogenetic disorder.Nat Rev Neurol. 2016 Oct;12(10):584-93. doi: 10.1038/nrneurol.2016.133. Epub 2016 Sep 12. Nat Rev Neurol. 2016. PMID: 27615419 Review.
-
Neurologic manifestations of Angelman syndrome.Pediatr Neurol. 2013 Apr;48(4):271-9. doi: 10.1016/j.pediatrneurol.2012.09.015. Pediatr Neurol. 2013. PMID: 23498559 Review.
Cited by
-
Nacc1 Mutation in Mice Models Rare Neurodevelopmental Disorder with Underlying Synaptic Dysfunction.J Neurosci. 2024 Apr 3;44(14):e1610232024. doi: 10.1523/JNEUROSCI.1610-23.2024. J Neurosci. 2024. PMID: 38388424 Free PMC article.
-
Hyperexcitability and translational phenotypes in a preclinical mouse model of SYNGAP1-Related Intellectual Disability.Res Sq [Preprint]. 2024 Mar 19:rs.3.rs-4067746. doi: 10.21203/rs.3.rs-4067746/v1. Res Sq. 2024. Update in: Transl Psychiatry. 2024 Oct 2;14(1):405. doi: 10.1038/s41398-024-03077-6. PMID: 38562838 Free PMC article. Updated. Preprint.
-
The UBE3A-ATS antisense oligonucleotide rugonersen in children with Angelman syndrome: a phase 1 trial.Nat Med. 2025 Jul 11. doi: 10.1038/s41591-025-03784-7. Online ahead of print. Nat Med. 2025. PMID: 40646322
-
Improving clinical trial readiness to accelerate development of new therapeutics for Rett syndrome.Orphanet J Rare Dis. 2022 Mar 4;17(1):108. doi: 10.1186/s13023-022-02240-w. Orphanet J Rare Dis. 2022. PMID: 35246185 Free PMC article. Review.
-
Insulin-like growth factor-2 does not improve behavioral deficits in mouse and rat models of Angelman Syndrome.Mol Autism. 2021 Sep 15;12(1):59. doi: 10.1186/s13229-021-00467-1. Mol Autism. 2021. PMID: 34526125 Free PMC article.
References
-
- Deverman BE, Ravina BM, Bankiewicz KS, et al. Gene therapy for neurological disorders: progress and prospects. Nat Rev Drug Discov 2018;17:641–659. - PubMed
-
- Petersen MB, Brøndum‐Nielsen K, Hansen LK, Wulff K. Clinical, cytogenetic, and molecular diagnosis of Angelman syndrome: estimated prevalence rate in a Danish county. Am J Med Genet 1995;60:261–262. - PubMed
-
- Kyllerman M. On the prevalence of Angelman syndrome. Am J Med Genet 1995;59:405. - PubMed
-
- Mertz LGB, Christensen R, Vogel I, et al. Angelman syndrome in Denmark. Birth incidence, genetic findings, and age at diagnosis. Am J Med Genet A 2013;161:2197–2203. - PubMed
Publication types
MeSH terms
Substances
Grants and funding
LinkOut - more resources
Full Text Sources
Other Literature Sources
Research Materials