. 2021 Dec 1;106(12):3090-3099.
doi: 10.3324/haematol.2020.274878.

A Pin1/PML/P53 axis activated by retinoic acid in NPM-1c acute myeloid leukemia

Affiliations

A Pin1/PML/P53 axis activated by retinoic acid in NPM-1c acute myeloid leukemia

Rita Hleihel et al. Haematologica. .

Abstract

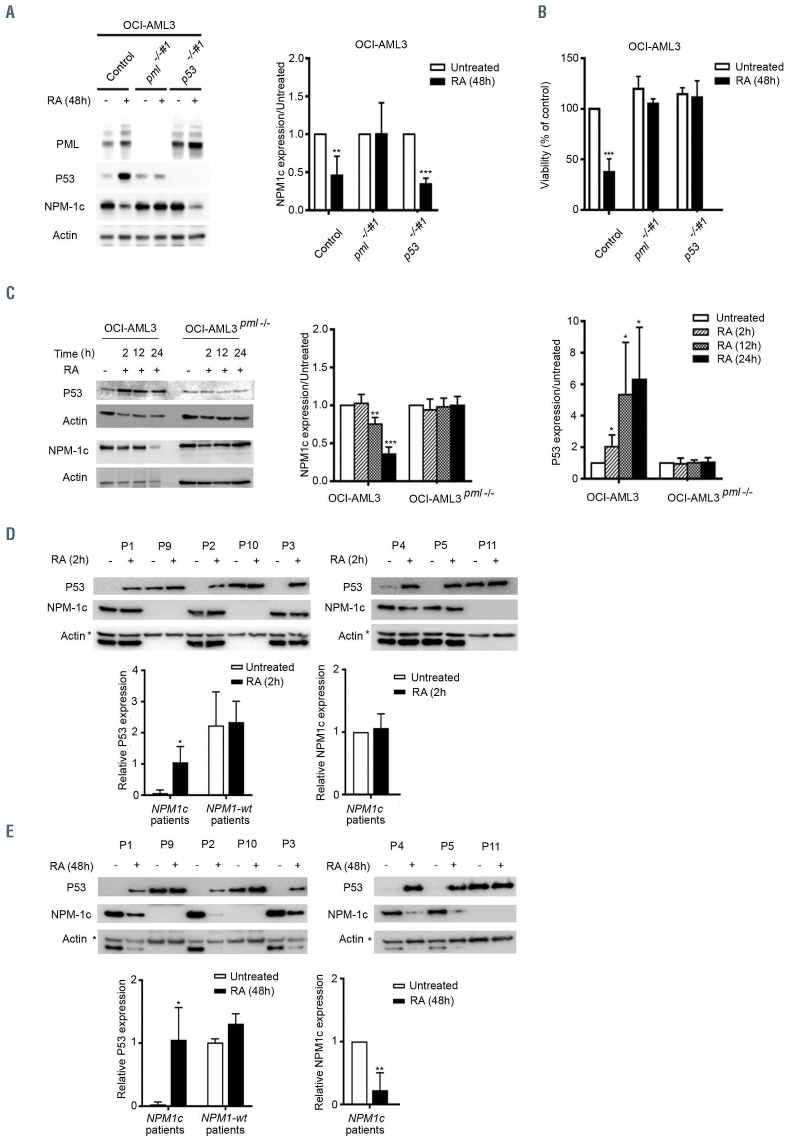
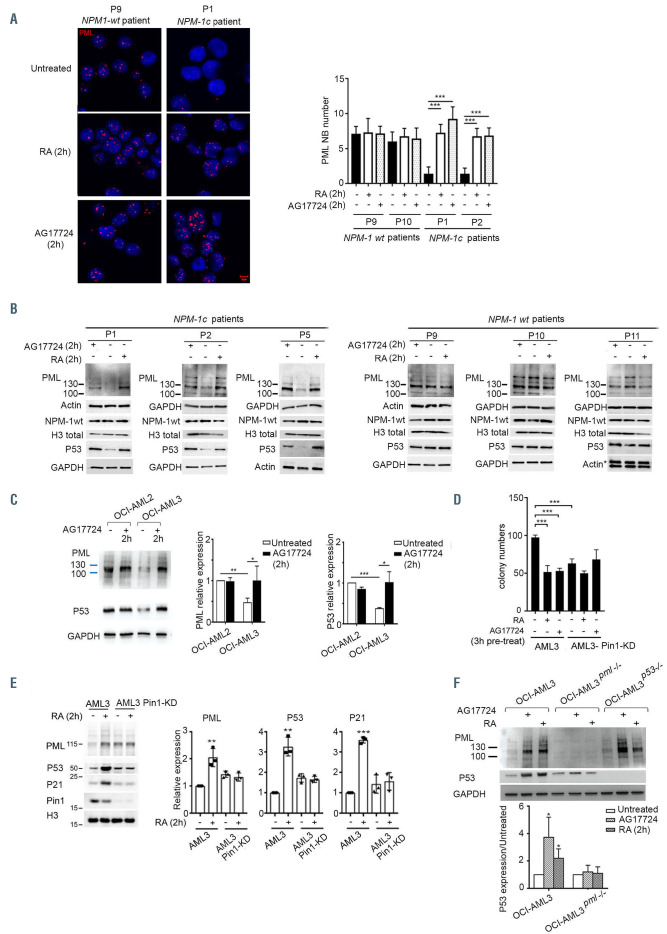
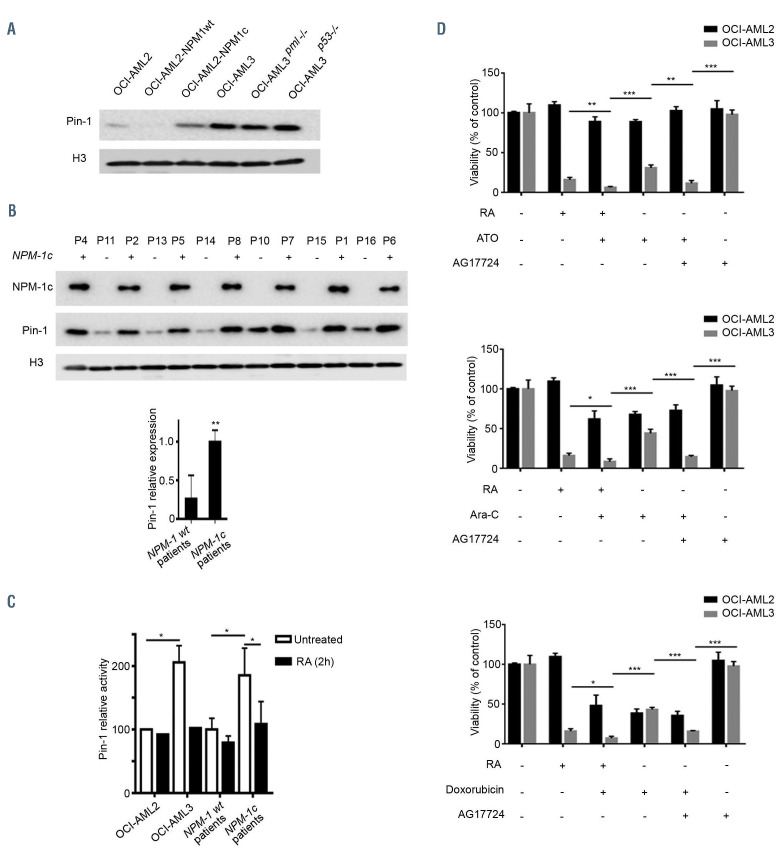
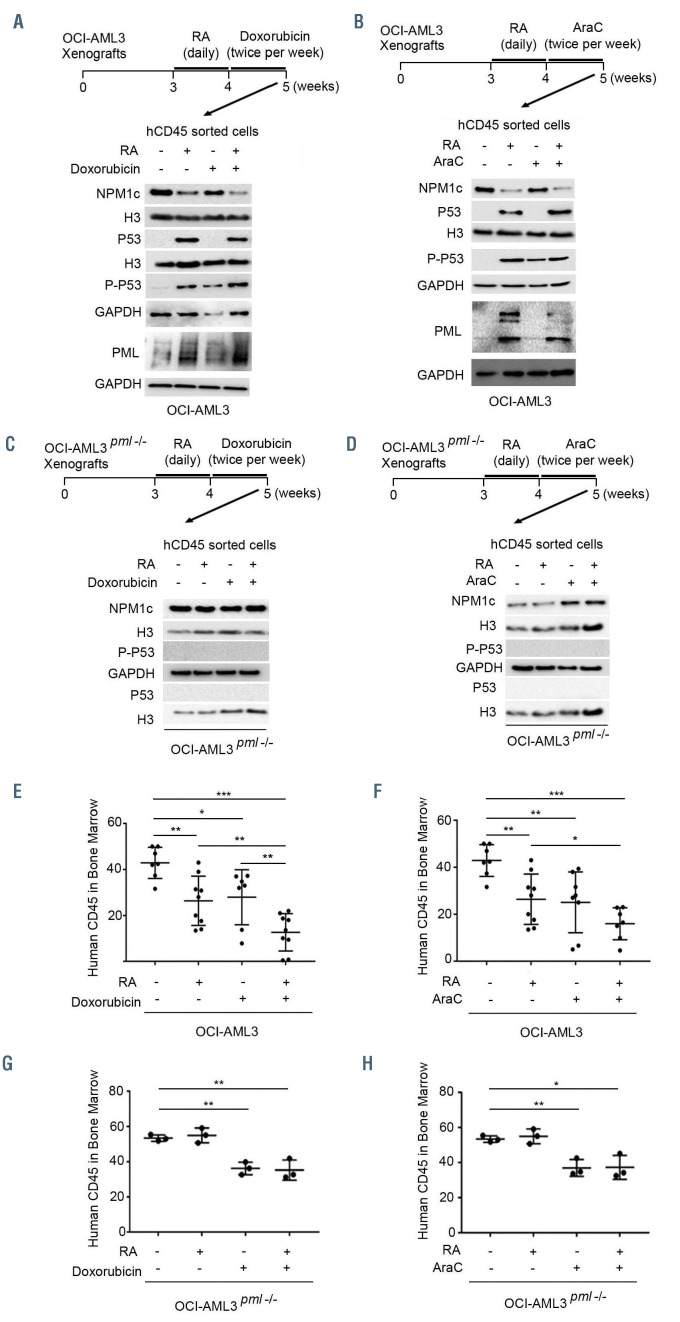
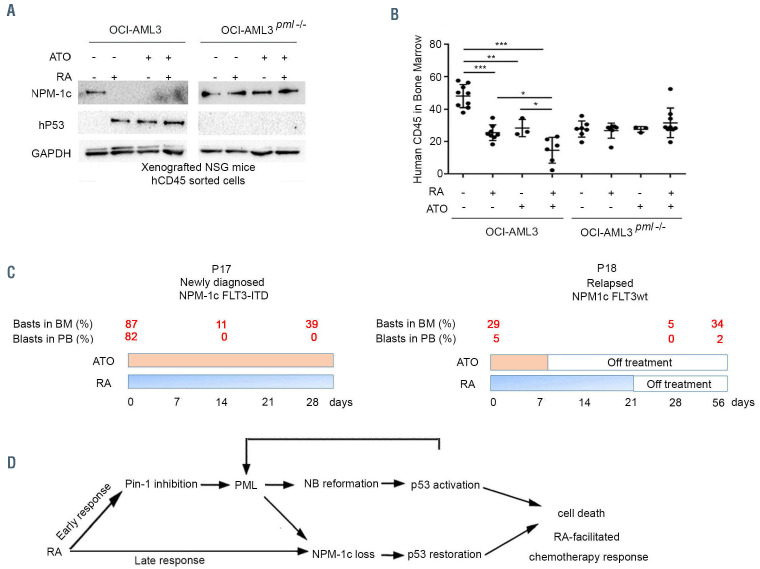
Retinoic acid (RA) was proposed to increase survival of chemotherapy- treated patients with nucleophosmin-1 (NPM-1c)-mutated acute myeloid leukemia. We reported that, ex vivo, RA triggers NPM-1c degradation, P53 activation and growth arrest. PML organizes domains that control senescence or proteolysis. Here, we demonstrate that PML is required to initiate RA-driven NPM-1c degradation, P53 activation and cell death. Mechanistically, RA enhances PML basal expression through inhibition of activated Pin1, prior to NPM-1c degradation. Such PML induction drives P53 activation, favoring blast response to chemotherapy or arsenic in vivo. This RA/PML/P53 cascade could mechanistically explain RA-facilitated chemotherapy response in patients with NPM-1c mutated acute myeloid leukemia.


Figures

Figure 1.
Figure 1.
PML-dependent NPM-1c degradation and P53 activation. (A) Western blot analysis of PML, P53 and NPM-1c was performed on extracts of OCIAML3, one clone of OCI-AML3pml-/- (OCI-AML3pml-/-#1) and one clone of OCI-AML3P53-/- (OCI-AML3P53-/-#1) after treatment with retinoic acid (RA) for 48 h. Densitometry histograms represent data from an average of five independent experiments. Densitometry was performed using ImageJ software. Statistical analysis was done using a Student t-test. (B) Cell growth (percent of control) was assessed using the trypan blue exclusion dye assay, in triplicate wells in OCI-AML3, one clone of OCIAML3pml-/- (OCI-AML3pml-/-#1) and one clone of OCIAML3P53-/- (OCI-AML3P53-/-#1) following treatment with RA for 48 h (n=3). (C) Western blot analysis of P53 and NPM-1c in OCI-AML3 and OCI-AML3pml-/- after treatment with RA for 2, 12 and 24 h as indicated. Densitometry histograms represent data from an average of three independent experiments. Densitometry was performed using ImageJ software. Statistical analysis was done using a Student t-test. (D) Western blot analysis of NPM-1c and P53 in primary blasts derived from five patients with NPM-1c acute myeloid leukemia (AML) and three NPM-1wt AML patients, after ex-vivo treatment with RA for 2 h. Densitometry histograms represent average P53 and NPM-1c expression levels in five NPM- 1c AML patients and three NPM-1wt AML patients. Densitometry was performed using ImageJ software. Statistical analysis was done using a Student t-test. (E) Western blot analysis of NPM-1c and P53 in primary blasts derived from five NPM-1c AML patients and three NPM-1wt AML patients, after exvivo treatment with RA for 48 h. Densitometry histograms represent average P53 and NPM-1c expression levels in five NPM-1c AML patients and three NPM-1wt AML patients. Densitometry was performed using ImageJ software. Statistical analysis was done using a Student t-test, *P<0.05; **P<0.01; ***P<0.001.
Figure 2.
Figure 2.
Retinoic acid targets PML/P53 through Pin1 inactivation. (A) Confocal microscopy of PML-nuclear bodies (NB) in primary blasts derived from one representative acute myeloid leukemia (AML) patient with wild-type (wt) NPM-1 and one representative AML patient with mutated NPM-1c, after ex-vivo treatment with retinoic acid (RA) or AF-17724 for 2 h as indicated. Histograms represente average number of PML NB per cell in two patients with NPM-1 wt and two patients with mutated NPM-1c. Statistical analysis was done using a Student t-test. (B) Western blot analysis of PML, P53 and total NPM-1 (NPM1-wt) in primary blasts derived from three patients with NPM-1c AML and three patients with NPM-1 wt AML, after ex-vivo treatment with 20 mM of AG17724 or 1 mM of RA for 2 h as indicated. (C) Western blot of PML and P53 in OCI-AML3 and OCI-AML2 cells following treatment with 20 mM of AG17724 for 2 h. Densitometry histograms represent an average of three independent experiments. (D) Colony-formation assays in methylcellulose of OCI-AML3, and OCI-AML3 Pin1-knock down (KD) cells, pre-treated with RA or AG17724 for 3 h (n=3). (E) Western blot analysis of PML, P53, P21, or Pin1 in OCI-AML3 and OCI-AML3 Pin1-KD after treatment with 1 mM of RA for 2 h. Densitometry histograms represent an average of three independent experiments. Densitometry was performed using ImageJ software. Statistical analysis was done using a Student t-test. (F) Western blot analysis of PML and P53 in OCI-AML3, OCI-AML3pml-/- and OCI-AML3P53-/- cells after treatment with 20 mM of AG17724 or 1 mM of RA for 2 h as indicated. Densitometry histograms represent an average of three independent experiments. Densitometry was performed using ImageJ software. Statistical analysis was done using a Student t-test, *P<0.05; **P<0.01; ***P<0.001.
Figure 3.
Figure 3.
NPM-1c-expressing cells exhibit high Pin1 level and activity. (A) Western blot analysis of Pin1 in OCI-AML2, OCI-AML2-NPM-1wt, OCI-AML2-NPM-1c, OCIAML3, OCI-AML3pml-/- and OCI-AML3P53-/-. (B) Western blot analysis of NPM-1c and Pin1 in primary blasts derived from seven patients with acute myeloid leukemia (AML) with NPM-1c (p4, p2, p5, p8, p7, p1 and p6) and six AML patients with wild-type NPM-1 (NPM-1 wt) (p11, p13, p14, p10, p15 and p16). Densitometry histograms represent an average of Pin1 expression level in the seven tested NPM-1c AML patients and the six tested NPM-1 wt AML patients. Densitometry was performed using ImageJ software. Statistical analysis was done using a Student t-test. (C) Pin1 relative activity in OCI-AML2, OCI-AML3 and in primary blasts derived from three NPM-1c AML patients and two NPM-1 wt AML patients after treatment with 1 mM of RA, as indicated. Statistical analysis was done using a Student t-test. (D) Cell growth (percent of control) was assessed using the trypan blue exclusion dye assay in OCI-AML2 and OCI-AML3 cells following treatment with RA alone, AG-17724 alone or their combination with arsenic trioxide (ATO), cytarabine (Ara-C) and doxorubicin for 72 h as indicated (n=3). Statistical analysis was done using a Student t-test, *P<0.05; **P<0.01; ***P<0.001.
Figure 4.
Figure 4.
Retinoic acid and chemotherapy cooperate to clear NPM-1c-expressing cells in vivo. (A, B) Eight-week-old NSG mice were injected with 2x10⁶ OCIAML3 cells intravenously. At day 21 after injection of the leukemic cells, retinoic acid (RA) was administered on a daily basis at the dose of 2.5 mg/g over a period of 1 week, followed by the administration of doxorubicin (2 mg/g) or cytarabine (AraC) (60 mg/g) twice a week over a period of 1 week. Mice were sacrificed, Bone marrow was harvested from femura and tibiae of xenografted mice and then stained with anti-human CD45 (hCD45) antibody. Western blot of NPM-1c, human P53, human P-P53 and PML in sorted hCD45-positive cells from BM harvested from untreated or treated NSG xenografted mice as indicated (2 mice per condition). (C, D) Eight-weekold NSG mice were intravenously injected with 2x10⁶ OCI-AML3pml-/- cells. The same treatment regimen was followed as indicated above. Western blot of NPM-1c, human P53 and P-P53 in sorted hCD45-positive cells from bone marrow harvested from untreated or treated NSG xenografted mice as indicated. (E, F) Graphs showing the percentage of hCD45 cells in OCI-AML3 xenografted NSG mice treated as described above (7 mice in the untreated group and in the groups treated with doxorubicin alone or RA in combination with cytarabine [AraC], 9 mice in the group treated with RA alone or doxorubicin and RA, 8 mice in the group treated with cytarabine alone). (G, H) Graphs showing the percentage of hCD45 cells in OCI-AML3pml-/- xenografted NSG animals treated as described above (3 mice in each condition).
Figure 5.
Figure 5.
Retinoic acid and arsenic cooperate to clear NPM-1c-expressing cells. (A) Eight-week-old NSG mice were injected with 3x10⁶ OCI-AML3 or OCI-AML3pml-/- cells intravenously. From day 7 after injection of the leukemic cells, arsenic trioxide (ATO, 5 mg/g/day) and retinoic acid (RA, 2.5 mg/g) were administered intraperitoneally every other day, over a period of 4 weeks. Western blot of human P53 and NPM-1c in sorted hCD45 positive bone marrow (BM) cells from NSG mice xenografted with OCI-AML3 or OCI-AML3pml-/- cells, after in vivo treatment with ATO alone, RA alone or the combination of RA and ATO. (B) Eight-week-old NSG mice were injected with 3x10⁶ OCI-AML3 or OCI-AML3pml-/- cells intravenously. From day 7 after injection of the leukemic cells, ATO and RA were administered every other day, over a period of 4 weeks intraperitoneally. At the end of treatment, bone marrow was harvested from femora and tibiae of xenografted mice and then stained with anti-hCD45 antibody. Graphs show the percentage of hCD45 cells in xenografted animals. (C) Treatment schedule in two patients with NPM-1c mutated acute myeloid leukemia (AML) treated with RA and ATO as indicated. Percentages of peripheral blood (PB) and bone marrow (BM) blasts are displayed. (D) Proposed model of the molecular mechanisms of the response of NPM-1c AML to RA. ITD: internal tandem duplication; NB: nuclear body.

Comment in

Similar articles

Cited by

References

    1. Grisendi S, Mecucci C, Falini B, Pandolfi PP. Nucleophosmin and cancer. Nat Rev Cancer. 2006;6(7):493-505. - PubMed
    1. Falini B, Nicoletti I, Martelli MF, Mecucci C. Acute myeloid leukemia carrying cytoplasmic/ mutated nucleophosmin (NPMc+ AML): biologic and clinical features. Blood. 2007;109(3):874-885. - PubMed
    1. Heath EM, Chan SM, Minden MD, Murphy T, Shlush LI, Schimmer AD. Biological and clinical consequences of NPM1 mutations in AML. Leukemia. 2017;31(4):798-807. - PubMed
    1. Kunchala P, Kuravi S, Jensen R, McGuirk J, Balusu R. When the good go bad: mutant NPM1 in acute myeloid leukemia. Blood Rev. 2018;32(3):167-183. - PubMed
    1. Wei S, Kozono S, Kats L, et al. . Active Pin1 is a key target of all-trans retinoic acid in acute promyelocytic leukemia and breast cancer. Nat Med. 2015;21(5):457-466. - PMC - PubMed

MeSH terms