. 2021 Aug;599(15):3677-3696.
doi: 10.1113/JP281646. Epub 2021 Jul 9.

Sensory adaptation at ribbon synapses in the zebrafish lateral line

Affiliations

Sensory adaptation at ribbon synapses in the zebrafish lateral line

Francesca De Faveri et al. J Physiol. 2021 Aug.

Abstract

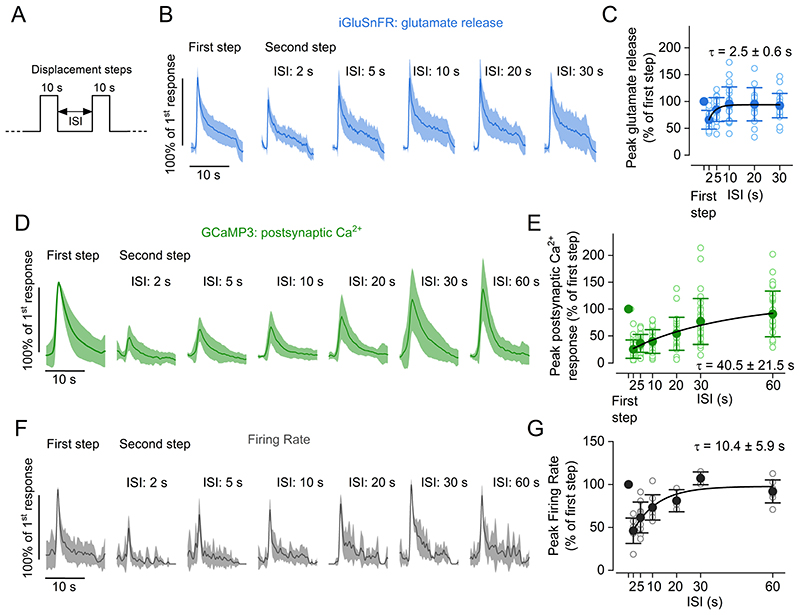
Key points: The present study aimed to determine the sensory adaptation characteristics of hair cell ribbon synapses in vivo. Hair cells of the zebrafish lateral line transmit hydrodynamic stimuli to the posterior lateral line ganglion afferent neurons. Excitatory hair bundle deflections by water-jet stimuli cause glutamate release at hair cell synapses with a rapid (phasic) and a sustained component, which are likely linked to the exocytosis of distinct vesicle pools. The glutamate-induced increase in afferent neuron firing rate adapts over time, which is mirrored by the depression of neurotransmitter release, without preventing phase-locking. Adaptation also occurs during inhibitory hair bundle displacements, highlighting a shift in the sensitivity range of the lateral line during prolonged stimulation. Postsynaptic mechanisms exert some degree of regulation on the afferent firing adaptation. We conclude that vesicle depletion is the primary determinant of firing rate adaptation, allowing lateral line hair cell ribbon synapses to maintain sensitivity to sustained stimuli.

Abstract: Adaptation is used by sensory systems to adjust continuously their sensitivity to match changes in environmental stimuli. In the auditory and vestibular systems, the release properties of glutamate-containing vesicles at the hair cell ribbon synapses play a crucial role in sensory adaptation, thus shaping the neural response to sustained stimulation. How ribbon synapses regulate the release of glutamate and how they modulate afferent responses in vivo is still largely unknown. Here, we have used two-photon imaging and electrophysiology to investigate the synaptic transfer characteristics of the hair cells in the context of sensory adaptation in live zebrafish. Prolonged and repeated water-jet stimulation of the hair cell stereociliary bundles caused adaptation of the action potential firing rate elicited in the afferent neurons. By monitoring glutamate at ribbon synapses using time-lapse imaging, we identified two kinetically distinct release components: a rapid response that was exhausted within 50-100 ms and a slower and sustained response lasting the entire stimulation. After repeated stimulations, the recovery of the fast component followed a biphasic time course. Depression of glutamate release was largely responsible for the rapid firing rate adaptation recorded in the afferent neurons. However, postsynaptic Ca2+ responses had a slower recovery time course compared to that of glutamate release, indicating that they are likely to contribute to the afferent firing adaptation. Hair cells also exhibited a form of adaptation during inhibitory bundle stimulations. We conclude that hair cells have optimised their synaptic machinery to encode prolonged stimuli and to maintain their sensitivity to new incoming stimuli.

Keywords: adaptation; hair cells; in vivo physiology; synaptic release; vesicle pools; zebrafish lateral line.


Conflict of interest statement

Competing interests:

The Authors declare no conflict of interest.

Figures

Figure 1
Figure 1. Firing rate adaptation in the afferent neurons during stimulation of individual neuromasts
A, Left: schematic overview of the experiment showing the tip of the fluid jet pipette stimulating the zebrafish neuromast L1 while performing loose-patch electrophysiological recordings from the posterior lateral line ganglion (PLLg). Centre: bright-field image of the PLLg, with the recording patch clamp pipette highlighted. Scale bar: 30 μm. Right: piezo-driven fluid jet displacing the cupula of a neuromast, which contains the hair bundles of the hair cells, with saturating stimuli along the anteroposterior axis of the zebrafish. Scale bar: 30 μm. B, Action potential activity from a PLLg afferent neuron while displacing the cupula of a connected neuromast with a 10 s step stimulus (drive voltage to the piezoelectric actuator is shown above the trace). Note the increased firing rate at the onset of the excitatory stimulus and its subsequent adaptation. C, Raster plot of individual afferent neuron activity during the excitatory displacement of the cupula (top: driving voltage, V). The firing rate is normalised to the peak of the firing activity (32 neurons, 29 zebrafish) and was calculated by convolving the spike train with a gaussian kernel (σ = 200 ms). D, Average normalised firing rate of the 32 recordings (solid trace: mean; shaded area: S.D.) during the step displacement (top). E, Average normalised firing rate values. Open circles represent individual recordings. Baseline: average firing rate over at least 30 s before the stimulation. Peak: maximum firing rate in the first 2 s of the stimulus. Steady State: average firing rate during the last 5 s of the stimulus. The baseline firing rate ranged from 0.1 spikes/s to 4.8 spikes/s (median: 1.8 spikes/s, mean: 2.2 spikes/s, 17.7 ± 12.6 % of the peak), while the peak ranged from 4.7 spikes/s to 56.7 spikes/s (median: 12.1 spikes/s, mean: 16.1 spikes/s). The steady state firing rate ranged from 0.0 spikes/s to 9.2 spikes/s (median: 1.9 spikes/s, mean: 2.5 spikes/s, 19.0 ± 16.4% of the peak; P < 0.0001, one-way ANOVA, 32 neurons, 29 zebrafish). Pairwise comparison revealed the peak was significantly different from the baseline (P < 0.0001) and from the steady state (P < 0.0001), while the steady state was not significantly different from the baseline (P > 0.9999, paired t tests with Bonferroni-adjusted P values).
Figure 2
Figure 2. Synaptic responses to prolonged step stimuli in lateral line hair cells
A, Maximal projection image of a neuromast expressing the fluorescent Ca2+ reporter GCaMP7a in hair cells. Scale bar: 10 μm. B, Average Ca2+ changes in hair cells measured as changes in GCaMP7a fluorescence emission. Hair cell bundles were deflected by a 10 s saturating stimulus in the excitatory direction. C, Presynaptic Ca2+ changes normalised to the maximum GCaMP7a ΔF/F0 obtained during the first 2 s of the stimulus (Peak). Baseline: average ΔF/F0 before stimulation. Steady State: average ΔF/F0 in the last 5 s of the stimulus. 39 hair cells, 18 neuromasts, 4 zebrafish. D, Maximal projection image of a neuromast expressing the fluorescent glutamate reporter iGluSnFR in hair cells. Scale bar: 10 μm. E, Average traces displaying the time course of glutamate release from the hair cells detected by iGluSnFR during the 10 s stimulus. F, Glutamate release normalised to the Peak of the responses. Baseline, Steady State and Peak are computed as in panel B. 21 hair cells, 15 neuromasts, 7 zebrafish. G, Maximal projection image of a neuromast expressing the fluorescent Ca2+ reporter GCaMP3 in postsynaptic terminals. Scale bar: 10 μm. H, Average postsynaptic Ca2+ responses measured as changes in GCaMP3 fluorescence during the excitatory bundle displacement. I, Postsynaptic Ca2+ responses normalised to the Peak of the response. Baseline, Steady State and Peak are computed as in panel C. 33 afferent terminals, 17 neuromasts, 5 zebrafish. In panels B, E and H, solid traces represent the mean values and the shaded area the S.D. Open symbols in panels C, F and I represent individual recordings.
Figure 3
Figure 3. The kinetics of glutamate release indicate the presence of two vesicle pools in hair cells
A, Average traces displaying the time course of glutamate release in hair cells detected as changes in iGluSnFR fluorescence emission during fluid jet stimulation with steps of increasing duration, which is indicated below each trace. Number of hair cells from left to right: 14, 15, 14, 13, 16, 16, 16, 17,17, 11 (18 neuromasts; 10 zebrafish). Solid line: mean data; shaded area: S.D.. B, Peak glutamate release as a function of step duration. C, Expanded view of peak glutamate release from panel B (first 100 ms). The peak glutamate release was fitted by a single exponential with τ = 19 ± 2 ms. D, Time integral of iGluSnFR fluorescence traces, indicating the total glutamate release as a function of step duration. E, F, Expanded view of integrated glutamate release for step durations up to 100 ms (E, exponential fit: τ = 26 ± 4 ms) and between 200 ms and 3000 ms (F, exponential fit: τ = 1.5 ± 0.5 s). G, Average GCaMP7a responses in hair cells to stimuli of indicated duration. Number of hair cells from left to right: 10, 14, 15, 15, 15, 15 (18 hair cells, 13 neuromasts, 5 zebrafish). Solid line: mean data; shaded area: S.D. H, Peak presynaptic Ca2+ response as a function of step duration. I, Integrated glutamate release as a function of peak Ca2+ response. Pooled data from panels F and H. Data were fitted with equation: y = A · xn + C returned a coefficient n = 0.967 ± 0.255, indicating a quasi-linear dependence between neurotransmitter release and Ca2+ influx. For the individual recordings used to calculate the averages shown in panels B-F, H and I, see Supplementary Data Set.
Figure 4
Figure 4. RRP depletion and replenishment in hair cells
A, Schematic representation of the stimulus protocol used to displace the cupula of the neuromasts towards the excitatory direction. Step displacements of 50 ms in duration, which saturated the fast glutamate response, were delivered with varying interstep intervals (ISIs). B, Average iGluSnFR responses to a train of steps with different ISIs. Traces are normalised to the peak response of the first step. Note that for longer ISIs (3000 ms and 10000 ms) image acquisition was interrupted in-between steps to limit photobleaching. C, Deconvolved glutamate responses to paired pulses for different ISIs (see Materials and Methods). Individual traces were normalised to the amplitude of the response elicited by the first displacement step. In panels B and C: solid lines indicate mean value and shaded area the S.D. D, Glutamate release (normalised peak) plotted as a function of pressure step number for the ISIs indicated on the right. E, Time course of RRP replenishment. Peak glutamate release measured at the second displacement step as a function of ISI. The individual data points were fitted with a double exponential function: y=y0+A1(1exτfas)+A2(1exτslo), with A 2 = (1 − y 0A 1). Number of hair cells: 10 (50 and 100 ms), 11 (400 ms), 12 (200 ms, 1 and 10 s), 15 (3 s). 33 neuromasts from 16 zebrafish. For the individual recordings used to calculate the averages shown in panels D and E, see Supplementary Data Set.
Figure 5
Figure 5. Adaptation of glutamate release in hair cells during periodic stimuli
A, Schematic representation showing the 10 s-long sinewave stimulus used to displace the cupula of the neuromasts with the fluid jet. The frequency of the sinewave stimulus used was: 1, 2, 5, 20, 50, 100 and 200 Hz. B, Average iGluSnFR responses (solid line: mean, shaded area: S.D.) recorded in lateral line hair cells using a sine-wave stimulus with the above frequencies. To compare responses to different frequencies, fluorescence traces were normalised to the peak of the response to 1 Hz stimulation. Responses from hair cells with different direction of sensitivity were aligned by shifting the response to one direction by half of the period of the stimulation. C, Maximum glutamate release as a function of the stimulation frequency from 1 Hz to 20 Hz. This analysis was limited to lower frequencies as it was not possible to reliably obtain deconvolved responses from higher frequency stimulations. Responses are normalised to the peak of the response to 1 Hz stimulation. D, Peak glutamate release at each stimulation cycle, as a function of time. The frequency of the stimulus is indicated on the right. Traces are normalised to the peak for each stimulation frequency. The time course of glutamate release could be fitted by a single exponential function at 1 and 2 Hz (1 Hz: τ = 1.4 ± 0.1 s; 2 Hz: τ = 1.0 ± 0.1 s) and a double exponential function at 5 and 20 Hz (5 Hz: τfast = 0.1 ± 0.01 s, τslow = 1.5 ± 0.1 s; 20 Hz: τfast = 0.04 ± 0.01 s, τslow = 1.0 ± 0.1 s). E, Steady state glutamate release as a function of stimulation frequency. Glutamate responses in panels C-E were computed by deconvolution of the iGluSnFR fluorescence traces as indicated in Fig. 4 (see also Materials and Methods) and normalised to the maximum response. Number of hair cells: 57 (1 Hz), 17 (2 Hz), 28 (5 Hz), 19 (20 Hz), 21 (50 Hz), 20 (100 Hz), 11 (200 Hz). 56 neuromasts from 18 zebrafish. For the individual recordings used to calculate the averages shown in panels D and E, see Supplementary Data Set.
Figure 6
Figure 6. Firing rate adaptation in PLLg neurons during periodic stimuli
A, Representative recordings of firing activity from a PLLg neuron during the stimulation of the cupula with a sinewave at 1 Hz (top) and 100 Hz (bottom). B, Raster plot of individual afferent neuron activity during the application of 10 s stimuli. The stimulation frequency is indicated on the left. The firing rate was calculated by convolving the spike train with a gaussian kernel (σ = 5 ms). Of the 11 afferent neuron recordings, 1 showed no firing activity after the initial peak for all the frequencies tested. C, Average firing rate (solid trace: mean; shaded area: S.D.) of PLLg afferent neurons during the application of periodic stimuli in the excitatory direction to a connected neuromast. Traces are normalised to the peak of the response to 1 Hz. D, Peak firing rate during the first excitatory half cycle (grey symbols) and during the entire stimulation (black symbols). Responses are normalised to the peak of the response to 1 Hz stimulation. E, Steady state firing rate as a function of stimulation frequency. Responses are normalised to the peak for each stimulation frequency. The steady state was calculated as the peak firing rate during the last stimulation cycle for frequencies below 5 Hz included, and as the average firing rate in the last 500 ms of stimulation for frequencies higher than 5 Hz. F, Vector strength values as a function of stimulation frequency. Values were computed in two 3 s-long time windows at the beginning (grey symbols) and at the end (black symbols) of the stimulation. Note that a subset of the recordings, for which it was not possible to calculate the final vector strength due to the low number of spikes in the last 3 seconds of stimulation, were not included in this analysis. Number of neurons from left to right (excluded neurons in parentheses): 10 (1), 8 (1), 8 (1), 6 (2), 7 (1), 5 (2), 7 (1), from 7 zebrafish. For the individual recordings used to calculate the averages shown in panel D, see Supplementary Data Set
Figure 7
Figure 7. Differential pre- and post-synaptic recovery from adaptation
A, Schematic representation of the experimental protocol used to measure the time course of the recovery from adaptation of pre- and postsynaptic responses following two 10 s displacement steps with varying interstep intervals (ISIs). B, Average glutamate release detected as iGluSnFR fluorescence changes in hair cells. C, Peak of response to second step relative to response to first step at different ISIs. The solid line represents an exponential fit to the data. Number of hair cells: 17 (2 and 5 s), 23 (10 s), 16 (20 s), 23 (30 s); 25 neuromasts from 15 zebrafish. D, Average postsynaptic Ca2+ responses measured in zebrafish expressing GCaMP3 panneuronally. E, Peak amplitude of response to second step relative to response to first step at different ISIs. Open symbols represent individual recordings and filled symbols denote average values. The solid line represents an exponential fit to the data. Number of afferent terminals: 29 (2 s), 31(5 s), 33 (10 s), 25 (20 s), 35 (30 s), 29 (60 s); 33 neuromasts from 10 zebrafish. F, Average normalised firing rate of afferent neurons. G, Average firing rate during second step relative to first step at different ISIs. The solid line represents an exponential fit to the data. Number of neurons: 7 (2 s), 9 (5 s), 8 (10 s), 3 (20 s), 3 (30 s), 7 (30 s) from 18 zebrafish. In panels B, D and F, responses are normalised to the maximum amplitude of the first step responses at indicated ISIs. Solid traces represent the mean values and the shaded area the S.D.. In panels C, E and G, filled and open symbols denote average values and individual recordings, respectively. Solid lines represent a fit to the data with the function y=y0+A(1exτ).
Figure 8
Figure 8. Pre- and postsynaptic responses to inhibitory cupula displacement
A, Average time course of iGluSnFR responses to two consecutive saturating stimuli (duration: 3s) in opposite directions (excitatory and inhibitory) from 26 hair cells (23 neuromasts, 15 zebrafish). Top trace: fluid jet driving voltage. B, Glutamate release at three different time points of the stimulus. Values are normalised to the maximum response calculated during the first 2 s of the stimulus (Peak). Baseline : average ΔF/F0 before stimulation. Inhibitory: minimum ΔF/F0 during the inhibitory step. Return to rest: maximum ΔF/Fo in the 3 s after the termination of the inhibitory stimulation. The return to rest response was visible in the majority of hair cells tested (26 out of 28 hair cells). C, Average trace of postsynaptic Ca2+ responses to two 3 s saturating stimuli in opposite directions (excitatory and inhibitory) detected as change in GCaMP3 fluorescence emission from 143 afferent terminals (69 neuromasts, 35 zebrafish). D, Postsynaptic Ca2+ responses during the delivery of the stimulus. Values are normalised to the maximum response calculated during the first 2 s of the stimulus (Peak). Baseline, Inhibitory and Return to rest were calculated as in panel B. E, Representative electrophysiological recording from one afferent neuron while stimulating a connected neuromast. Note the increase in firing rate both for the positive (excitatory) pressure stimulus and at the return to rest from the negative (inhibitory) stimulus. F, Raster plot of individual afferent neuron activity during the application of two 3 s saturating stimuli in opposite directions. The firing rate is normalised to the peak of the firing activity during the excitatory step and was calculated by convolving the spike train with a gaussian kernel (σ = 200 ms). G, Quantification of PLLg neuron activity during the delivery of the stimulus (32 neurons, 16 zebrafish.). Values are normalised to the maximum response calculated during the first 2 s of the stimulus (Peak). Baseline, Inhibitory and Return to rest were calculated as in panel B. In panel A and C, solid traces represent mean and shaded areas S.D. In panels B, D and G, filled symbols denote average values and open symbols represent individual recordings.
Figure 9
Figure 9. Ca2+ responses to inhibitory cupula displacement in apical and basal hair cell compartments
A, Maximal projection images of a neuromast expressing the fluorescent Ca2+ reporter GCaMP7a in hair cells. Two focal planes are shown: the hair cell apical pole (left), where fluorescence signals largely reflect Ca2+ entry through the MET channels; hair cell basal pole (right), where fluorescence signals reflect Ca2+ entry through voltage-gated Ca2+ channels. Scale bar: 10 μm. B, Average time course of intracellular Ca2+ in hair cells measured as change in GCaMP7a fluorescence at the hair cell apical pole (142 hair cells, 28 neuromasts, 8 zebrafish). Two 3 s saturating stimuli in the excitatory (left) and inhibitory (right) directions were delivered. Note the negative deflection of intracellular Ca2+ concentration during the negative step, followed by a slow increase above baseline levels upon return to rest. C, Ca2+ changes in the hair cell apical pole during the delivery of the excitatory and inhibitory stimuli. Values are normalised to the maximum GCaMP7a signal during the excitatory step. Baseline: average ΔF/F0 before stimulation. Inhibitory: minimum ΔF/F0 during the inhibitory step. Return to rest: maximum of the response in the 12 seconds after the termination of the inhibitory stimulation. The return to rest response was visible in the majority of hair cells tested (142 out of 152 hair cells). D, E same as in B and C, but Ca2+ responses were measured at the hair cell basal (synaptic) pole (28 hair cells, 9 neuromasts, 3 zebrafish). The inhibitory displacement of the cupula caused a reduction in Ca2+ concentration, followed by a positive “rebound” upon returning to the rest position. The return to rest response was visible in 28 out 45 hair cells. The top traces in panels B and D represent the fluid jet driving voltage. In panels B and D, the mean values and the shaded area the S.D. In panels C and E: open symbols represent individual recordings; filled symbols denote average values.

Similar articles

Cited by

References

    1. Assad JA, Hacohen N, Corey DP. Voltage dependence of adaptation and active bundle movement in bullfrog saccular hair cells. Proc Natl Acad Sci USA. 1989;86:2918–2922. - PMC - PubMed
    1. Bergmann K, Santoscoy PM, Lygdas K, Nikolaeva Y, MacDonald RB, Cunliffe VT, Nikolaev A. Imaging Neuronal Activity in the Optic Tectum of Late Stage Larval Zebrafish. J Dev Biol. 2018;6:6. - PMC - PubMed
    1. Beutner D, Moser T. The Presynaptic Function of Mouse Cochlear Inner Hair Cells During Development of Hearing. J Neurosci. 2001;21:4593–4599. - PMC - PubMed
    1. Carlton AJ, Halford J, Underhill A, Jeng JY, Avenarius MR, Gilbert ML, Ceriani F, Ebisine K, Brown SDM, Bowl MR, Barr-Gillespie PG, et al. Loss of Baiap2l2 destabilizes the transducing stereocilia of cochlear hair cells and leads to deafness. J Physiol. 2021;599:1173–1198. - PMC - PubMed
    1. Ceriani F, Hendry A, Jeng JY, Johnson SL, Stephani F, Olt J, Holley MC, Mammano F, Engel J, Kros CJ, Simmons DD, et al. Coordinated calcium signalling in cochlear sensory and non-sensory cells refines afferent innervation of outer hair cells. EMBO J. 2019;38:e99839. - PMC - PubMed

Publication types

LinkOut - more resources