

COMMD10 inhibits tumor progression and induces apoptosis by blocking NF-κB signal and values up BCLC staging in predicting overall survival in hepatocellular carcinoma
- PMID: 34047468
- PMCID: PMC8093973
- DOI: 10.1002/ctm2.403
COMMD10 inhibits tumor progression and induces apoptosis by blocking NF-κB signal and values up BCLC staging in predicting overall survival in hepatocellular carcinoma
Abstract
Background: Hepatocellular carcinoma (HCC) is the third leading cause of cancer mortality worldwide. Currently, there is limited knowledge of dysregulation of cellular proliferation and apoptosis that contribute to the malignant phenotype in HCC. Copper metabolism gene MURR1 domain 10 (COMMD10) is initially identified as a suppressor gene in the pathogenesis of HCC in our observations. Here we aimed to explore its function and prognostic value in the progression of HCC.
Methods: Functional experiments were performed to explore the role of COMMD10 in HCC. The molecular mechanisms of COMMD10 were determined by luciferase assay, immunofluorescence, and immunoprecipitation. The nomogram was based on a retrospective and multicenter study of 516 patients who were pathologically diagnosed with HCC from three Chinese hospitals. The predictive accuracy and discriminative ability of the nomogram were determined by a C-index and calibration curve and were compared with COMMD10 and the Barcelona Clinic Liver Cancer (BCLC) staging system. The primary endpoint was overall survival (OS).
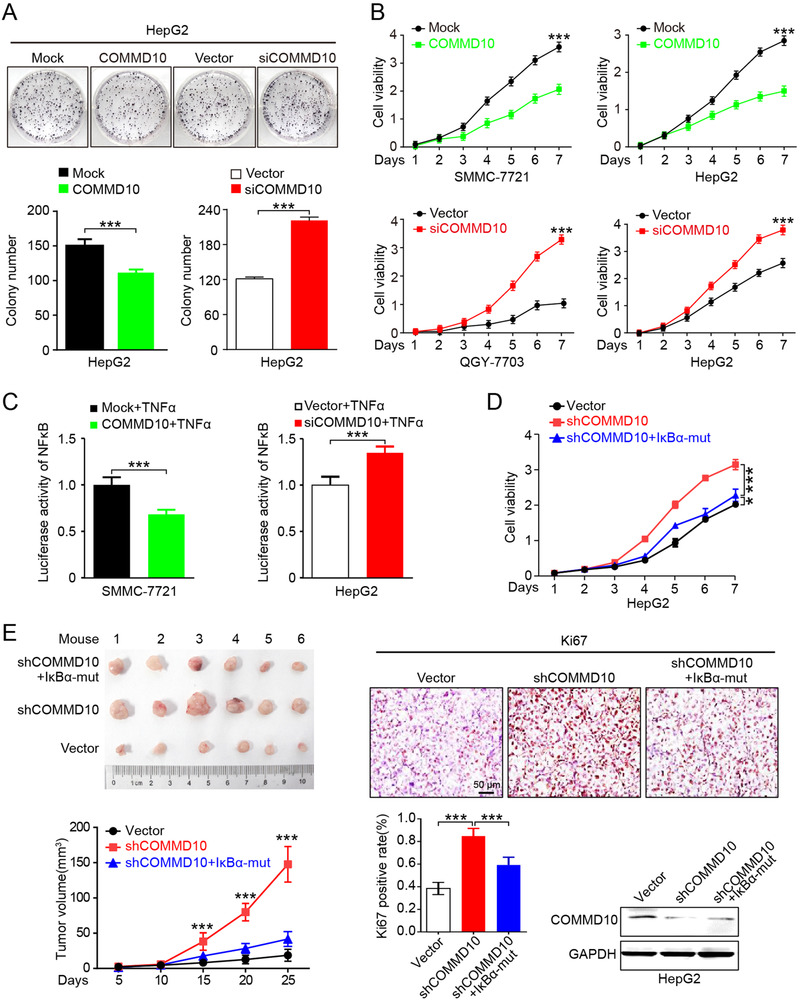
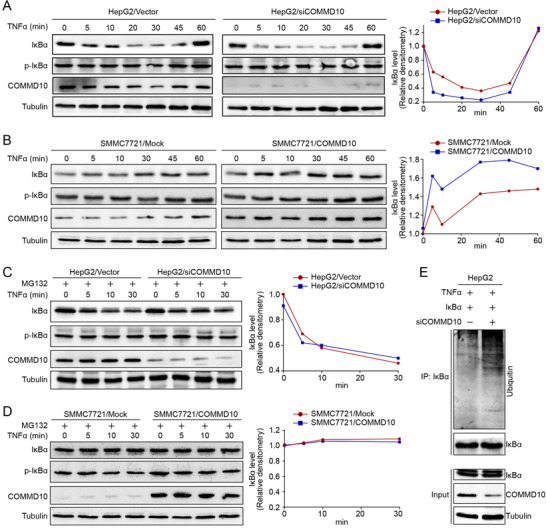
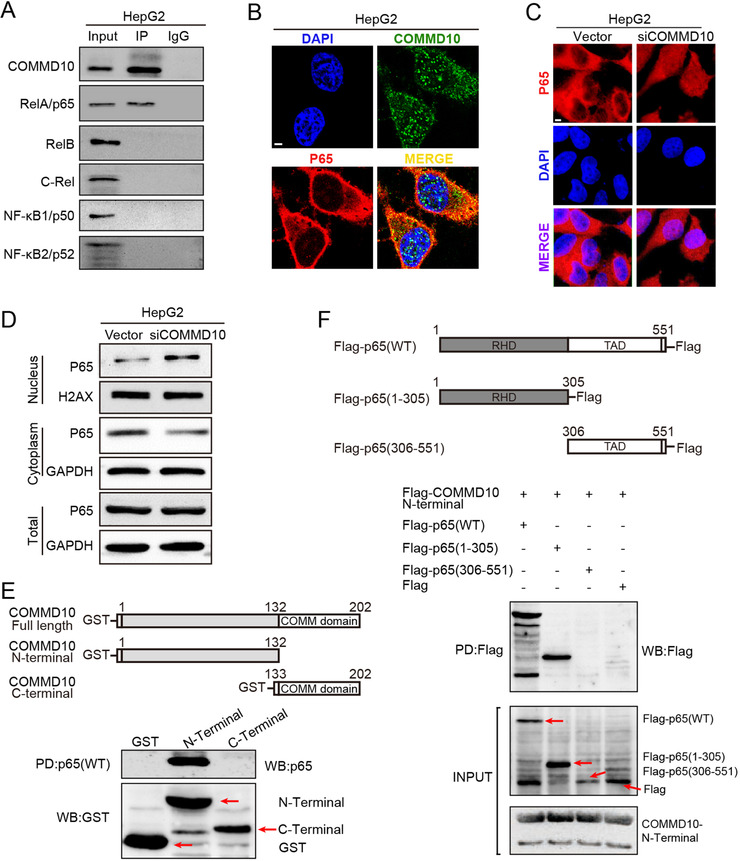
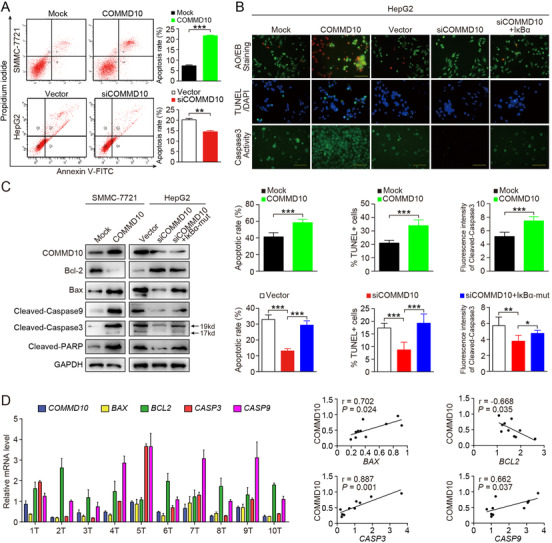
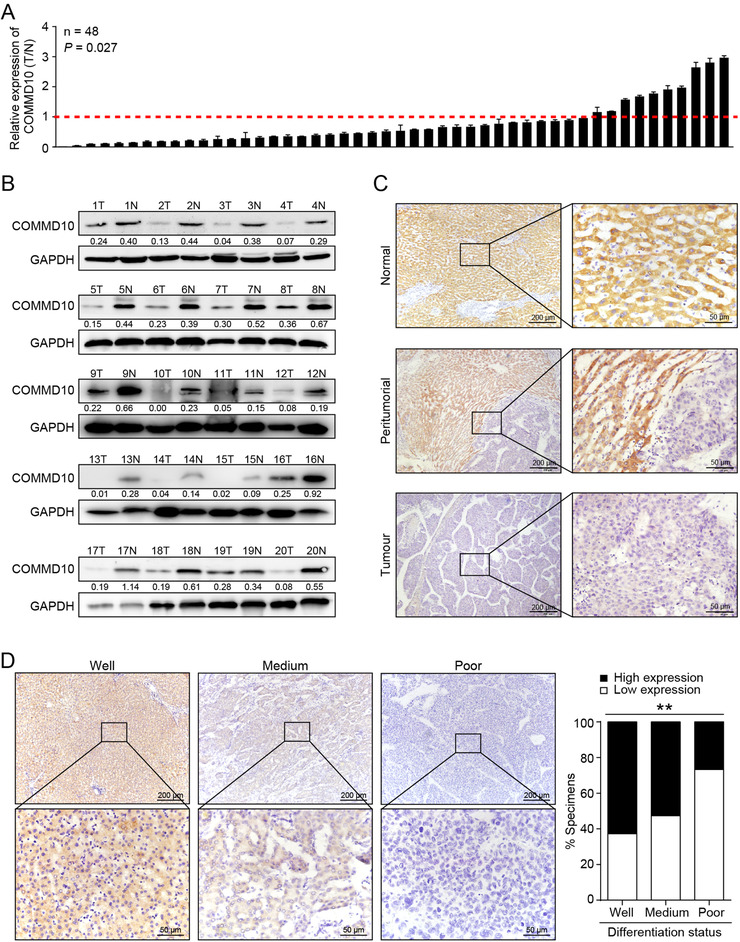
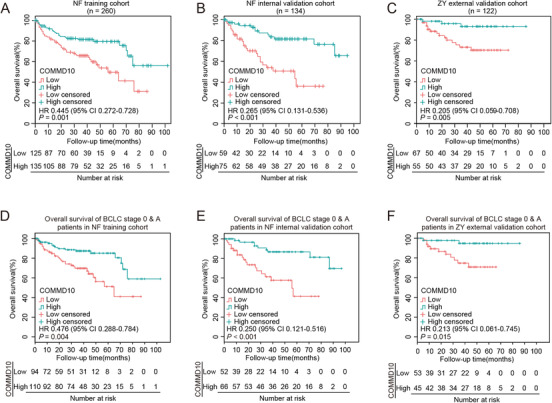
Results: COMMD10 expression was significantly lower in HCC than that in normal liver tissues. In vitro and in vivo experiments revealed that COMMD10 suppressed cell proliferation and induced apoptosis in HCC. Mechanistically, COMMD10 inhibits TNFα mediated ubiquitination of IκBα and p65 nuclear translocation through the combination of COMMD10-N terminal to the Rel homology domain of p65, which inhibited NF-κB activity and increased expression of cleaved caspase9/3 in HCC. Clinically, COMMD10 stratifies early-stage HCC patients into two risk groups with significantly different OS. Additionally, the nomogram based on COMMD10 and BCLC stage yielded more accuracy than BCLC stage alone for predicting OS of HCC patients in three cohorts.
Conclusions: COMMD10 suppresses proliferation and promotes apoptosis by inhibiting NF-κB signaling and values up BCLC staging in predicting OS, which provides evidence for the identification of potential therapeutic targets and the accurate prediction of prognosis for patients with HCC.
Keywords: Barcelona Clinic Liver Cancer (BCLC); copper metabolism MURR1 domain-containing 10 (COMMD10); hepatocellular carcinoma; proliferation and apoptosis.
© 2021 The Authors. Clinical and Translational Medicine published by John Wiley & Sons Australia, Ltd on behalf of Shanghai Institute of Clinical Bioinformatics.
Conflict of interest statement
The authors declare that they have no competing interests.
Figures

Similar articles
-
EYA4 inhibits hepatocellular carcinoma growth and invasion by suppressing NF-κB-dependent RAP1 transactivation.Cancer Commun (Lond). 2018 Apr 3;38(1):9. doi: 10.1186/s40880-018-0276-1. Cancer Commun (Lond). 2018. PMID: 29764501 Free PMC article.
-
COMMD10 inhibits HIF1α/CP loop to enhance ferroptosis and radiosensitivity by disrupting Cu-Fe balance in hepatocellular carcinoma.J Hepatol. 2022 May;76(5):1138-1150. doi: 10.1016/j.jhep.2022.01.009. Epub 2022 Jan 29. J Hepatol. 2022. PMID: 35101526
-
FMNL2 destabilises COMMD10 to activate NF-κB pathway in invasion and metastasis of colorectal cancer.Br J Cancer. 2017 Oct 10;117(8):1164-1175. doi: 10.1038/bjc.2017.260. Epub 2017 Aug 17. Br J Cancer. 2017. PMID: 28817833 Free PMC article.
-
Transarterial chemoembolization in hepatocellular carcinoma treatment: Barcelona clinic liver cancer staging system.World J Gastroenterol. 2015 Sep 28;21(36):10327-35. doi: 10.3748/wjg.v21.i36.10327. World J Gastroenterol. 2015. PMID: 26420959 Free PMC article. Review.
-
Hepatocellular Carcinoma: Molecular Mechanisms and Targeted Therapies.Medicina (Kaunas). 2019 Aug 23;55(9):526. doi: 10.3390/medicina55090526. Medicina (Kaunas). 2019. PMID: 31450841 Free PMC article. Review.
Cited by
-
Comprehensive analysis of COMMD10 as a novel prognostic biomarker for gastric cancer.PeerJ. 2023 Mar 9;11:e14645. doi: 10.7717/peerj.14645. eCollection 2023. PeerJ. 2023. PMID: 36919165 Free PMC article.
-
Vitamin D impedes eosinophil chemotaxis via inhibiting glycolysis-induced CCL26 expression in eosinophilic chronic rhinosinusitis with nasal polyps.Cell Commun Signal. 2025 Feb 21;23(1):104. doi: 10.1186/s12964-025-02078-2. Cell Commun Signal. 2025. PMID: 39985085 Free PMC article.
-
COMMD proteins function and their regulating roles in tumors.Front Oncol. 2023 Jan 23;13:1067234. doi: 10.3389/fonc.2023.1067234. eCollection 2023. Front Oncol. 2023. PMID: 36776284 Free PMC article. Review.
-
COMMD10 inhibited DNA damage to promote the progression of gastric cancer.J Cancer Res Clin Oncol. 2024 Jun 13;150(6):305. doi: 10.1007/s00432-024-05817-z. J Cancer Res Clin Oncol. 2024. PMID: 38871970 Free PMC article.
-
Copper metabolism and cuproptosis: broad perspectives in the treatment of hepatocellular carcinoma.Front Oncol. 2025 Jul 30;15:1555858. doi: 10.3389/fonc.2025.1555858. eCollection 2025. Front Oncol. 2025. PMID: 40809021 Free PMC article. Review.
References
-
- Liang L, Guan J, Zeng Y, et al. Down‐regulation of formin‐like 2 predicts poor prognosis in hepatocellular carcinoma. Hum Pathol. 2011;42:1603–1612. - PubMed
-
- Fan Y, Zhang L, Sun Y, et al. Expression profile and bioinformatics analysis of COMMD10 in BALB/C mice and human. Cancer Gene Ther. 2019;27:216–225. - PubMed
Publication types
MeSH terms
Substances
LinkOut - more resources
Full Text Sources
Other Literature Sources
Medical
Molecular Biology Databases