

doi: 10.1002/ctm2.430.
Identification of potential vaccine targets for COVID-19 by combining single-cell and bulk TCR sequencing
Affiliations
- PMID: 34047471
- PMCID: PMC8140189
- DOI: 10.1002/ctm2.430
Item in Clipboard
Identification of potential vaccine targets for COVID-19 by combining single-cell and bulk TCR sequencing
Clin Transl Med.
2021 May.
No abstract available
Conflict of interest statement
The authors declare no conflict of interest.
Figures

Single cell transcriptome profiling of T cells of patients with COVID‐19 and controls. (A) An overview of experimental design. PBMCs from 16 patients with COVID‐19 were divided to perform scRNA‐seq, scTCR‐seq, deep TCR‐seq and HLA genotyping. (B) UMAP plot of T cells from patients with COVID‐19 and controls. Clustering was based on unsupervised k‐means using the normalized gene expression values after batch effect removal. (C) Bar plots showing the distribution of T cell types in patients with COVID‐19 and healthy controls. (D) Dot plot shows the average log‐normalized gene expression of marker genes for cell types discussed in the main text. The size of the dot represents the percentage of cells that express the gene in each cluster, and the color represents the average level of expression after scaling

Clonally expanded T cells in COVID‐19 patients. (A) Clonal distribution of T cell receptors in COVID‐19 patients. (B) UMAP plot shows the distribution of clonally expanded T cells. (C) Residual plot for the Pearson's chi‐squared test of clone expansion from cell types, using the corrplot package in R. Red circles indicate an overrepresentation, and blue circles indicate an underrepresentation. A Pearson's chi‐squared test shows this difference is statistically significant (χ
2 = 17605, df = 24, simulated P < 2.2E‐16). (D) Bar plot shows the distribution of clonotypes by size (NA = 1, ≥ 2, ≥ 10 ,and ≥ 20 cells, NA represents cells with no αβTCR sequence detected). (E) Pie charts show the cell type composition of clonotypes from each sample stratified by clone size

Antigen‐specific T cells in COVID‐19 patients. (A) Comparison of D50 TCR diversity between patients with COVID‐19 and healthy controls. Low D50 value indicates low diversity and high clonal expansion. (B) Heatmap plot for clustering results of shared TCR groups among all samples. Each entry of the pairwise sharing matrix documents the number of shared TCR groups between two individuals. Unsupervised hierarchical clustering was applied to organize the columns and rows of the matrix. (C) The distribution of T cells of 916 COVID‐19 TCR groups overlaid on top of all the single cell data in the UMAP plot of T cells. (D) Residual plot for the Pearson's chi‐squared test of COVID‐19 specific TCR groups from cell types, using the corrplot package in R. Red circles indicate an overrepresentation, and blue circles indicate an underrepresentation. A Pearson's chi‐squared test shows this difference is statistically significant (χ
2 = 2658.5, df = 12, simulated P < 2.2E‐16)
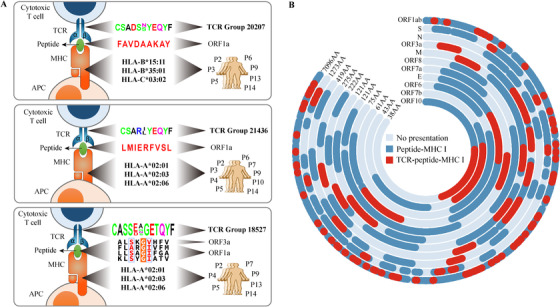
Identification of clonally expanded TCR groups and potential virus epitopes. (A) Diagram showing perfectly matched TCR groups and peptides presented by MHC I alleles of COVID‐19 patients (FDR < 0.001). (B) The distribution of MHC I presentation regions in each protein from the SARS‐CoV‐2 genome. Peptides computationally predicted to bind MHC‐I with high affinity are colored as dark blue. Those peptides presented by MHC‐I with high affinity, significantly cooccurring with a COVID‐19 TCR group are colored as red
Similar articles
-
Dynamic blood single-cell immune responses in patients with COVID-19.Signal Transduct Target Ther. 2021 Mar 6;6(1):110. doi: 10.1038/s41392-021-00526-2. Signal Transduct Target Ther. 2021. PMID: 33677468 Free PMC article.
-
The characteristics of TCR CDR3 repertoire in COVID-19 patients and SARS-CoV-2 vaccine recipients.Virulence. 2024 Dec;15(1):2421987. doi: 10.1080/21505594.2024.2421987. Epub 2024 Nov 4. Virulence. 2024. PMID: 39468707 Free PMC article. Review.
-
COVID vaccine makers brace for a variant worse than Delta.Nature. 2021 Oct;598(7882):552-553. doi: 10.1038/d41586-021-02854-3. Nature. 2021. PMID: 34671153 No abstract available.
-
Bonne réaction des personnes âgées au vaccin anti-Covid mRNA-1273 (Moderna).Rev Med Suisse. 2020 Oct 7;16(709):1895. Rev Med Suisse. 2020. PMID: 33026736 French. No abstract available.
-
T Cell Memory: Understanding COVID-19.Immunity. 2021 Jan 12;54(1):14-18. doi: 10.1016/j.immuni.2020.12.009. Epub 2020 Dec 19. Immunity. 2021. PMID: 33406391 Free PMC article. Review.
Cited by
-
The Application of Single-Cell Technologies for Vaccine Development Against Viral Infections.Vaccines (Basel). 2025 Jun 26;13(7):687. doi: 10.3390/vaccines13070687. Vaccines (Basel). 2025. PMID: 40733664 Free PMC article. Review.
-
A novel biomarker of COVI-19: MMP8 emerged by integrated bulk RNAseq and single-cell sequencing.Sci Rep. 2024 Dec 28;14(1):31086. doi: 10.1038/s41598-024-82227-8. Sci Rep. 2024. PMID: 39730651 Free PMC article.
-
MutCov: A pipeline for evaluating the effect of mutations in spike protein on infectivity and antigenicity of SARS-CoV-2.Comput Biol Med. 2022 Jun;145:105509. doi: 10.1016/j.compbiomed.2022.105509. Epub 2022 Apr 9. Comput Biol Med. 2022. PMID: 35421792 Free PMC article.
-
Single-cell profiling of T and B cell repertoires following SARS-CoV-2 mRNA vaccine.JCI Insight. 2021 Dec 22;6(24):e153201. doi: 10.1172/jci.insight.153201. JCI Insight. 2021. PMID: 34935643 Free PMC article.
-
Impact of mutations in SARS-COV-2 spike on viral infectivity and antigenicity.Brief Bioinform. 2022 Jan 17;23(1):bbab375. doi: 10.1093/bib/bbab375. Brief Bioinform. 2022. PMID: 34518867 Free PMC article.
References
Publication types
MeSH terms
Substances
Grants and funding
LinkOut - more resources
Full Text Sources
Other Literature Sources
Medical