. 2021 May;11(5):e399.
doi: 10.1002/ctm2.399.

Identification of biomarkers complementary to homologous recombination deficiency for improving the clinical outcome of ovarian serous cystadenocarcinoma

Affiliations

Identification of biomarkers complementary to homologous recombination deficiency for improving the clinical outcome of ovarian serous cystadenocarcinoma

Zhiwen Shi et al. Clin Transl Med. 2021 May.

Abstract

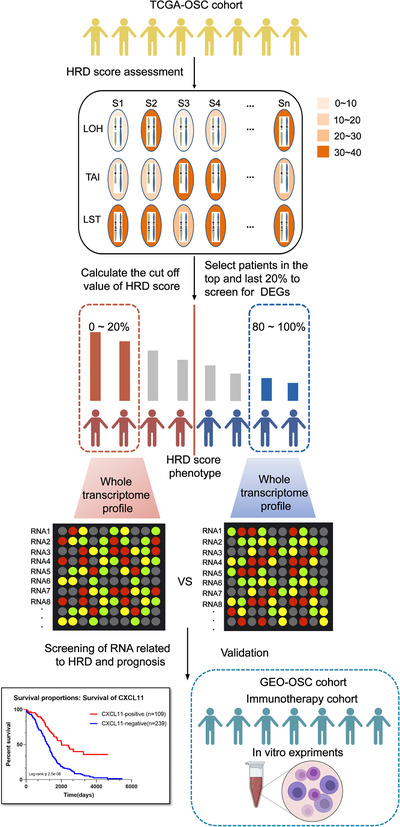
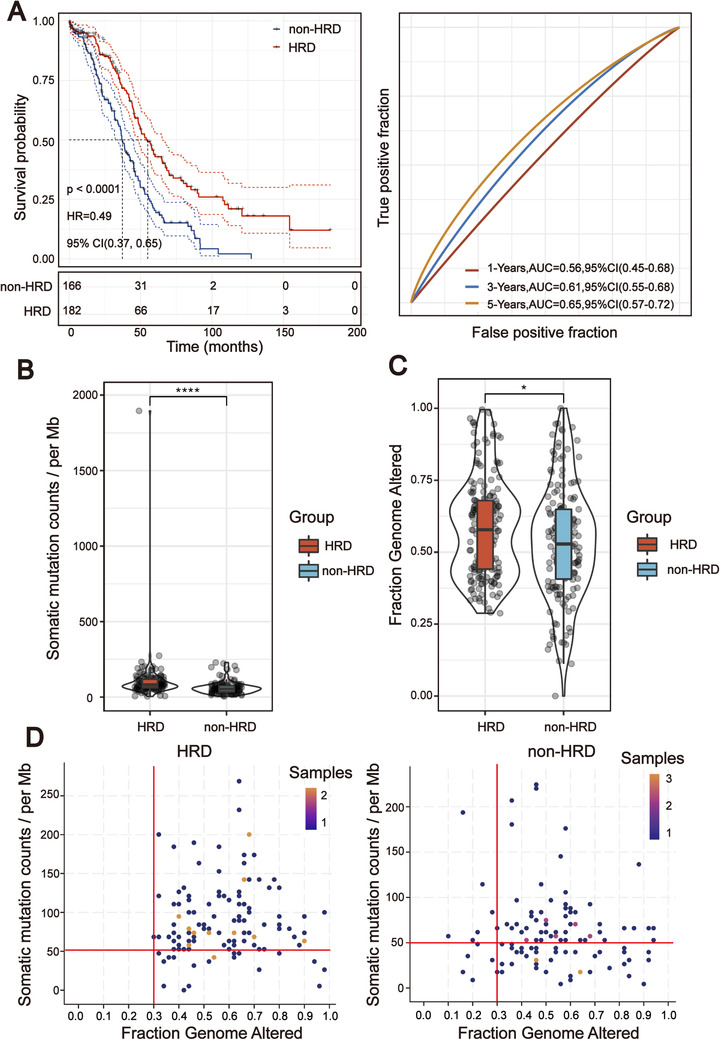
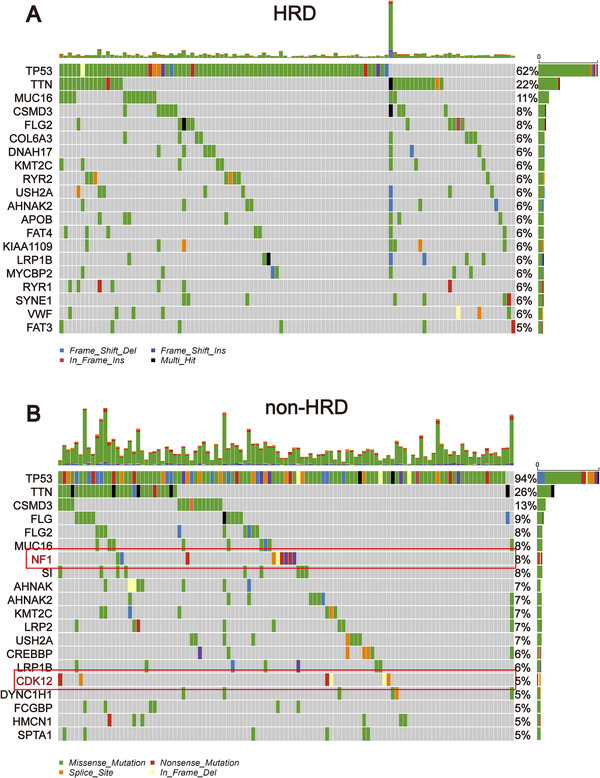
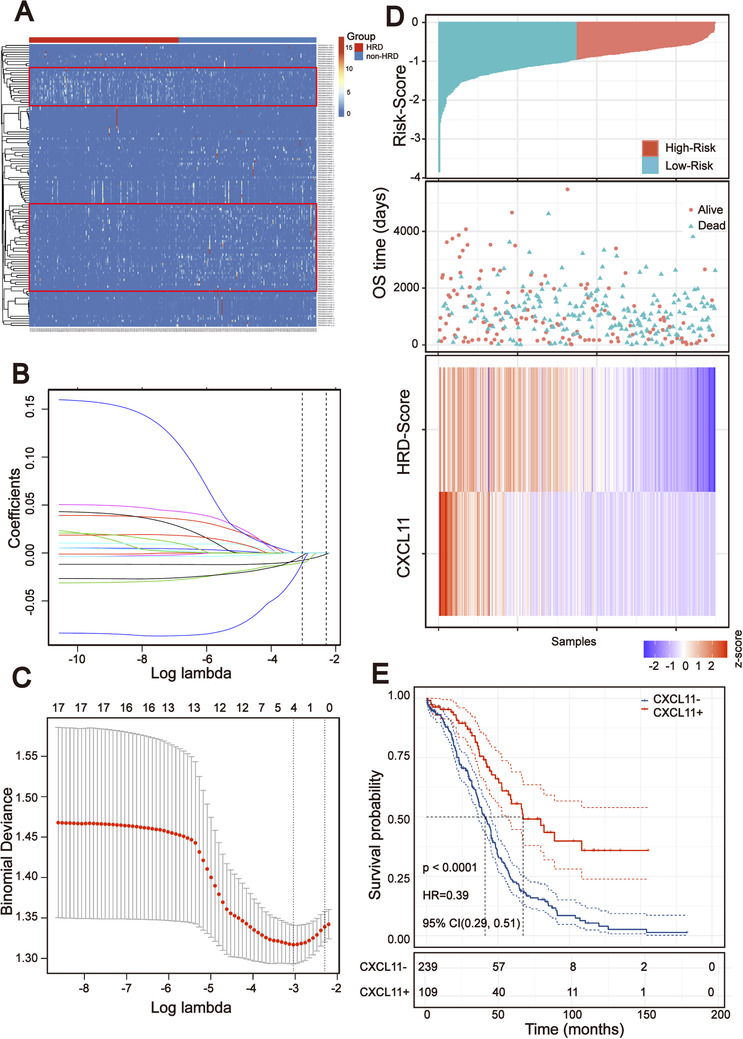
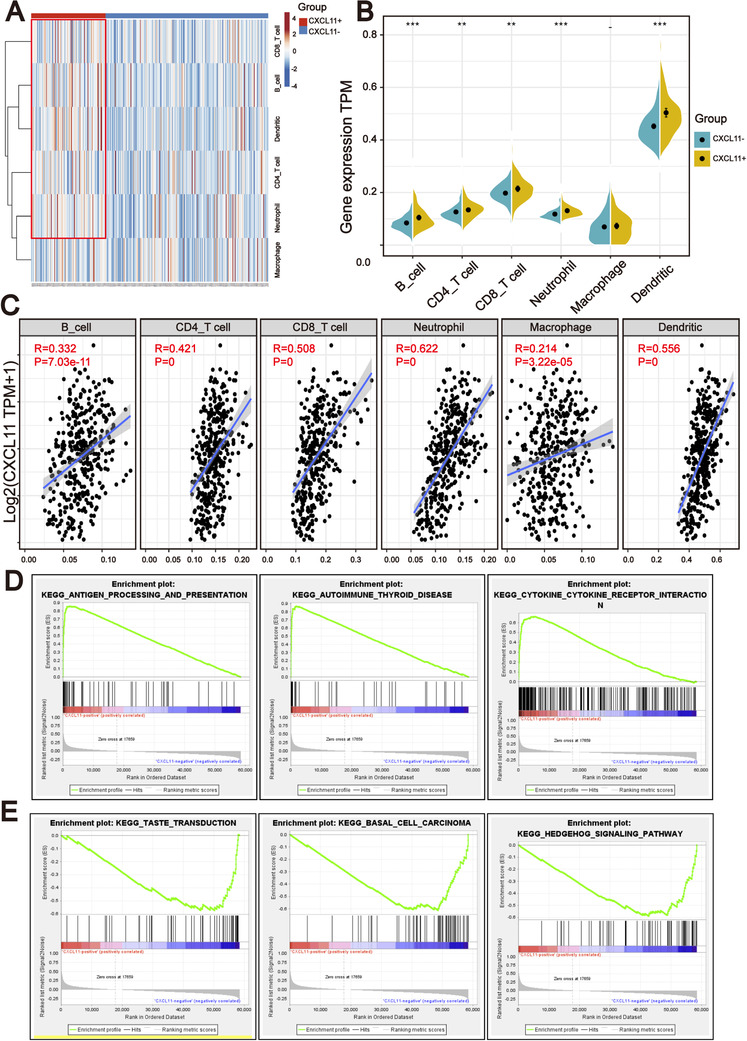
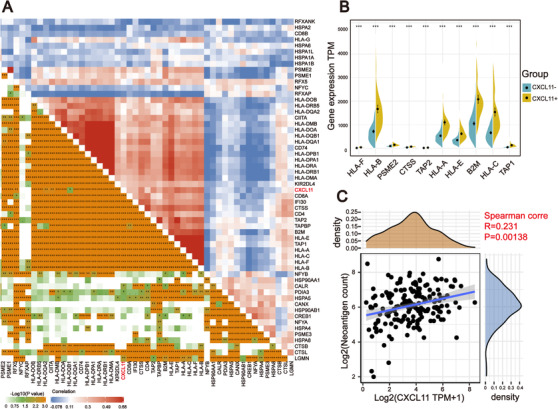
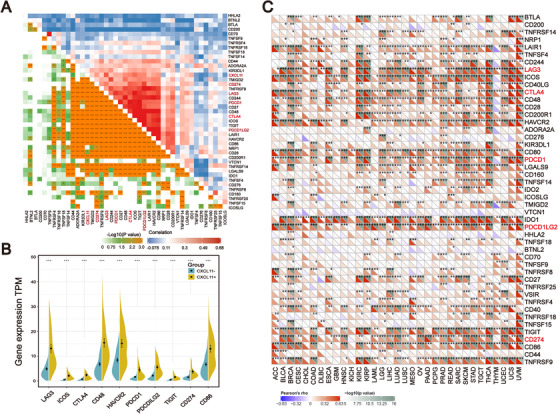
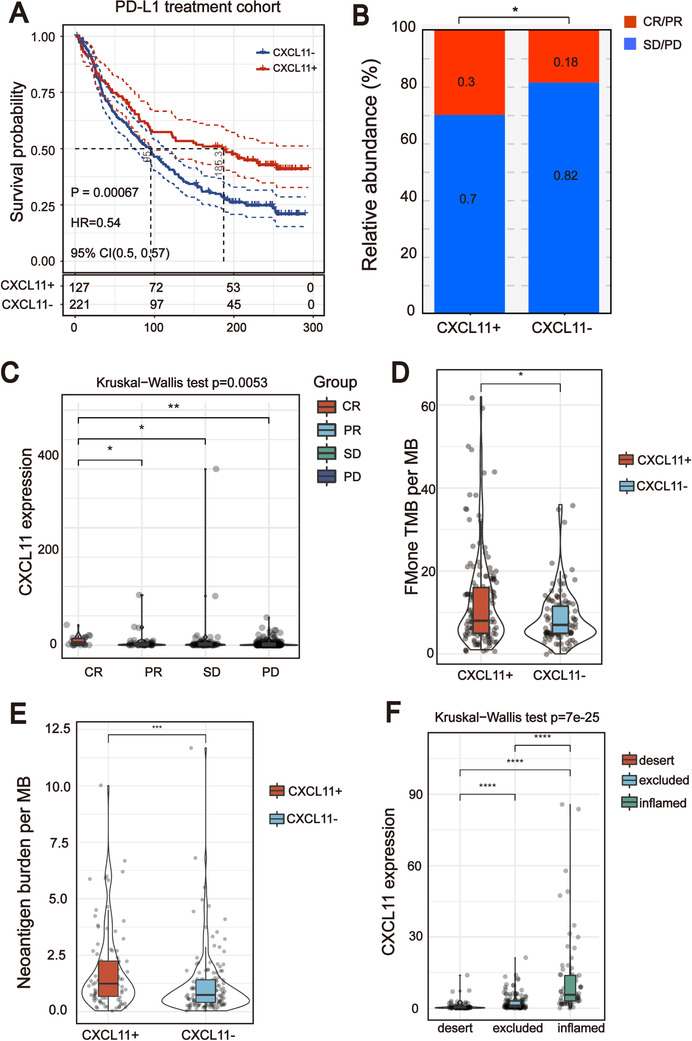
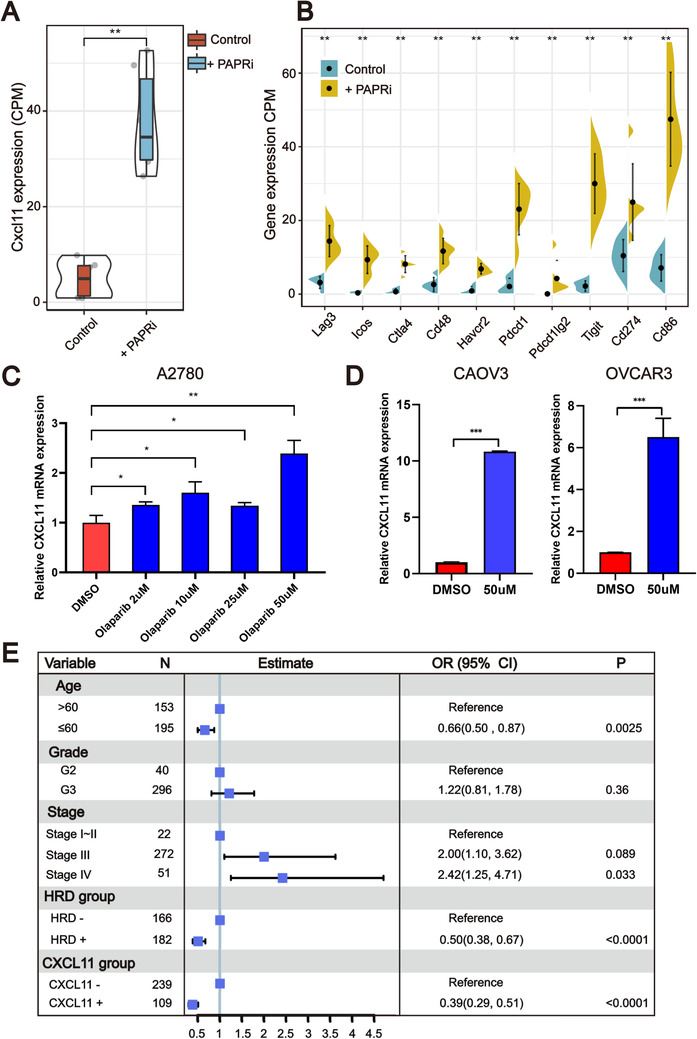
Ovarian cancer patients with homologous recombination deficiency (HRD) tumors would benefit from PARP inhibitor (PARPi) therapy. However, patients with HRD tumors account for less than 50% of the whole cohort, so new biomarkers still need to be developed. Based on the data from the SNP array and somatic mutation profiles in the ovarian cancer genome, we found that high frequency of actionable mutations existed in patients with non-HRD tumors. Through transcriptome analysis, we identified that a downstream target of the cGAS-STING pathway, CXCL11, was upregulated in HRD tumors and could be used as a predictor of survival outcome. Further comprehensive analysis of the tumor immune microenvironment (TIME) revealed that CXCL11 expression signature was closely correlated with cytotoxic cells, neoantigen load and immune checkpoint blockade (ICB). Clinical trial data confirmed that the expression of CXCL11 could be used as a biomarker for anti-PD-1/PD-L1 therapy. Finally, in vivo and in vitro experiments showed that cancer cells with PARPi treatment increased the expression of CXCL11. Collectively, our study not only provides biomarkers of ovarian cancer complementary to the HRD score but also introduces a potential new perspective for identifying prognostic biomarkers of immunotherapy.

Keywords: CXCL11; HRD; PARPi; TIME; cGAS-STING; ovarian cancer.


Conflict of interest statement

The authors declare that there is no conflict of interest.

Figures

FIGURE 1
FIGURE 1
Computational overview of homologous recombination deficiency (HRD)‐related RNAs detection. Columns reflect ovarian cancer samples, and the rows reflect three biomarkers of the HRD score. Color reflects the scores for each biomarker in each sample. HRD‐related RNAs were detected by comparing the RNA expression profile between the top 20% patients with high HRD scores and the bottom 20% patients with low HRD scores
FIGURE 2
FIGURE 2
Homologous recombination deficiency (HRD) score was significantly correlated with the prognosis and molecular characteristics of TCGA‐OSC cohort. (A) Kaplan–Meier estimates of overall survival of patients with the HRD or non‐HRD tumors calculated by the HRD score in the TCGA‐OSC cohort. On the right are the AUC curves of HRD score in TCGA‐OSC cohort. (B) Violin plot of somatic mutations in the HRD and non‐HRD groups. Somatic mutation counts in the HRD group were significantly higher than those in the non‐HRD group (Wilcoxon signed rank test, ****< .0001). (C) Violin plot of fraction genome altered in the HRD and non‐HRD groups (Wilcoxon signed rank test, *< .05). (D) Two‐dimensional plan of fraction of the genome and somatic mutation counts in different subgroups (Kolmogorov–Simonov test, p < .01)
FIGURE 3
FIGURE 3
Mutational landscape of TCGA‐OSC cohort stratified by the homologous recombination deficiency (HRD) and non‐HRD groups. (A) Genetic profile of the HRD OSC patients. (B) Genetic profile of the non‐HRD OSC patients. The genes in the red box are actionable genes
FIGURE 4
FIGURE 4
Screening prognosis related RNA based on the homologous recombination deficiency (HRD) score. (A) Unsupervised clustering of 348 OSC patients based on the expression pattern of 124 differentially expressed genes (DEGs). (B and C) Lasso coefficient profiles of the 17 prognosis‐associated HRD genes. (D) Heatmap of the signature consisting of the HRD score and the CXCL11 expression signature based on the Cox coefficients. Patients were divided into high‐risk and low‐risk groups and the median risk score was utilized as the cutoff value. (E) Kaplan–Meier estimates of overall survival of patients with the CXCL11‐positive or CXCL11‐negative tumors in the TCGA‐OSC cohort (log‐rank test)
FIGURE 5
FIGURE 5
CXCL11 expression signature was associated with the immune infiltration. (A) TIMER analysis identified the relative infiltration of six types of immune cell subpopulations with different CXCL11 subgroups. (B) Violin plot of immune cell subpopulations in the CXCL11‐positive and CXCL11‐negative groups (Wilcoxon signed rank test, **< .01, ***< .001). (C) Correlation between the CXCL11 expression signature and immune cell subpopulations in the TCGA‐OSC cohort. (D) GSEA identified that antigen processing and presentation, autoimmune thyroid and cytokine receptor interaction signaling pathways were upregulated in the CXCL11‐positive group compared to the CXCL11‐negative group. (E) GSEA identified that taste transduction, basal cell carcinoma, and hedgehog signaling pathways were upregulated in the CXCL11‐negative group compared to the CXCL11‐positive group
FIGURE 6
FIGURE 6
Correlation between the expression of CXCL11 and antigen‐related genes. (A) Correlation between the CXCL11 expression signature and antigen‐related genes in the TCGA‐OSC cohort. (B) Violin plot of top 10 antigen‐related genes in the CXCL11‐positive and CXCL11‐negative groups (Wilcoxon signed rank test, ***p < .001). (C) Correlation between CXCL11 expression signature and neoantigen load in the TCGA‐OSC cohort
FIGURE 7
FIGURE 7
Correlation among the expression of CXCL11 and ICB‐related genes. (A) Correlation between the CXCL11 expression signature and ICB‐related genes in the TCGA‐OSC cohort. (B) Violin plot of top 10 ICB‐related genes in the CXCL11‐positive and CXCL11‐negative groups (Wilcoxon signed rank test, ***< .001). (C) Correlation between CXCL11 expression signature and ICB‐related genes in the TCGA‐pan cancer cohorts
FIGURE 8
FIGURE 8
CXCL11 expression could be used as a potential biomarker for ICB therapy. (A) Curve for overall survival is shown for high and low CXCL11 expression in the PD‐L1 treatment cohort. (B and C) Proportion of immune response to anti‐PD‐L1 treatment in high versus low CXCL11 expression subgroups. CR, complete response; PD, progressive disease; PR, partial response; SD, stable disease. (D) TMB and neoantigen load (E) in the immunotherapy cohort were compared among distinct CXCL11 expression signature subgroups. (F) CXCL11 expression signature in different immune phenotype subgroups. The tumor immunophenotype was defined according to immunohistochemistry results of the CD8 antibody (Wilcoxon signed rank test, ****< .0001)
FIGURE 9
FIGURE 9
Olaparib elicits the expression of CXCL11 in vivo and in vitro. (A and B) Olaparib elicits the expression of CXCL11 and ICB‐related genes in vivo (Wilcoxon signed rank test, **< .01). (C and D) qPCR evaluation of CXCL11 expression in different cell lines. Olaparib elicits the expression of CXCL11 in multiple ovarian cancer cell lines (Student's t‐test, *< .05, **< .01). (E) Forest plot representation of the multivariate Cox regression model delineated the association between the CXCL11 expression signature and survival in the TCGA‐OSC cohort

Similar articles

Cited by

References

    1. Cabasag CJ, Arnold M, Butler J, et al. The influence of birth cohort and calendar period on global trends in ovarian cancer incidence. Int J Cancer. 2020;146(3):749‐758. - PMC - PubMed
    1. Sundar S, Neal RD, Kehoe S. Diagnosis of ovarian cancer. BMJ. 2015:351:h4443. - PubMed
    1. Qi X, Yu C, Wang Y, Lin Y, Shen B. Network vulnerability‐based and knowledge‐guided identification of microRNA biomarkers indicating platinum resistance in high‐grade serous ovarian cancer. Clin Transl Med. 2019;8(1):1‐11. - PMC - PubMed
    1. Matsuda A, Katanoda K. Five‐year relative survival rate of ovarian cancer in the USA, Europe and Japan. Jpn J Clin Oncol. 2014;44(2):196. - PubMed
    1. Li X, Heyer W‐D. Homologous recombination in DNA repair and DNA damage tolerance. Cell Res. 2008;18(1):99‐113. - PMC - PubMed

MeSH terms