. 2021 May;11(5):e411.
doi: 10.1002/ctm2.411.

Glioma glycolipid metabolism: MSI2-SNORD12B-FIP1L1-ZBTB4 feedback loop as a potential treatment target

Affiliations

Glioma glycolipid metabolism: MSI2-SNORD12B-FIP1L1-ZBTB4 feedback loop as a potential treatment target

Weiwei Dong et al. Clin Transl Med. 2021 May.

Abstract

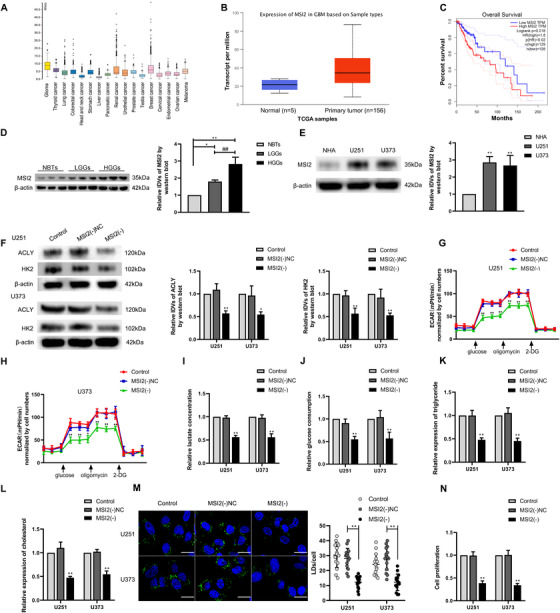
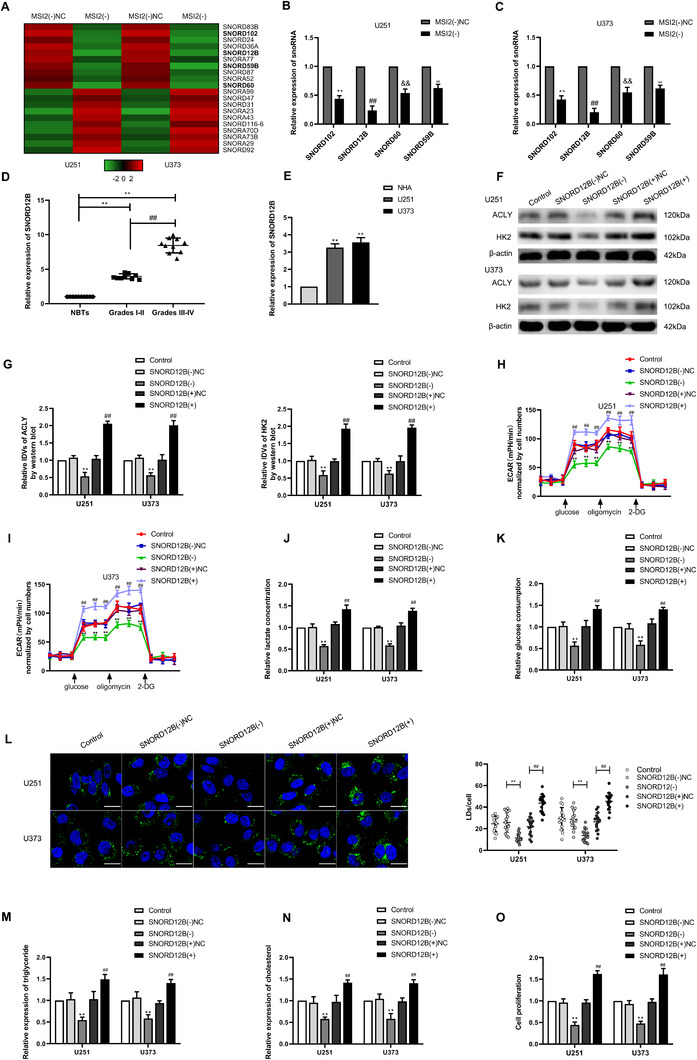
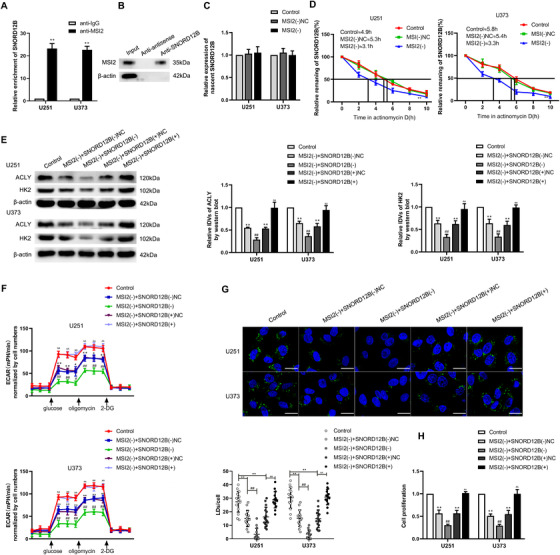
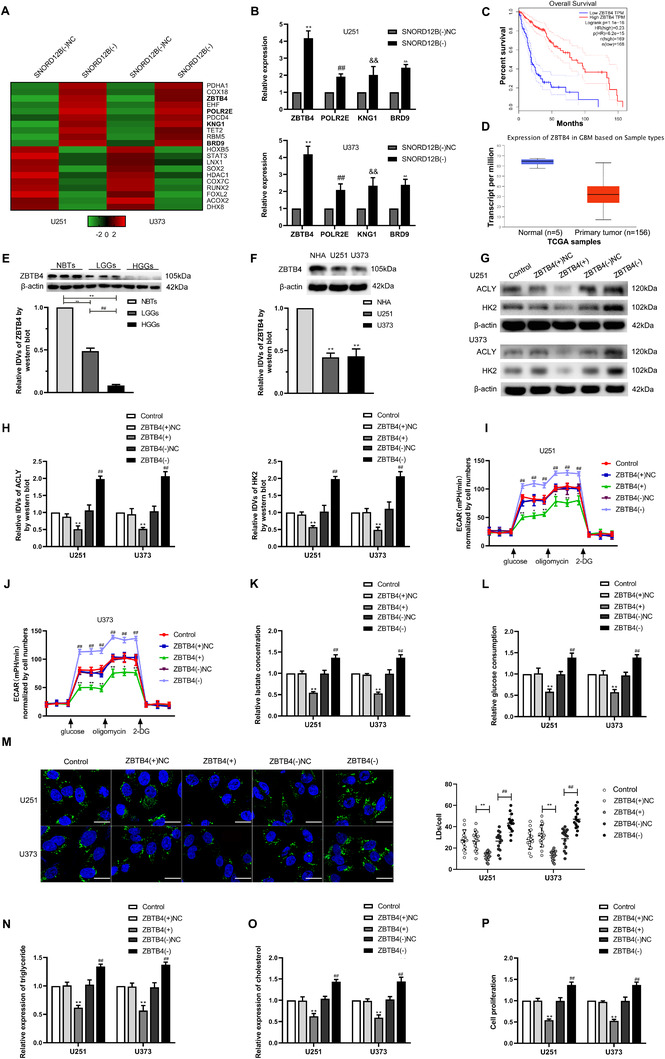
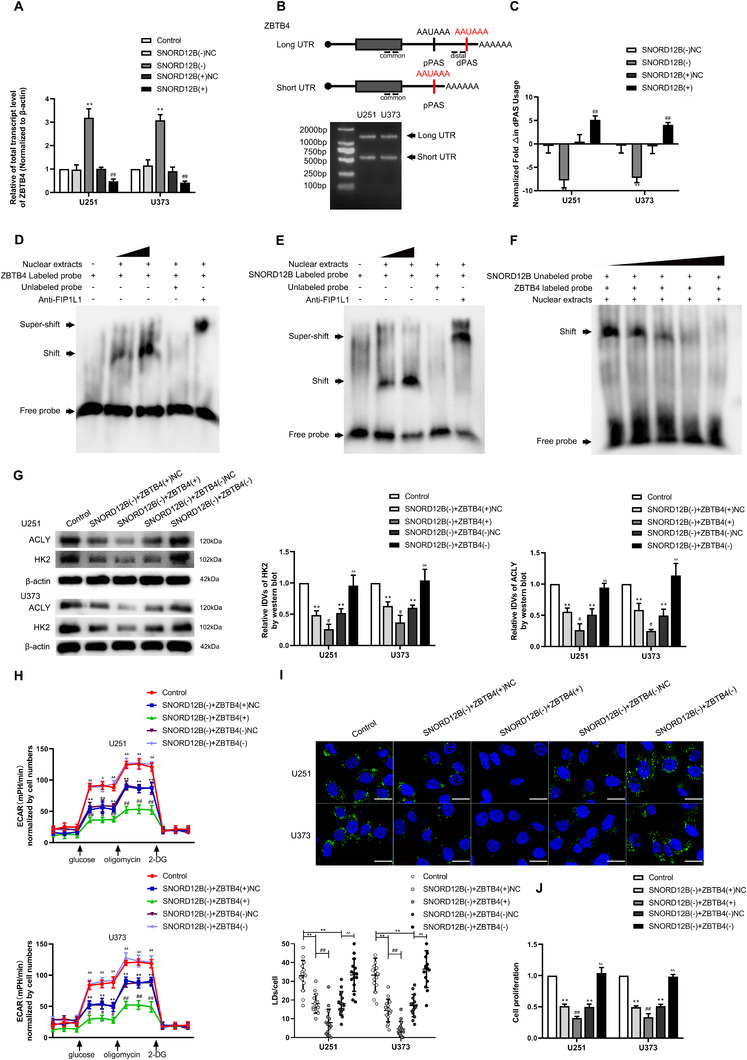
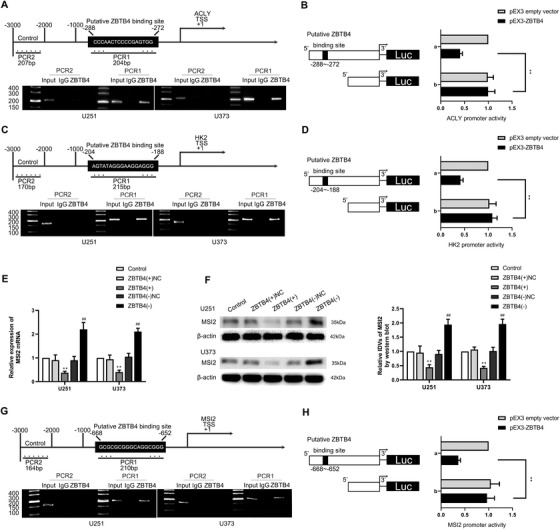
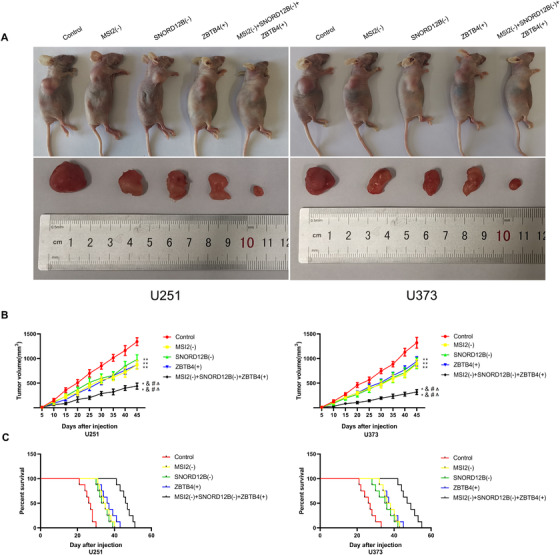
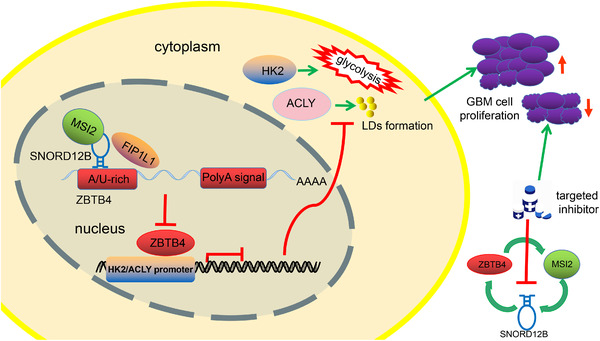
Abnormal energy metabolism, including enhanced aerobic glycolysis and lipid synthesis, is a well-established feature of glioblastoma (GBM) cells. Thus, targeting the cellular glycolipid metabolism can be a feasible therapeutic strategy for GBM. This study aimed to evaluate the roles of MSI2, SNORD12B, and ZBTB4 in regulating the glycolipid metabolism and proliferation of GBM cells. MSI2 and SNORD12B expression was significantly upregulated and ZBTB4 expression was significantly low in GBM tissues and cells. Knockdown of MSI2 or SNORD12B or overexpression of ZBTB4 inhibited GBM cell glycolipid metabolism and proliferation. MSI2 may improve SNORD12B expression by increasing its stability. Importantly, SNORD12B increased utilization of the ZBTB4 mRNA transcript distal polyadenylation signal in alternative polyadenylation processing by competitively combining with FIP1L1, which decreased ZBTB4 expression because of the increased proportion of the 3' untranslated region long transcript. ZBTB4 transcriptionally suppressed the expression of HK2 and ACLY by binding directly to the promoter regions. Additionally, ZBTB4 bound the MSI promoter region to transcriptionally suppress MSI2 expression, thereby forming an MSI2/SNORD12B/FIP1L1/ZBTB4 feedback loop to regulate the glycolipid metabolism and proliferation of GBM cells. In conclusion, MSI2 increased the stability of SNORD12B, which regulated ZBTB4 alternative polyadenylation processing by competitively binding to FIP1L1. Thus, the MSI2/SNORD12B/FIP1L1/ZBTB4 positive feedback loop plays a crucial role in regulating the glycolipid metabolism of GBM cells and provides a potential drug target for glioma treatment.

Keywords: MSI2; SNORD12B; ZBTB4; alternative polyadenylation; glioma; glycolipid metabolism; molecular pattern; potential target; prediction and personalized prevention; translational research.


Conflict of interest statement

The authors declare that there is no conflict of interest.

Figures

FIGURE 1
FIGURE 1
MSI2 expression was elevated in glioma tissues and cells, and knockdown of MSI2 suppressed glycolipid metabolism and proliferation. (A) Expression of MSI2 is high in glioma from TCGA database. (B) Expression of MSI2 in NBTs and glioma from TCGA samples. (C) Effect of MSI2 expression level on LGG patient survival time from TCGA database. (D) Protein level of MSI2 was analyzed in normal brain tissues (NBTs), low‐grade gliomas (LGGs), and high‐grade gliomas (HGGs) via Western blot. * p < .05 versus NBTs group; ** p < .01 versus NBTs group; ## p < .01 versus LGGs group. (E) MSI2 protein level was analyzed in normal human astrocytes (NHA) and glioma cell lines (U251 and U373) via Western blot. ** p < .01 versus NHA group. (F) HK2 and ACLY protein expression after MSI2 knockdown in U251 and U373 cells was analyzed via Western blot. (G and H) The effect of MSI2 knockdown on glycolysis in U251 and U373 cells was analyzed via extracellular acidification rate (ECAR), including glycolysis and glycolytic capacity. (I and J) Lactate production and glucose uptake were measured in U251 and U373 cells after MSI2 knockdown. (K and L) Intracellular triglyceride and cholesterol expression levels were measured after MSI2 knockdown. * p < .05 versus MSI2(−)NC group; ** p < .01 versus MSI2(−)NC group. (M) Representative confocal fluorescence imaging of lipid droplets (LDs) stained by BODIPY 493/503 (green) in U251 and U373 cells. Nucleus (blue) was stained by DAPI. Scale bars = 20 μm. Data are presented as the mean ± SD (n = 15, each group). ** p < .01 versus MSI2(−)NC group. (N) Effect of MSI2 on the proliferation of U251 and U373 cells was detected via Cell Counting Kit‐8 (CCK‐8) assay. ** p < .01 versus MSI2(−)NC group. Except for specially noted, data are presented as the mean ± SD of three independent experiments per group. One‐way ANOVA was used for statistical analysis
FIGURE 2
FIGURE 2
SNORD12B expression was elevated in glioma tissues and cells, and knockdown of SNORD12B suppressed glycolipid metabolism and proliferation. (A) SnoRNA microarray was performed to detect the differential gene when MSI2 was knockdown. (B and C) Selected molecules were validated by qRT‐PCR. **/##/&&/ΔΔ p < .01 versus MSI2(−)NC group. (D) SNORD12B expression was detected in tissues (NBTs [n = 10], LGGS [n = 10], and HGGs [n = 10]) via qRT‐PCR. ** p < .01 versus NBTs group; ## p < .01 versus LGGs group. (E) SNORD12B expression level was analyzed in NHA cell, U251, and U373 cells via qRT‐PCR. ** p < .01 versus NHA group. (F and G) Expressions of HK2 and ACLY were detected via Western blot. (H and I) Effect of SNORD12B on glycolysis was analyzed via ECAR. (J and K) Lactate production and glucose uptake were measured after SNORD12B knockdown or overexpression. ** p < .01 versus SNORD12B(−)NC group; ## p < .01 versus SNORD12B(+)NC group. (L) Representative confocal fluorescence imaging of LDs stained by BODIPY 493/503 (green) in U251 and U373 cells after SNORD12B knockdown or overexpression. Nucleus (blue) was stained by DAPI. Scale bars = 20 μm. Data are presented as mean ± SD (n = 15, each group). ** p < .01 versus SNORD12B(−)NC group; ## p < .01 versus SNORD12B(+)NC group. (M and N) Intracellular triglyceride and cholesterol expression levels were measured to evaluate the effect of SNORD12B on lipogenesis. (O) Effect of SNORD12B on proliferation was analyzed via CCK‐8. ** p < .01 versus SNORD12B(−)NC group; ## p < .01 versus SNORD12B(+)NC group. Except for specially noted, data are presented as the mean ± SD of three independent experiments per group. Statistical analysis was by one‐way ANOVA method
FIGURE 3
FIGURE 3
MSI2 facilitated glycolipid metabolism of GBM cells by increasing SNORD12B stability. (A) An enrichment of SNORD12B in MSI2 immunoprecipitated samples via RNA immunoprecipitation (RIP) assay. ** p < .01 versus anti‐IgG group, using Student's t‐test. (B) RNA pull‐down assay followed by Western blot showed the specific associations of MSI2 with biotinylated‐SNORD12B or antisense RNA. (C) Expression of nascent SNORD12B was measured via qRT‐PCR after MSI2 knockdown. (D) Half‐life of SNORD12B was measured by qRT‐PCR after actinomycin D treated in U251 and U373 cells. ** p < .01 versus MSI2(−)NC group. (E) Regulation of HK2 and ACLY expression by MSI2 and SNORD12B was analyzed via Western blot. (F) ECAR was used to measure glycolysis and glycolytic capacity of U251 and U373 cells. * p < .05 versus control group; ** p < .01 versus control group; # p < .05 versus MSI2(−) + SNORD12B(−)NC group; ## p < .01 versus MSI2(−) + SNORD12B(−)NC group; ΔΔ p < .01 versus MSI2(−) + SNORD12B(+)NC group. (G) Representative confocal fluorescence imaging of LDs stained by BODIPY 493/503 (green) in U251 and U373 cells. Nucleus (blue) was stained by DAPI. Scale bars = 20 μm. Data are presented as the mean ± SD (n = 15, each group). ** p < .01 versus control group; ## p < .01 versus MSI2(−) + SNORD12B(−)NC group; ΔΔ p < .01 versus MSI2(−) + SNORD12B(+)NC group . (H) Effect of MSI2 and SNORD12B on proliferation was analyzed via CCK‐8. ** p < .01 versus control group; ## p < .01 versus MSI2(−) + SNORD12B(−)NC group; ΔΔ p < .01 versus MSI2(−) + SNORD12B(+)NC group. Except for specially noted, data are presented as the mean ± SD of three independent experiments per group. Statistical analysis was by one‐way ANOVA method
FIGURE 4
FIGURE 4
ZBTB4 was downregulated in GBM tissues and cells, and overexpression of ZBTB4 inhibited GBM cells glycolipid metabolism and proliferation. (A) Whole human genome microarray was performed to detect the gene profile when SNORD12B was knockdown. (B) qRT‐PCR was performed to validate the selected molecules. **/##/&&/ΔΔ p < .01 versus SNORD(−)NC group. (C) Effect of ZBTB4 expression level on glioma patient survival time from TCGA database. (D) Expression of ZBTB4 in NBTs and glioma from TCGA samples. (E) ZBTB4 protein levels were analyzed in NBTs, LGGs, and HGGs by Western blot. ** p < .01 versus NBTs group; ## p < .01 versus LGGs group. (F) ZBTB4 protein levels in NHA, U251, and U373 cells were detected via Western blot. ** p < .01 versus NHA group. (G and H) Regulation of HK2 and ACLY expression by ZBTB4 was analyzed via Western blot. (I and J) Effect of ZBTB4 on glycolysis and glycolytic capacity in U251 and U373 cells was measured via ECAR. (K and L) Lactate production and glucose uptake were measured in U251 and U373 cells after ZBTB4 knockdown or overexpression. * p < .05 versus ZBTB4(+)NC group; ** p < .01 versus ZBTB4(+)NC group; ## p < .01 versus ZBTB4(−)NC group. (M) Representative confocal fluorescence imaging of LDs stained by BODIPY 493/503 (green) in U251 and U373 cells after ZBTB4 knockdown or overexpression. Nucleus (blue) was stained by DAPI. Scale bars = 20 μm. Data are presented as the mean ± SD (n = 15, each group). ** p < .01 versus ZBTB4(+)NC group; ## p < .01 versus ZBTB4(−)NC group. (N and O) Intracellular triglyceride and cholesterol expression levels were measured to evaluate the effect of ZBTB4 on lipogenesis. (P) Effect of ZBTB4 on proliferation was analyzed via CCK‐8 assay. ** p < .01 versus ZBTB4(+)NC group; ## p < .01 versus ZBTB4(−)NC group. Except for specially noted, data are presented as the mean ± SD of three independent experiments per group. Statistical analysis was by one‐way ANOVA method
FIGURE 5
FIGURE 5
SNORD12B regulated alternative polyadenylation of ZBTB4 by competitively binding to FIP1L1. (A) Effect of SNORD12B on the expression of ZBTB4 mRNA was analyzed by qRT‐PCR. ** p < .01 versus SNORD12B(−)NC group; ## p < .01 versus SNORD12B(+)NC group by one‐way ANOVA. (B) Diagram showing two polyadenylation signals (PAS) in the 3′UTR of ZBTB4 and the primers specifically designed for the detection of total transcript and long 3′UTR transcript (above). 3′‐Random amplification of cDNA ends (3′RACE) PCR amplify full length 3′UTR of ZBTB4 (below). (C) qRT‐PCR was conducted to analyze the effect of SNORD12B on the utilization of distal polyadenylation signal (dPAS) in U251 and U373 cells. ** p < .01 versus SNORD12B(−)NC group; ## p < .01 versus SNORD12B(+)NC group by one‐way ANOVA. (D) RNA electrophoretic mobility shift assay (EMSA) showed binding affinity between ZBTB4 and FIP1L1. (E) RNA EMSA showed SNROD12B could bind to FIP1L1. (F) Competitive gel mobility shift assay was performed to detect SNORD12B and ZBTB4 competitively binding to FIP1L1. (G) Regulation of HK2 and ACLY expression by SNORD12B and ZBTB4 was analyzed via Western blot. (H) ECAR to measure glycolysis and glycolytic capacity of U251 and U373 cells regulated by SNORD12B and ZBTB4. **p < .01 versus control group; # p < .05 versus SNORD12B(−) + ZBTB4(+)NC group; ## p < .01 versus SNORD12B(−) + ZBTB4(+)NC group; Δ p < .05 versus SNORD12B(−)+ZBTB4(−)NC group; ΔΔ p < .01 versus SNORD12B(−) + ZBTB4(−)NC group. (I) Representative confocal fluorescence imaging of LDs stained by BODIPY 493/503 (green) in U251 and U373 cells. Nucleus (blue) was stained by DAPI. Scale bars = 20 μm. Data are presented as the mean ± SD (n = 15, each group). **p < .01 versus control group; ## p < .01 versus SNORD12B(−) + ZBTB4(+)NC group; ΔΔ p < .01 versus SNORD12B(−) + ZBTB4(−)NC group. (J) Effect of SNORD12B and ZBTB4 on the proliferation was analyzed via CCK‐8 assay. **p < .01 versus control group; ## p < .01 versus SNORD12B(−) + ZBTB4(+)NC group; ΔΔ p < .01 versus SNORD12B(−) + ZBTB4(−)NC group. Except for specially noted, data are presented as the mean ± SD of three independent experiments per group. Statistical analysis was by one‐way ANOVA method
FIGURE 6
FIGURE 6
ZBTB4 directly bound to the promoter regions of HK2, ACLY, and MSI2 and transcriptionally suppressed their expression. (A) Putative ZBTB4 binding site is indicated in the ACLY promoter region (above). Chromatin immunoprecipitation (ChIP) assay showed the products amplified putative ZBTB4‐binding sites of ACLY (below). (B) Schematic diagram of luciferase reporter construction and ACLY relative luciferase activity measured in cells cotransfected with the ACLY promoter (−1000 to 0 bp) (or ACLY promoter‐deleted putative ZBTB4 binding site) and pEX3 empty vector or pEX3‐ZBTB4. (C) Putative ZBTB4 binding site is indicated in HK2 promoter region (above). ChIP assay showed the products amplified putative ZBTB4‐binding sites of HK2 (below). (D) Schematic diagram of luciferase reporter construction and HK2 relative luciferase activity measured in cells cotransfected with the HK2 promoter (−1000 to 0 bp) (or HK2 promoter‐deleted putative ZBTB4 binding site) and pEX3 empty vector or pEX3‐ZBTB4. **p < .01 versus pEX3 empty vector group. (E and F) Expression of MSI2 mRNA and protein was measured after ZBTB4 knockdown or overexpression. **p < .01 versus ZBTB4(+)NC group; ## p < .01 versus ZBTB4(−)NC group. (G) Putative ZBTB4 binding site was indicated in MSI2 promoter region (above). ChIP assay showed the products amplified putative ZBTB4‐binding sites of MSI2 (below). (H) Schematic diagram of luciferase reporter construction and MSI2 relative luciferase activity measured in cells cotransfected with the MSI2 promoter (−1000 to 0 bp) (or MSI2 promoter‐deleted putative ZBTB4 binding site) and pEX3 empty vector or pEX3‐ZBTB4. **p < .01 versus pEX3 empty vector group. Except for specially noted, data are presented as the mean ± SD of three independent experiments per group. One‐way ANOVA was used for statistical analysis
FIGURE 7
FIGURE 7
Knockdown of MSI2 and SNORD12B with ZBTB4 overexpression suppressed tumor growth and prolonged survival in nude mice. (A) Subcutaneously xenografted nude mice injected with different treated cells are shown (above). Representative tumors from each group are shown (below). (B) Tumor growth curves are shown. Tumor size was recorded every 5 days, and tumors were extracted at 45 days after injection. **p < .01 versus control group; && p < .01 versus MSI2(−) group; ## p < .01 versus SNORD12B(−) group; ΔΔ p < .01 versus ZBTB4(+) group by one‐way ANOVA. (C) Survival curves of nude mice with orthotopic xenografts are shown. Data are presented as the mean ± SD of eight mice per group
FIGURE 8
FIGURE 8
Schematic cartoon of mechanism of MSI2/SNORD12B/FIP1L1/ZBTB4 axis functions as a potential glycolipid metabolism regulator in glioma. MSI2 bound to SNORD12B and upregulated its expression by increasing stability. SNORD12B competitively bound to FIP1L1 with ZBTB4 and facilitated dPAS utilization of ZBTB4 in the APA process, causing downregulation of ZBTB4 expression. ZBTB4 transcriptionally suppressed the expression of HK2, ACLY, and MSI2, forming a positive feedback regulatory loop to collectively regulate the glycolipid metabolism and proliferation of GBM cells

Similar articles

Cited by

References

    1. Zhang P, Xia Q, Liu L, Li S, Dong L. Current opinion on molecular characterization for GBM classification in guiding clinical diagnosis, prognosis, and therapy. Front Mol Biosci. 2020;7:562798. - PMC - PubMed
    1. Stylli SS. Novel treatment strategies for glioblastoma. Cancers (Basel). 2020;12(10):2883. - PMC - PubMed
    1. Pellerin L, Carrie L, Dufau C, et al. Lipid metabolic reprogramming: role in melanoma progression and therapeutic perspectives. Cancers (Basel). 2020;12(11):3147. - PMC - PubMed
    1. Wu F, Cheng Y, Wu L, et al. Emerging landscapes of tumor immunity and metabolism. Front Oncol. 2020;10:575037. - PMC - PubMed
    1. Xu R, Yang J, Ren B, et al. Reprogramming of amino acid metabolism in pancreatic cancer: recent advances and therapeutic strategies. Front Oncol. 2020;10:572722. - PMC - PubMed

Publication types

LinkOut - more resources