

doi: 10.1002/ctm2.418.
NRF2 activation induced by PML-RARα promotes microRNA 125b-1 expression and confers resistance to chemotherapy in acute promyelocytic leukemia
Affiliations
- PMID: 34047481
- PMCID: PMC8101532
- DOI: 10.1002/ctm2.418
Item in Clipboard
NRF2 activation induced by PML-RARα promotes microRNA 125b-1 expression and confers resistance to chemotherapy in acute promyelocytic leukemia
Clin Transl Med.
2021 May.
No abstract available
Conflict of interest statement
The authors declare that there is no conflict of interest.
Figures
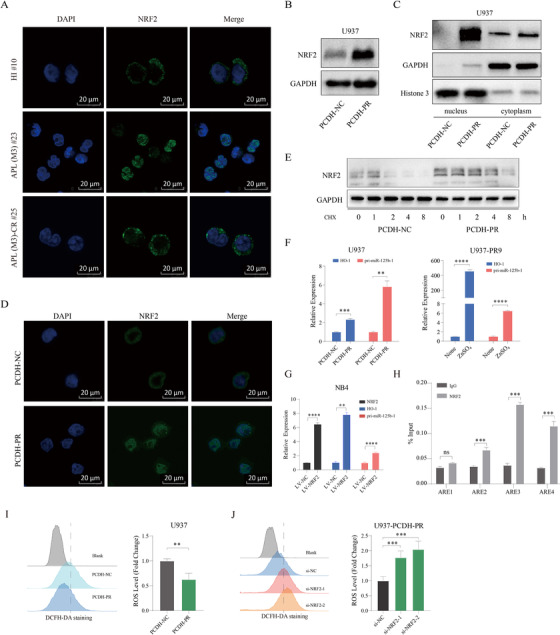
PML‐RARα activates the NRF2/miR‐125b‐1 antioxidant program. (A) Immunofluorescence microscopy after staining with NRF2 (green) and DAPI (blue) demonstrated NRF2 expression in HI, APL (M3) and APL (M3)‐CR cells. Scale bars, 20 μm. (B and C) U937‐PCDH‐NC and U937‐PCDH‐PR cells were analyzed for NRF2 in whole cell lysates or cytosolic/nuclear fractions by Western blot. Blots are representative of at least three independent experiments. (D) Immunofluorescence microscopy of NRF2 in stable constitutive express PML‐RARA (U937‐PCDH‐PR) or negative control (U937‐PCDH‐NC) cells. A representative image of three independent experiments is shown. Scale bars, 20 μm. (E) Western blot analysis of NRF2 in U937‐PCDH‐NC and U937‐PCDH‐PR cells treated with 20 μM cycloheximide at different time points. (F) qRT‐PCR analysis of HO‐1 and pri‐miR‐125b‐1 in U937‐PCDH‐PR or U937‐PR9 (a zinc‐inducible PML‐RARA cell line derived from U937) cells. p values were obtained by unpaired Student's t test. (G) qRT‐PCR analysis of NRF2, HO‐1 and pri‐miR‐125b‐1 in NRF2‐overexpressing NB4 cells. (H) ChIP‐qPCR analysis of NB4 cells demonstrated that immunoprecipitation (IP) with an anti‐NRF2 antibody resulted in enrichment of the three putative binding sites compared with IP with a control immunoglobulin. (I) The ROS levels in U937‐PCDH‐NC and U937‐PCDH‐PR cells were measured by a DCFH‐DA probe. (J) ROS levels in U937‐PCDH‐PR cells were analyzed after knocking down the NRF2 gene. Data are presented as the means ± SD from at least three independent experiments. Detailed methods are available in Methods in the Supporting Information
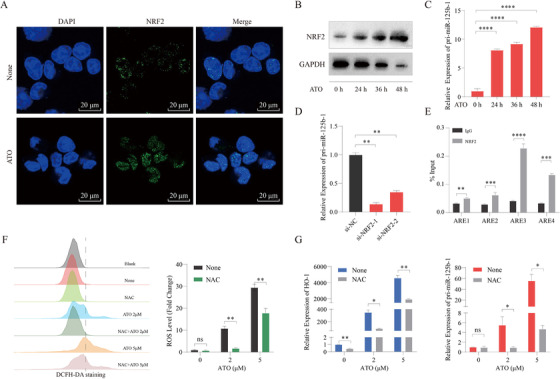
Chemotherapeutic drug treatment‐induced activation of NRF2 leads to upregulation of miR‐125b‐1. (A) Immunofluorescence microscopy after staining with NRF2 (green) and DAPI (blue) demonstrated NRF2 expression in NB4 cells treated with 2 μM ATO for 48 h. None, untreated; Scale bars, 20 μm. (B) Western blot analysis of NRF2 in NB4 cells treated with 2 μM ATO for the indicated times. GAPDH served as loading control. (C) qRT‐PCR analysis of pri‐miR‐125b‐1 in NB4 cells treated with 2 μM ATO for the indicated times. (D) qRT‐PCR analysis of pri‐miR‐125b‐1 in NB4 cells transduced with the indicated siRNA and treated for 48 h with 2 μM ATO. (E) ChIP‐qPCR analysis of NB4 cells treated with 2 μM ATO for 48 h demonstrated that immunoprecipitation (IP) with an anti‐NRF2 antibody resulted in enrichment of the four putative binding sites compared with IP with control immunoglobulin. (F) ROS levels were assessed by flow cytometric analysis. The NB4 cells were pretreated with 5 mM NAC for 4 h and then treated with 2 μM or 5 μM ATO for 24 h. (G) qRT‐PCR analysis of HO‐1 and pri‐miR‐125b‐1 in NB4 cells. The NB4 cells were pretreated with 5 mM NAC for 4 h and then treated with 2 μM or 5 μM ATO for 24 h. The graph represents the mean and SD of three independent experiments. Results were normalized by the respective controls
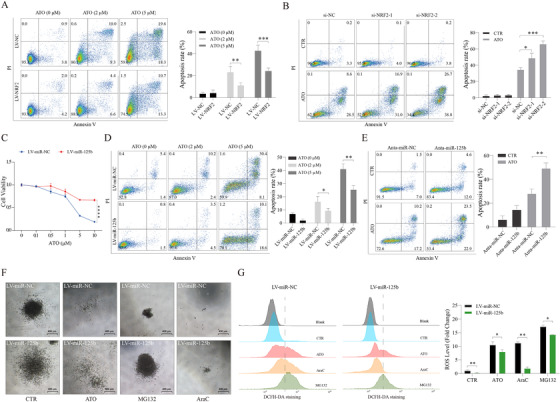
NRF2/miR‐125b‐1 protects against chemotherapy‐induced apoptosis in APL. (A) Flow cytometric analysis of the apoptosis of NB4‐LV‐NC and NB4‐LV‐NRF2 cells treated with 2 μM or 5 μM ATO for 24 h. (B) NB4 cells were transfected with control siRNA or NRF2 siRNA followed by a 48 h ATO (2 μM) treatment. (C) Dose‐response curves from cell viability assays of the NB4‐LV‐miR‐NC and NB4‐LV‐miR‐125b cells treated with the indicated concentration of ATO for 48 h. (D) NB4‐LV‐ NC and NB4‐LV‐miR‐125b cells were treated with 2 μM or 5 μM ATO for 24 h. (E) Treatment of NB4 cells transduced with either miR‐125b antagomir and miRNA antagomir control and treated with 2 μM ATO (48 h). (F) Morphology of colonies formed by NB4‐LV‐miR‐NC and NB4‐LV‐miR‐125b cells treated with 2 μM ATO, 0.1 μM MG132, and 0.1 μM AraC. Scale bars, 400 μm. (G) ROS levels in NB4‐LV‐miR‐NC and NB4‐LV‐miR‐125b cells treated with ATO (5 μM), MG132 (1 μM), or AraC (1 μM) for 24 h. A representative image of three independent experiments is shown. Values are derived from three independent experiments data are reported as mean ± SD
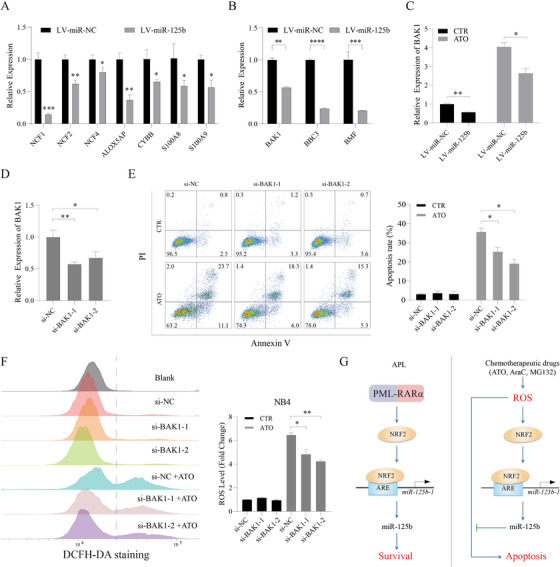
BAK1 is a functional target of miR‐125b in the response of APL cells to chemotherapy. (A) qRT‐PCR analysis of ROS production‐related enzyme genes in NB4‐LV‐miR‐NC and NB4‐LV‐miR‐125b cells. (B) Changes of BMF, BAK1, and BBC3 expression in NB4 cells upon miR‐125b overexpression by qRT‐PCR. (C) qRT‐PCR analysis of BAK1 in NB4‐LV‐miR‐NC and NB4‐LV‐miR‐125b cells treated with 2 μM ATO for 48 h. Knockdown efficiency (D), apoptosis rate (E), and ROS levels (F) in NB4 cells were analyzed after knocking down the BAK1 gene followed by ATO (2 μM) treatment. (G) Proposed model depicting regulation and role of NRF2/miR‐125b‐1 in APL
References
-
- Wang K, Wang P, Shi J, et al. PML/RARalpha targets promoter regions containing PU.1 consensus and RARE half sites in acute promyelocytic leukemia. Cancer Cell. 2010;17:186–197. - PubMed
-
- Rushworth SA, Zaitseva L, Murray MY, Shah NM, Bowles KM, MacEwan DJ. The high Nrf2 expression in human acute myeloid leukemia is driven by NF‐kappaB and underlies its chemo‐resistance. Blood. 2012;120:5188–5198. - PubMed
Publication types
MeSH terms
Substances
LinkOut - more resources
Full Text Sources
Other Literature Sources
Molecular Biology Databases