. 2021 May;11(5):e419.
doi: 10.1002/ctm2.419.

A serum metabolomics analysis reveals a panel of screening metabolic biomarkers for esophageal squamous cell carcinoma

Affiliations

A serum metabolomics analysis reveals a panel of screening metabolic biomarkers for esophageal squamous cell carcinoma

Jiali Lv et al. Clin Transl Med. 2021 May.
No abstract available


Conflict of interest statement

The authors declare no conflict of interest.

Figures

FIGURE 1
FIGURE 1
Metabolic profile analysis and early ESCC screening model. (A) Study design; (B) PCA score plot discriminating ESCC screening‐positive subjects and healthy controls; (C) PLS‐DA three‐dimensional scores plot discriminating ESCC screening‐positive subjects and healthy controls; (D) validation plot obtained from 200 permutation tests; (E) ROC curve for random forest model combing 14 metabolites; (F) decision curves for 14 metabolites to predict ESCC screening‐positive subjects; and (G) calibration curves for 14 metabolites to predict ESCC screening‐positive subjects
FIGURE 2
FIGURE 2
ESCC screening model composed with 8 metabolites. (A) The typical UPLC‐QTOF/MS chromatograms; (B) heatmap plot of 14 metabolites confirmed using standard references in the validation data; (C) heatmap plot of 56 metabolites interpreted according to their MS/MS spectra in the validation data; (D) best subset selection for metabolites interpreted according to their MS/MS spectra; (E) ROC analysis of random forest model for eight metabolites; (F) decision curves for eight metabolites to predict ESCC screening‐positive subjects; and (G) calibration curves for eight metabolites to predict ESCC screening‐positive subjects
FIGURE 3
FIGURE 3
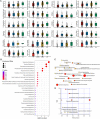
Enriched KEGG pathways analysis. (A) Boxplot of 22 differential metabolites; (B) metabolite sets enrichment overview; (C) network enrichment analysis; and (D) metabolic pathways associated with ESCC

Similar articles

Cited by

References

    1. Roshandel G, Nourouzi A, Pourshams A, Semnani S, Merat S, Khoshnia M. Endoscopic screening for esophageal squamous cell carcinoma. Arch Iran Med. 2013;16(6):351‐357. - PubMed
    1. Zhu X, Zhang SH, Zhang KH, Li BM, Chen J. Value of endoscopic methylene blue and Lugol's iodine double staining and detection of GST‐Pi and telomerase in the early diagnosis of esophageal carcinoma. World J Gastroenterol. 2005;11(39):6090‐6095. - PMC - PubMed
    1. di Pietro M, Canto MI, Fitzgerald RC. Endoscopic management of early adenocarcinoma and squamous cell carcinoma of the esophagus: screening, diagnosis, and therapy. Gastroenterology. 2018;154(2):421‐436. - PMC - PubMed
    1. Vaughan TL, Fitzgerald RC. Precision prevention of oesophageal adenocarcinoma. Nat Rev Gastroenterol Hepatol. 2015;12(4):243‐248. - PMC - PubMed
    1. Dong Z, Tang P, Li L, Wang G. The strategy for esophageal cancer control in high‐risk areas of China. Jpn J Clin Oncol. 2002;32(Suppl):S10‐S12. - PubMed

Publication types

Substances

LinkOut - more resources