

Accuracy of Digital Breast Tomosynthesis for Detecting Breast Cancer in the Diagnostic Setting: A Systematic Review and Meta-Analysis
- PMID: 34047504
- PMCID: PMC8316775
- DOI: 10.3348/kjr.2020.1227
Accuracy of Digital Breast Tomosynthesis for Detecting Breast Cancer in the Diagnostic Setting: A Systematic Review and Meta-Analysis
Abstract
Objective: To compare the accuracy for detecting breast cancer in the diagnostic setting between the use of digital breast tomosynthesis (DBT), defined as DBT alone or combined DBT and digital mammography (DM), and the use of DM alone through a systematic review and meta-analysis.
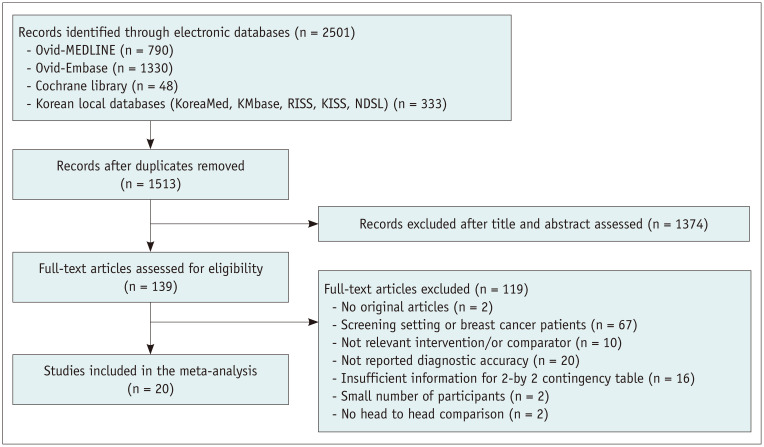
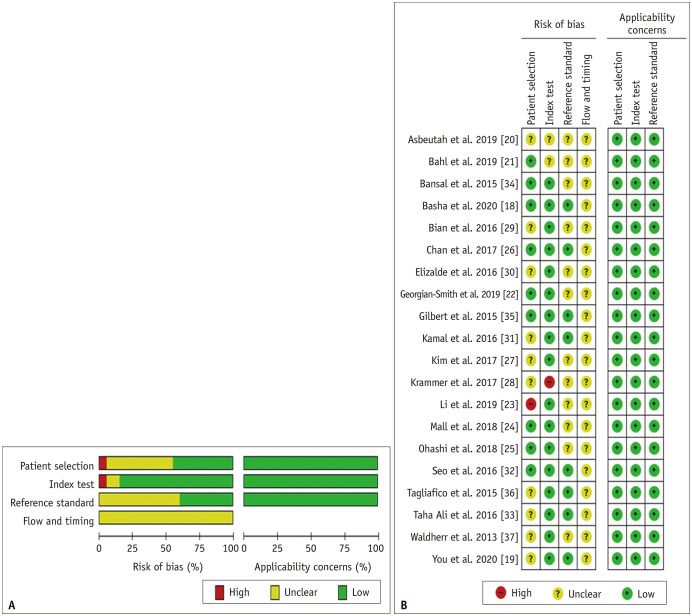
Materials and methods: Ovid-MEDLINE, Ovid-Embase, Cochrane Library and five Korean local databases were searched for articles published until March 25, 2020. We selected studies that reported diagnostic accuracy in women who were recalled after screening or symptomatic. Study quality was assessed using the Quality Assessment of Diagnostic Accuracy Studies-2 tool. A bivariate random effects model was used to estimate pooled sensitivity and specificity. We compared the diagnostic accuracy between DBT and DM alone using meta-regression and subgroup analyses by modality of intervention, country, existence of calcifications, breast density, Breast Imaging Reporting and Data System category threshold, study design, protocol for participant sampling, sample size, reason for diagnostic examination, and number of readers who interpreted the studies.
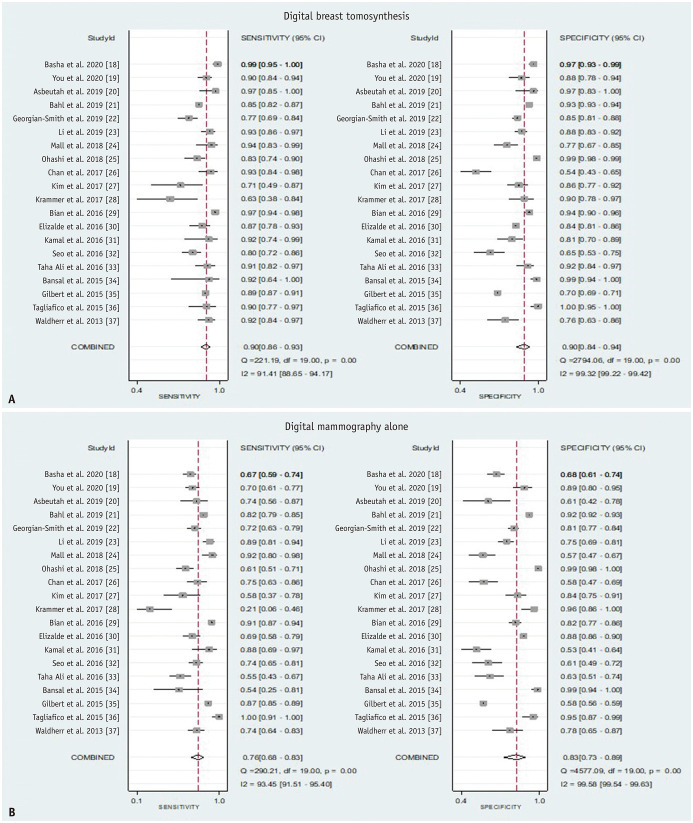
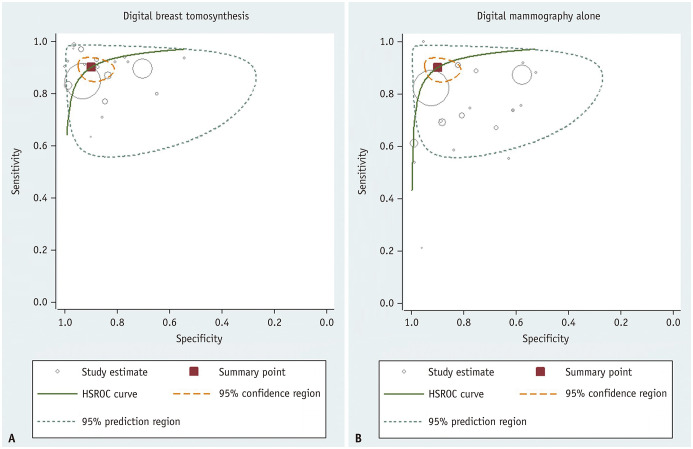
Results: Twenty studies (n = 44513) that compared DBT and DM alone were included. The pooled sensitivity and specificity were 0.90 (95% confidence interval [CI] 0.86-0.93) and 0.90 (95% CI 0.84-0.94), respectively, for DBT, which were higher than 0.76 (95% CI 0.68-0.83) and 0.83 (95% CI 0.73-0.89), respectively, for DM alone (p < 0.001). The area under the summary receiver operating characteristics curve was 0.95 (95% CI 0.93-0.97) for DBT and 0.86 (95% CI 0.82-0.88) for DM alone. The higher sensitivity and specificity of DBT than DM alone were consistently noted in most subgroup and meta-regression analyses.
Conclusion: Use of DBT was more accurate than DM alone for the diagnosis of breast cancer. Women with clinical symptoms or abnormal screening findings could be more effectively evaluated for breast cancer using DBT, which has a superior diagnostic performance compared to DM alone.
Keywords: Breast cancer; Breast tomosynthesis; Mammography; Meta-analysis; Performance.
Copyright © 2021 The Korean Society of Radiology.
Conflict of interest statement
The authors have no potential conflicts of interest to disclose.
Figures
References
-
- American College of Radiology. Practice guideline for the performance of screening and diagnostic mammography. Acr.org Web site. Published 2013. [Accessed June 17, 2020]. https://www.acr.org/-/media/ACR/Files/Practice-Parameters/Screen-Diag-Ma....
-
- Boyd NF, Guo H, Martin LJ, Sun L, Stone J, Fishell E, et al. Mammographic density and the risk and detection of breast cancer. N Engl J Med. 2007;356:227–236. - PubMed
-
- Carney PA, Miglioretti DL, Yankaskas BC, Kerlikowske K, Rosenberg R, Rutter CM, et al. Individual and combined effects of age, breast density, and hormone replacement therapy use on the accuracy of screening mammography. Ann Intern Med. 2003;138:168–175. - PubMed
-
- D'Orsi CJ, Sickles EA, Mendelson EB, Morris EA. ACR BI-RADS atlas, breast imaging reporting and data system. 5th ed. Reston, VA: American College of Radiology; 2013.
-
- Harvey JA, Nicholson BT, Cohen MA. Finding early invasive breast cancers: a practical approach. Radiology. 2008;248:61–76. - PubMed
Publication types
MeSH terms
LinkOut - more resources
Full Text Sources
Other Literature Sources
Medical
