

Case Study of the Response of N6-Methyladenine DNA Modification to Environmental Stressors in the Unicellular Eukaryote Tetrahymena thermophila
- PMID: 34047647
- PMCID: PMC8265677
- DOI: 10.1128/mSphere.01208-20
Case Study of the Response of N6-Methyladenine DNA Modification to Environmental Stressors in the Unicellular Eukaryote Tetrahymena thermophila
Abstract
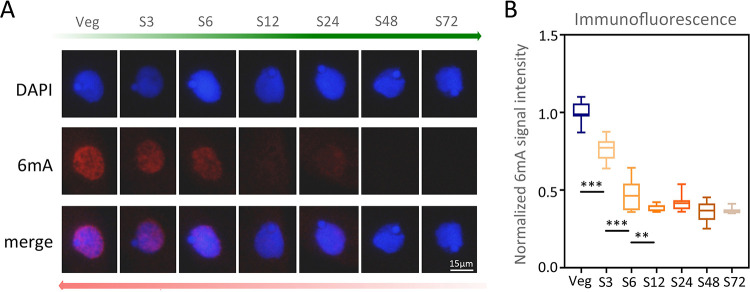
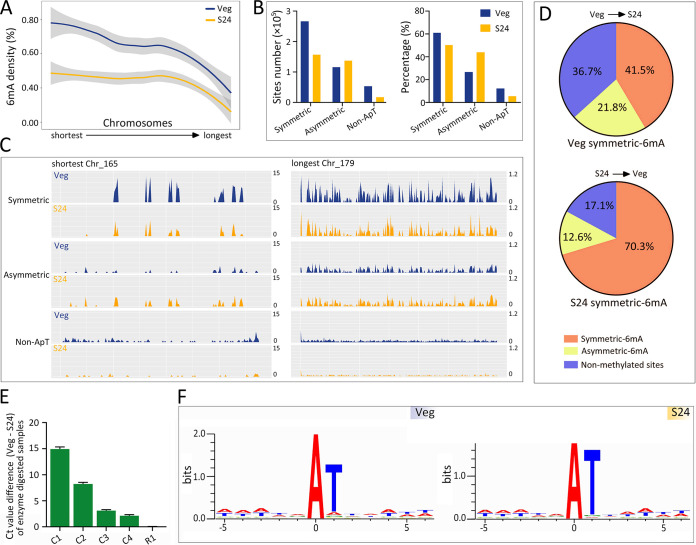
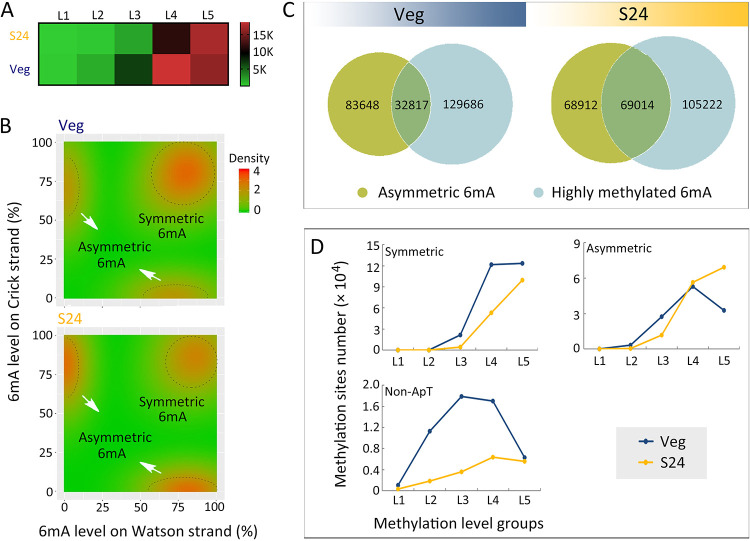
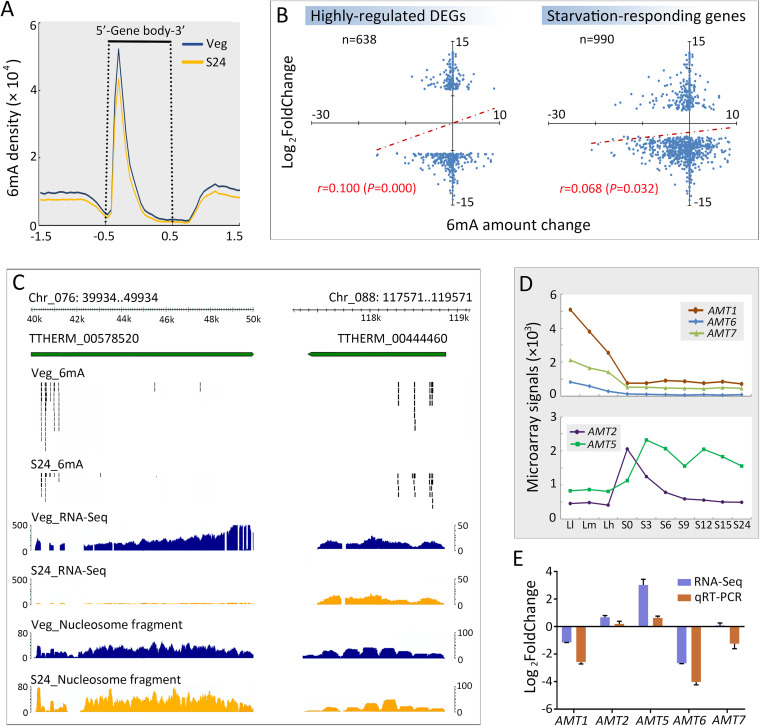
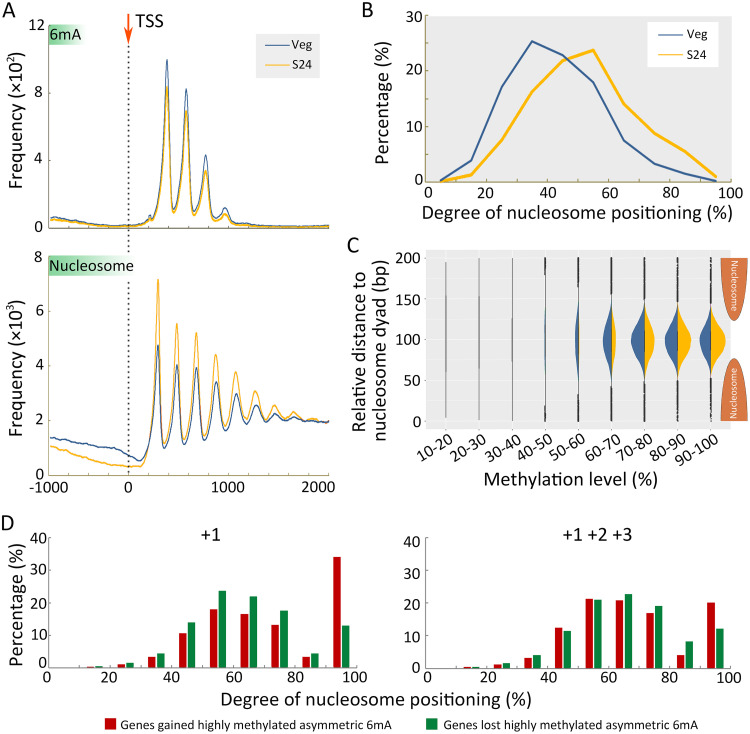
Rediscovered as a potential epigenetic mark, N6-methyladenine DNA modification (6mA) was recently reported to be sensitive to environmental stressors in several multicellular eukaryotes. As 6mA distribution and function differ significantly in multicellular and unicellular organisms, whether and how 6mA in unicellular eukaryotes responds to environmental stress remains elusive. Here, we characterized the dynamic changes of 6mA under starvation in the unicellular model organism Tetrahymena thermophila. Single-molecule, real-time (SMRT) sequencing reveals that DNA 6mA levels in starved cells are significantly reduced, especially symmetric 6mA, compared to those in vegetatively growing cells. Despite a global 6mA reduction, the fraction of asymmetric 6mA with a high methylation level was increased, which might be the driving force for stronger nucleosome positioning in starved cells. Starvation affects expression of many metabolism-related genes, the expression level change of which is associated with the amount of 6mA change, thereby linking 6mA with global transcription and starvation adaptation. The reduction of symmetric 6mA and the increase of asymmetric 6mA coincide with the downregulation of AMT1 and upregulation of AMT2 and AMT5, which are supposedly the MT-A70 methyltransferases required for symmetric and asymmetric 6mA, respectively. These results demonstrated that a regulated 6mA response to environmental cues is evolutionarily conserved in eukaryotes. IMPORTANCE Increasing evidence indicated that 6mA could respond to environmental stressors in multicellular eukaryotes. As 6mA distribution and function differ significantly in multicellular and unicellular organisms, whether and how 6mA in unicellular eukaryotes responds to environmental stress remains elusive. In the present work, we characterized the dynamic changes of 6mA under starvation in the unicellular model organism Tetrahymena thermophila. Our results provide insights into how Tetrahymena fine-tunes its 6mA level and composition upon starvation, suggesting that a regulated 6mA response to environmental cues is evolutionarily conserved in eukaryotes.
Keywords: 6mA; Tetrahymena thermophila; starvation; unicellular eukaryote.
Figures
Similar articles
-
Identification and characterization of the de novo methyltransferases for eukaryotic N6-methyladenine (6mA).Sci Adv. 2025 May 16;11(20):eadq4623. doi: 10.1126/sciadv.adq4623. Epub 2025 May 14. Sci Adv. 2025. PMID: 40367178 Free PMC article.
-
N6-methyladenine DNA modification in the unicellular eukaryotic organism Tetrahymena thermophila.Eur J Protistol. 2017 Apr;58:94-102. doi: 10.1016/j.ejop.2016.12.003. Epub 2016 Dec 23. Eur J Protistol. 2017. PMID: 28135687 Review.
-
Methyl-dependent auto-regulation of the DNA N6-adenine methyltransferase AMT1 in the unicellular eukaryote Tetrahymena thermophila.Nucleic Acids Res. 2025 Jan 24;53(3):gkaf022. doi: 10.1093/nar/gkaf022. Nucleic Acids Res. 2025. PMID: 39868535 Free PMC article.
-
Semiconservative transmission of DNA N 6-adenine methylation in a unicellular eukaryote.Genome Res. 2024 Jun 25;34(5):740-756. doi: 10.1101/gr.277843.123. Genome Res. 2024. PMID: 38744529 Free PMC article.
-
The epigenetic roles of DNA N6-Methyladenine (6mA) modification in eukaryotes.Cancer Lett. 2020 Dec 1;494:40-46. doi: 10.1016/j.canlet.2020.08.025. Epub 2020 Aug 23. Cancer Lett. 2020. PMID: 32846189 Review.
Cited by
-
Comparative genome analysis of three euplotid protists provides insights into the evolution of nanochromosomes in unicellular eukaryotic organisms.Mar Life Sci Technol. 2023 May 28;5(3):300-315. doi: 10.1007/s42995-023-00175-0. eCollection 2023 Aug. Mar Life Sci Technol. 2023. PMID: 37637252 Free PMC article.
-
Unveiling an ancient whole-genome duplication event in Stentor, the model unicellular eukaryotes.Sci China Life Sci. 2025 Mar;68(3):825-835. doi: 10.1007/s11427-024-2651-2. Epub 2025 Jan 8. Sci China Life Sci. 2025. PMID: 39821159
-
A specialized TFIIB is required for transcription of transposon-targeting noncoding RNAs.Nucleic Acids Res. 2025 May 10;53(9):gkaf427. doi: 10.1093/nar/gkaf427. Nucleic Acids Res. 2025. PMID: 40377217 Free PMC article.
-
A Genome-Wide Association Study of Anti-Müllerian Hormone (AMH) Levels in Samoan Women.Genes (Basel). 2025 Jun 30;16(7):793. doi: 10.3390/genes16070793. Genes (Basel). 2025. PMID: 40725450 Free PMC article.
-
The micronuclear histone H3 clipping in the unicellular eukaryote Tetrahymena thermophila.Mar Life Sci Technol. 2022 Nov 24;4(4):584-594. doi: 10.1007/s42995-022-00151-0. eCollection 2022 Nov. Mar Life Sci Technol. 2022. PMID: 37078088 Free PMC article. Review.
References
-
- Zhang Q, Liang Z, Cui X, Ji C, Li Y, Zhang P, Liu J, Riaz A, Yao P, Liu M, Wang Y, Lu T, Yu H, Yang D, Zheng H, Gu X. 2018. N6-methyladenine DNA methylation in Japonica and Indica rice genomes and its association with gene expression, plant development, and stress responses. Mol Plant 11:1492–1508. doi:10.1016/j.molp.2018.11.005. - DOI - PubMed
Publication types
MeSH terms
Substances
LinkOut - more resources
Full Text Sources
Research Materials
