. 2021 May 28:10:e69431.
doi: 10.7554/eLife.69431.

Inflammation drives alternative first exon usage to regulate immune genes including a novel iron-regulated isoform of Aim2

Affiliations

Inflammation drives alternative first exon usage to regulate immune genes including a novel iron-regulated isoform of Aim2

Elektra K Robinson et al. Elife. .

Abstract

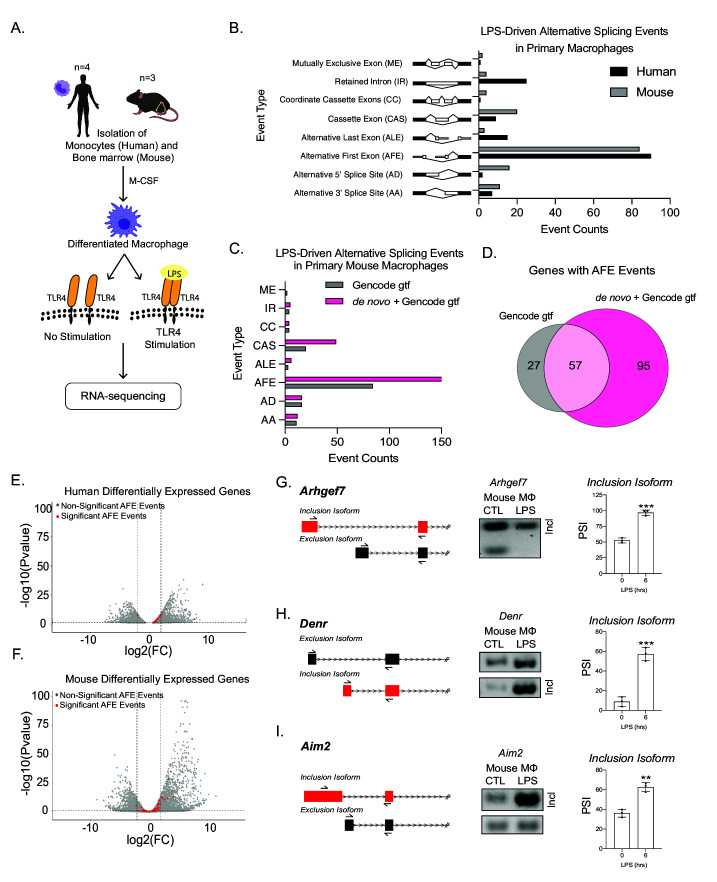
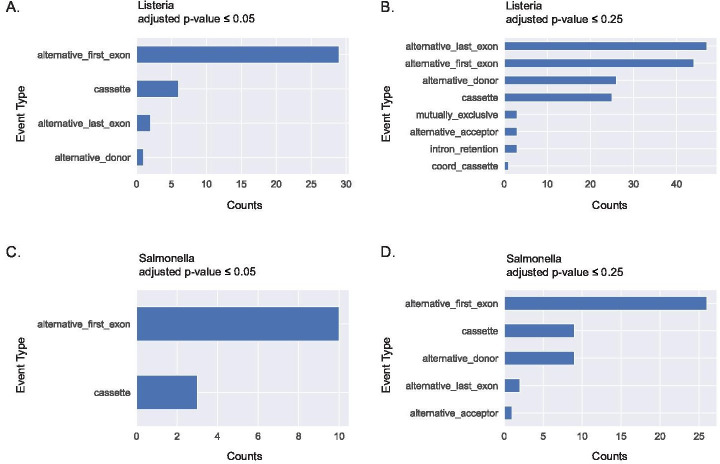
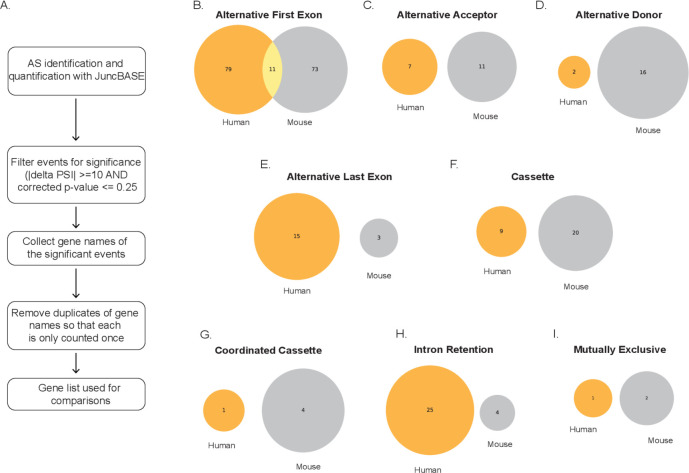
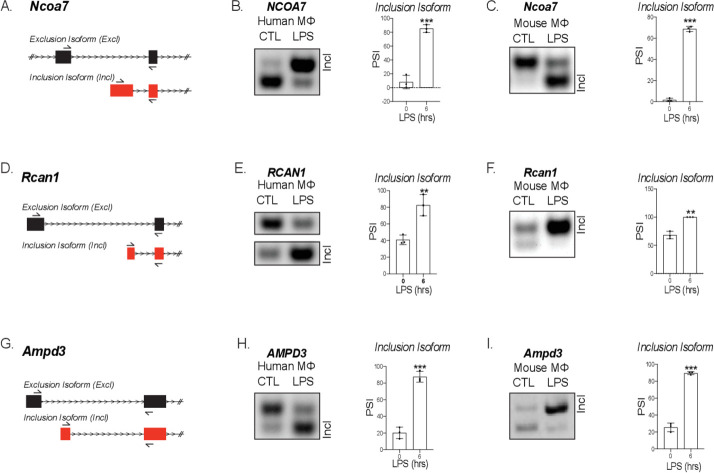
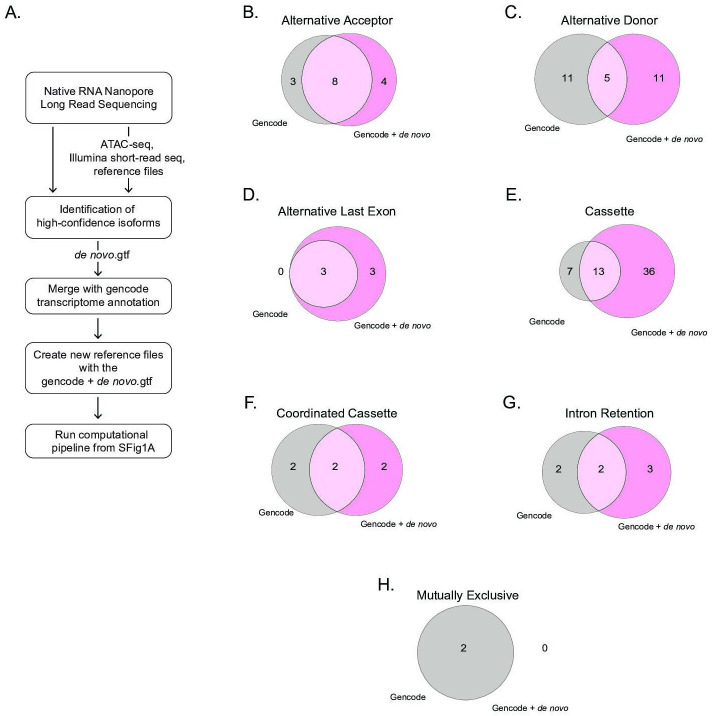
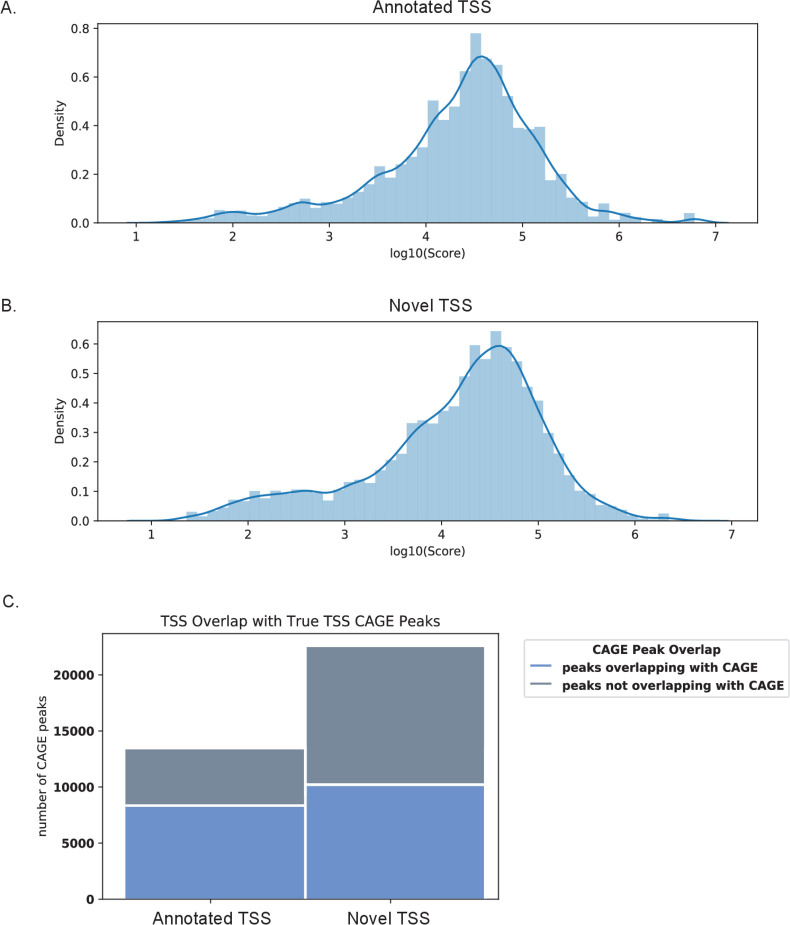
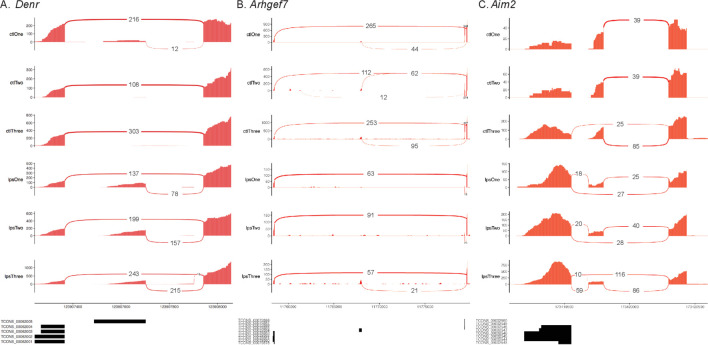
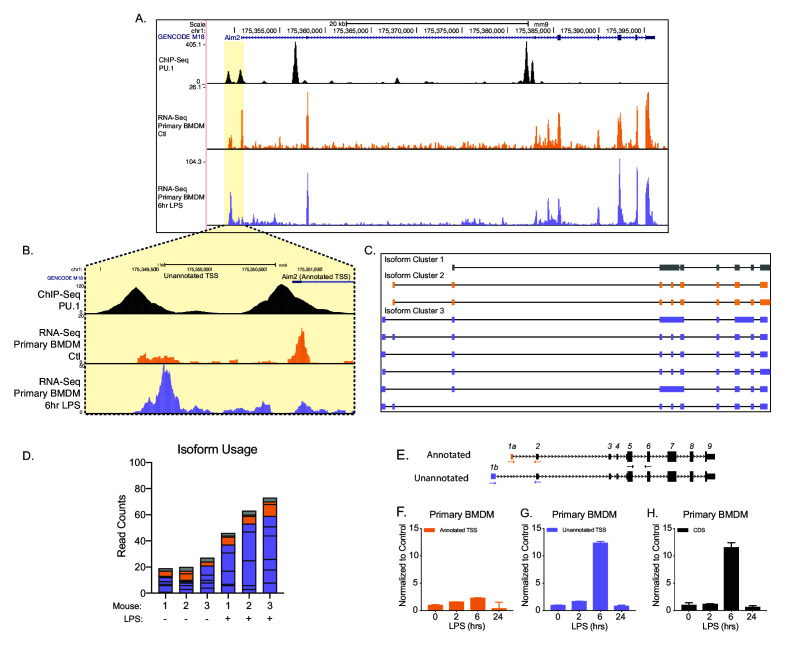
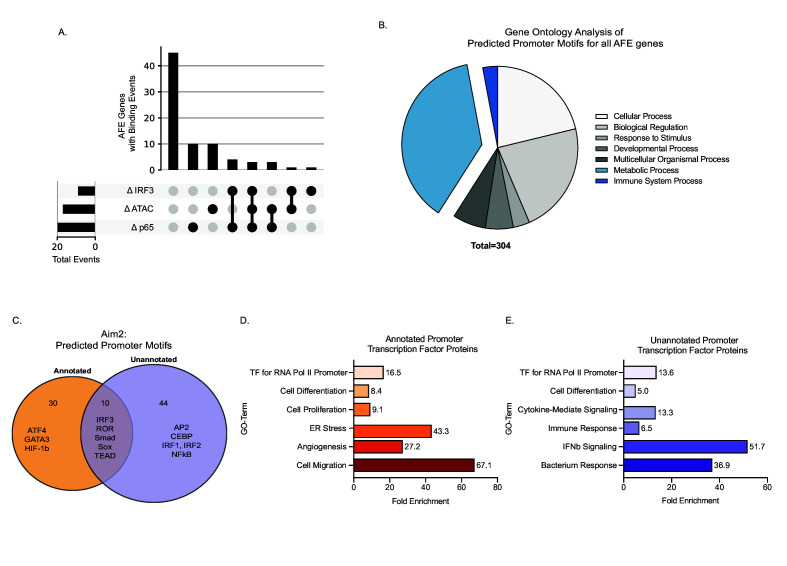
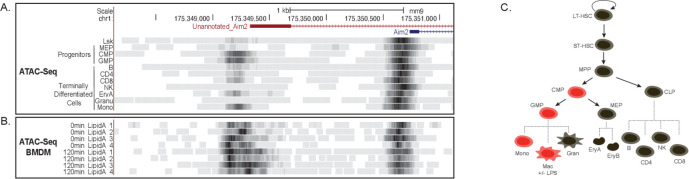
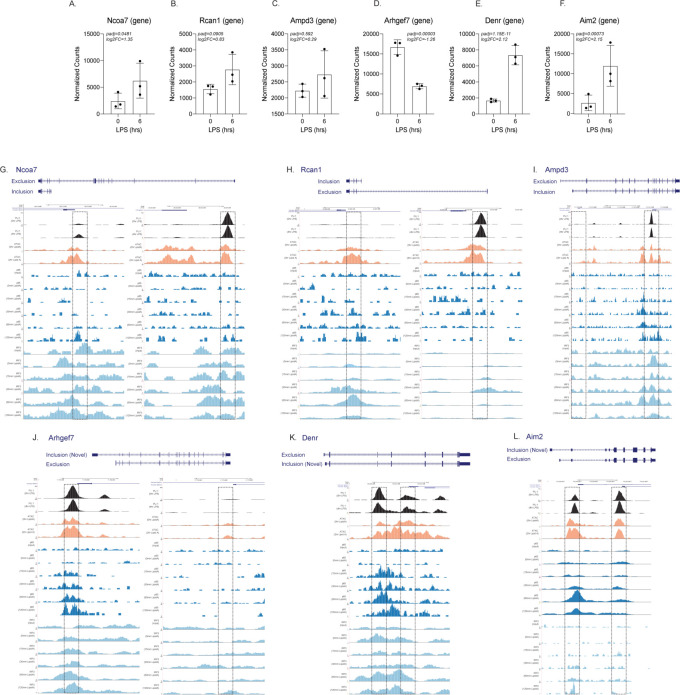
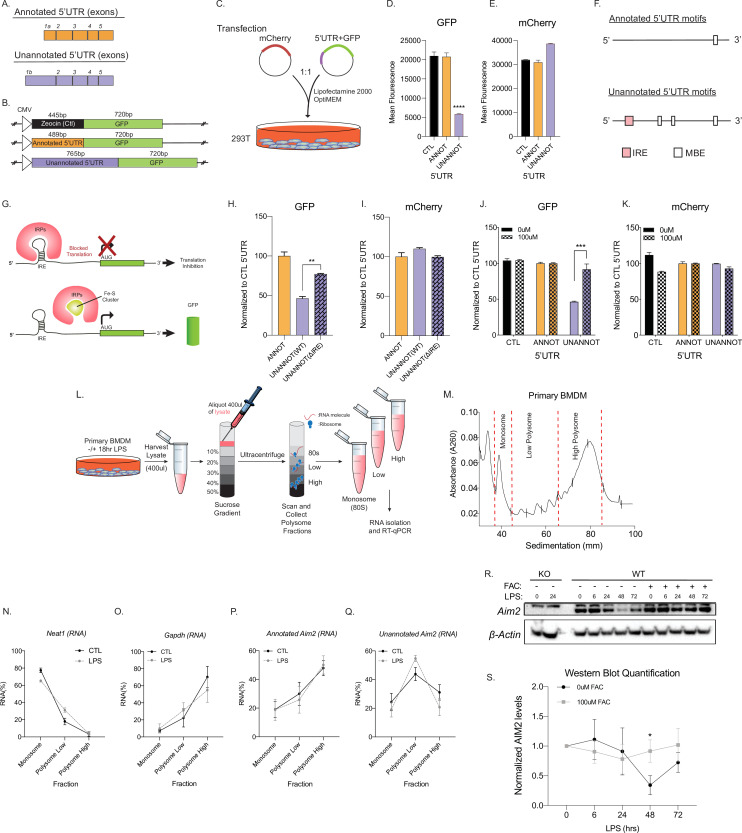
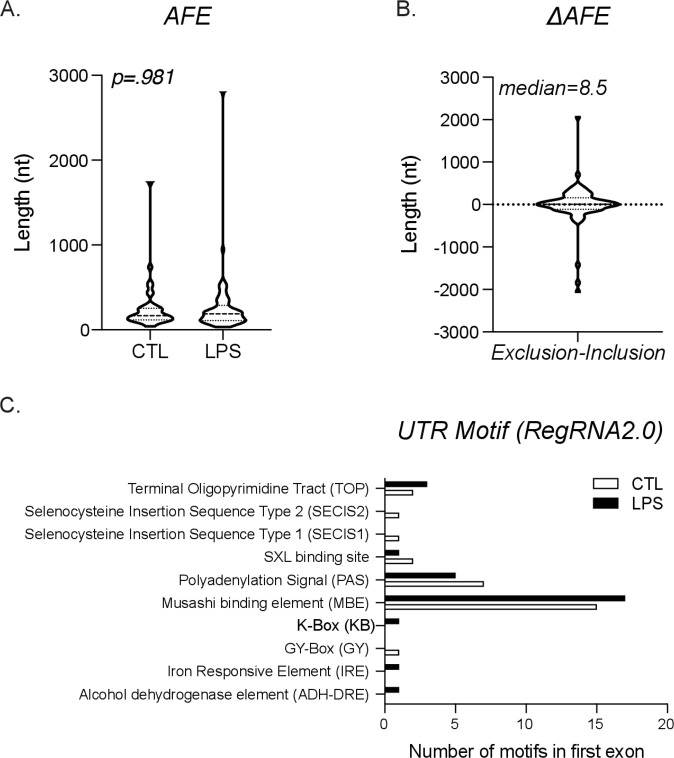
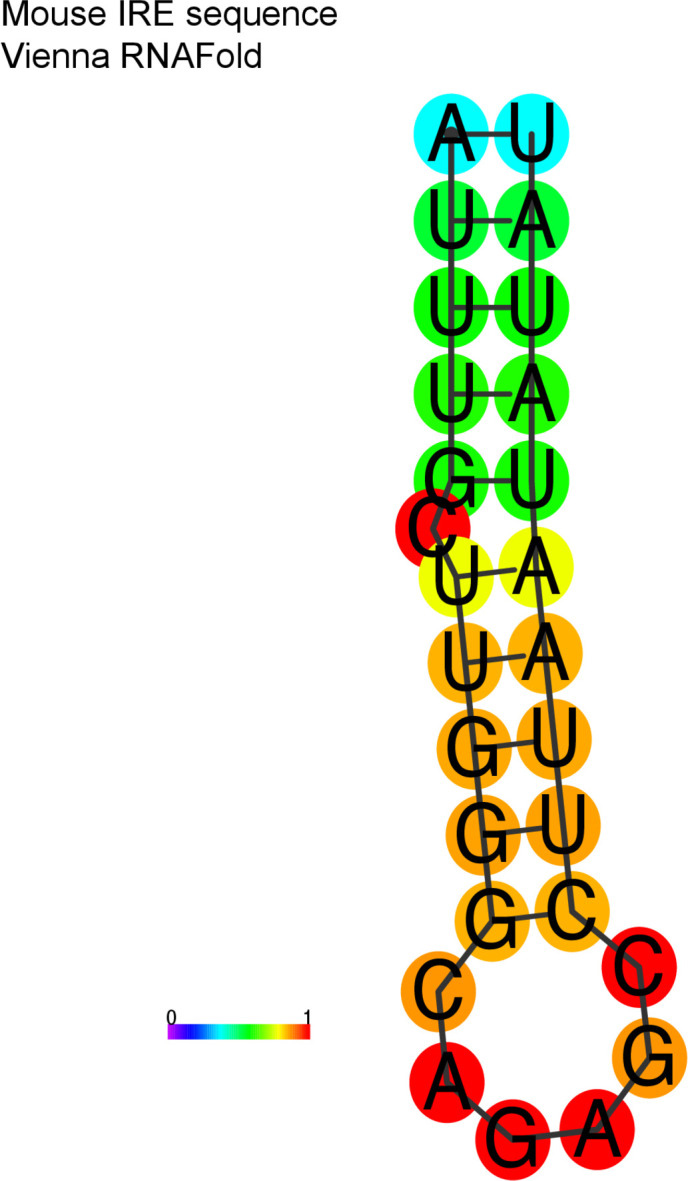
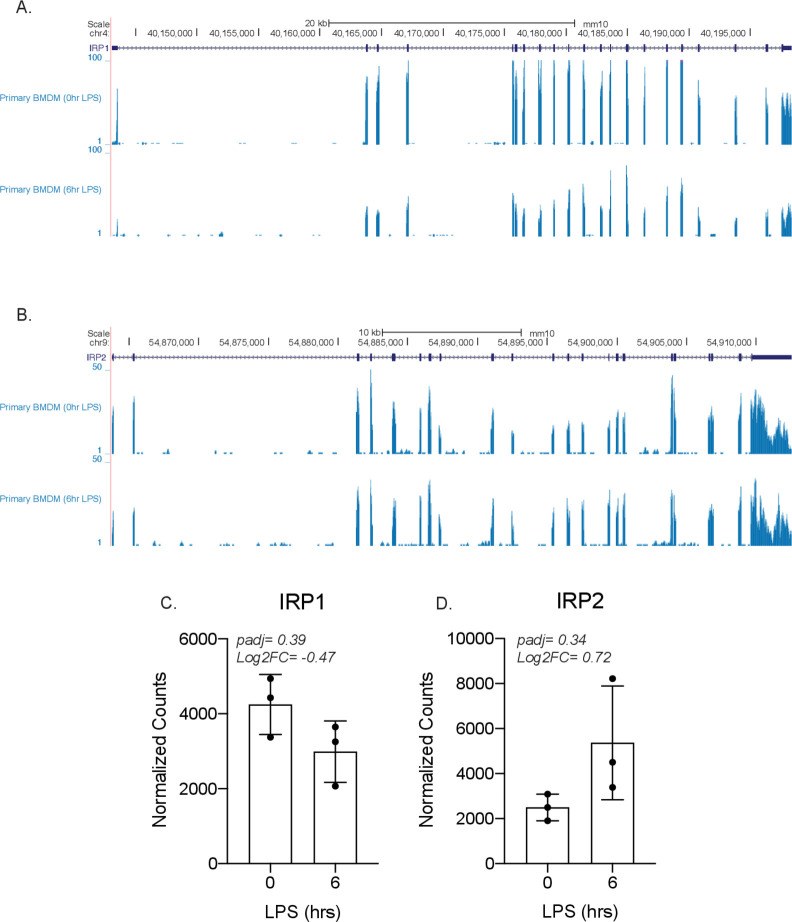
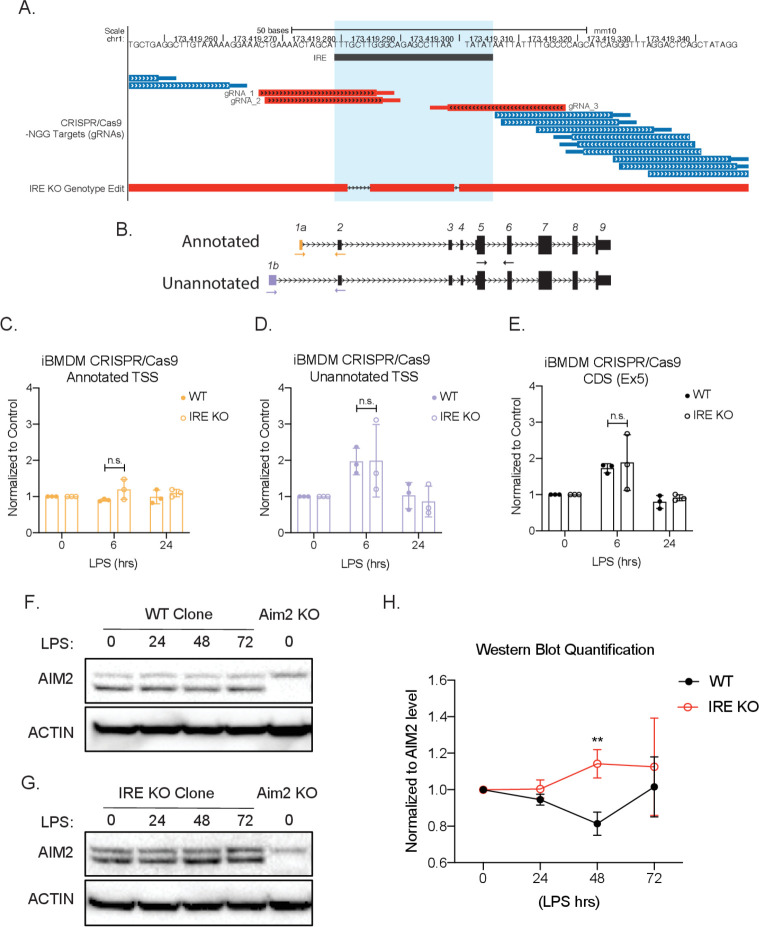
Determining the layers of gene regulation within the innate immune response is critical to our understanding of the cellular responses to infection and dysregulation in disease. We identified a conserved mechanism of gene regulation in human and mouse via changes in alternative first exon (AFE) usage following inflammation, resulting in changes to the isoforms produced. Of these AFE events, we identified 95 unannotated transcription start sites in mice using a de novo transcriptome generated by long-read native RNA-sequencing, one of which is in the cytosolic receptor for dsDNA and known inflammatory inducible gene, Aim2. We show that this unannotated AFE isoform of Aim2 is the predominant isoform expressed during inflammation and contains an iron-responsive element in its 5'UTR enabling mRNA translation to be regulated by iron levels. This work highlights the importance of examining alternative isoform changes and translational regulation in the innate immune response and uncovers novel regulatory mechanisms of Aim2.

Keywords: Macrophages; genetics; genomics; human; immunology; inflammation; mouse; splicing.


Conflict of interest statement

ER, PJ, SC, MC, VS, RS, BS, RA, MJ, SC, SC No competing interests declared, MA holds options in Oxford Nanopore Technologies (ONT), is a paid consultant to ONT, received reimbursement for travel, accommodation and conference fees to speak at events organized by ONT,received research funding from ONT and is an inventor on 11 UC patents licensed to ONT (6,267,872, 6,465,193, 6,746,594, 6,936,433, 7,060,50, 8,500,982, 8,679,747, 9,481,908, 9,797,013, 10,059,988, and 10,081,835), AB received reimbursement for travel, accommodation and conference fees to speak at events organized by Oxford Nanopore Technologies (ONT)

Figures

Figure 1.
Figure 1.. Global profiling of the cellular alternative splicing landscape in human and mouse macrophages post-inflammatory.
(A) Diagram of RNA-seq library generation. (B) Categorization of significant splicing events in human and mouse macrophage. (C) Categorization of significant splicing events found in mouse bone marrow-derived macrophages (BMDM) ±6 hr lipopolysaccharide by using either the Gencode annotation or the GENCODE+ de novo annotation. (D) Venn diagram representing unique and common genes with alternative first exon (AFE) events found in RNA-seq of primary BMDMs post-inflammatory stimulation using the Gencode annotation or the GENCODE+ de novo annotation. Volcano plots of all differentially expressed genes from RNA-seq of either human (E) or mouse (F) macrophages. Genes highlighted in red undergo significant AFE changes following inflammation. Schematic of AFE inclusion and exclusion isoforms, followed by RT-PCR gel results and percent spliced in calculation for Argehf7 (G) Denr (H), and Aim2 (I), was performed in biological triplicates, p-value assessed using Student’s t-test.
Figure 1—figure supplement 1.
Figure 1—figure supplement 1.. Computational pipeline and comparison of t-test and DRIMSeq alternative splicing events.
(A) Bioinformatic pipeline for human and mouse RNA-seq data. Alternative splicing event-type classification of significant differential splicing events (|ΔPSI| ≥ 10 and corrected p-value ≤ 0.25) in human and mouse macrophages ± lipopolysaccharide as identified and quantified using the (B) t-test with JuncBASE or (C) the Dirichlet-multinomial framework applied by DRIMSeq. Venn diagrams representing the unique and overlapping alternative first exon events from (D) human or (E) mouse macrophage alternative splicing analysis.
Figure 1—figure supplement 2.
Figure 1—figure supplement 2.. Alternative first exon events remain prevalent amongst ranked alternative splicing events in human macrophages.
(A, B) Ranking of the top 5%, (C, D) 10%, (E, F) 15%, (G, H) 20%, and (I, J) 25% of alternative splicing events based on p-value of events as classified by JuncBASE and DRIMSeq in human macrophage cells following lipopolysaccharide stimulation.
Figure 1—figure supplement 3.
Figure 1—figure supplement 3.. Alternative first exon events remain prevalent amongst ranked alternative splicing events in mouse macrophages.
(A, B) Ranking of the top 5%, (C–, D) 10%, (E, F) 15%, (G, H) 20%, and (I, J) 25% of alternative splicing events based on p-value of events as classified by JuncBASE and DRIMSeq in human macrophage cells following lipopolysaccharide stimulation.
Figure 1—figure supplement 4.
Figure 1—figure supplement 4.. Alternative first exon usage is the top splicing event when using JuncBASE to identify and quantify alternative splicing events from primary human macrophages stimulated with Listeria and Salmonella for 24 hr.
Significant alternative splicing events identified and categorized by event type using an adjusted p-value cutoff ≤0.05 (A) and a cutoff of ≤0.25 (B) following Listeria infection. Significant alternative splicing events identified and categorized by event type using an adjusted p-value cutoff of ≤0.05 (C) and a cutoff of ≤0.25 (D) following Salmonella infection. Data acquired from GSE73502.
Figure 1—figure supplement 5.
Figure 1—figure supplement 5.. Conserved genes identified through alternative splicing events between human and mouse using gencode transcriptome.
(A) Schematic depicting how gene lists were generated from exon events. Venn diagrams denoting unique and overlapping genes with significant splicing events in human (orange) and mouse (gray) for (B) alternative first exon, (C) alternative acceptor, (D) alternative donor, (E) alternative last exon, (F) cassette, (G) coordinated cassette, (H) intron retention, and (I) mutually exclusive. All have conserved splicing events when analyzing lipopolysaccharide-stimulated primary macrophage.
Figure 1—figure supplement 6.
Figure 1—figure supplement 6.. Validation of mouse and human alternative first exon events.
(A) mRNA transcript diagram of the exclusion and inclusion isoform of Ncoa7 for mouse and human. RT-PCR of human (B) and mouse (C), Rcan1 (D–F) and Ampd3 (G–I) with percent spliced in calculation.
Figure 1—figure supplement 7.
Figure 1—figure supplement 7.. Comparison of alternative splicing events identified using the gencode transcriptome or the GENCODE+ de novo transcriptome.
(A) Schematic describing the steps taken to analyze alternative splicing using either the publicly available gencode.gtf or our GENCODE+ de novo.gtf. Venn diagrams show unique and common genes when mapping RNA-sequencing libraries using the publicly available gencode gtf file and the de novo transcriptome file using nanopore sequencing for alternative splicing events including (B) alternative acceptor, (C) alternative donor, (D) alternative last exon, (E) cassette, (F) coordinated cassette, (G) intron retention, and (H) mutually exclusive.
Figure 1—figure supplement 8.
Figure 1—figure supplement 8.. CAGE scores support validity of novel transcription start sites (TSS) identified by nanopore sequencing.
CAGE scores of CAGE peaks overlapping the 5′UTR region of (A) annotated and (B) novel transcript isoforms. (C) Bar graph of TSS peaks overlapping and not overlapping with CAGE data.
Figure 1—figure supplement 9.
Figure 1—figure supplement 9.. Validated unannotated alternative first exon (AFE) isoforms.
Sashimi plots showing AFE usage in (A) Denr, (B) Arhgef7, and (C) Aim2 involving novel isoforms identified using nanopore sequencing.
Figure 2.
Figure 2.. Identification of an unannotated promoter in Aim2.
(A, B) The top track, in black, represents ChIP-seq data for a macrophage-specific transcription factor, PU.1. Peaks represent possible promoter regions; two distinct peaks of equal height are present at the annotated transcriptional start site (TSS) for Aim2 and about 1 kb upstream of the transcriptional start site. The middle track, in orange, represents basal transcription in bone marrow-derived macrophages (BMDMs), while the bottom track, in purple, represents active transcription in BMDMs 6 hr lipopolysaccharide (LPS) post treatment. (C) Aim2 transcript isoforms identified in BMDMs by native RNA long-read sequencing through FLAIR analysis. Transcripts are categorized by promoter, denoted by gray, orange, or purple. (D) The bar chart represents data from long-read sequencing showing the abundance of each transcript isoform from BMDMs ±6 hr LPS. (E–H) qRT-PCR was performed in biological triplicate, on primary BMDM RNA extracts that had been stimulated with LPS for indicated time points.
Figure 3.
Figure 3.. Novel inflammatory promoter of Aim2 is regulated by IRF3 and p65.
(A) UpSet plot showing the number of alternative first exon (AFE) events out of 77 total that have differential transcription factor (TF) binding and differential chromatin accessibility and all combinations of these sets. (B) Pie chart representing the gene ontology of TF motifs identified through analysis motif enrichment (AME) tool of all AFE promoter sequences. (C) Venn diagram of all motifs defined using HOMER analysis within the annotated and unannotated promoter regions. (D, E) DAVID analysis examining the gene ontology of TFs at the annotated and unannotated promoters of Aim2.
Figure 3—figure supplement 1.
Figure 3—figure supplement 1.. Chromatin remodeling not a mechanism driving novel Aim2 isoform.
(A) mm9 genome browser shot between chr1:175,348,283–175,351,422 indicating ATAC-seq of cells from hematopoietic tree. (B) mm9 genome browser shot between chr1:175,348,283–175,351,422 indicating ATAC-seq of bone marrow-derived macrophages (BMDMs) ±Lipid A for 2 hrs. (C) Schematic summarizing promoter accessibility of novel Aim2 isoform, red = accessible and black = not accessible.
Figure 3—figure supplement 2.
Figure 3—figure supplement 2.. Genome browser images of ChIP-seq and ATAC-seq for both the promoters of CTL and lipopolysaccharide (LPS) specific alternative first exon isoforms.
The normalized counts and DESeq2 analysis of Ncoa7 (A), Rcan1 (B), Ampd3 (C), Arhgef7 (D), Denr (E), and Aim2 (F) are represented in a bar graph in triplicate. Genome browser images are taken for the CTL and LPS promoters highlighted in yellow of Ncoa7 (G), Rcan1 (H), Ampd3 (I), Arhgef7 (J), Denr (K), and Aim2 (L). All tracks are next-generation sequencing data from bone marrow-derived macrophages. The top track (in black) is ChIP-seq data of PU.1 from unstimulated cells, while the second track is PU.1 ChIP-seq data from LPS-stimulated cells (GSE109965). The next two tracks (in orange) are of ATAC-seq data from either unstimulated or LPS-stimulated cells (GSE74191). The next five tracks (dark blue) are p65 ChIP-seq data from the input, 0 min KLA, 15 min KLA, 30 min KLA, 60 min KLA, or 120 min KLA stimulation (GSE67343). Finally, the last five tracks (in light blue) are IRF3 ChIP-seq data from the input, 0 min KLA, 15 min KLA, 30 min KLA, 60 min KLA, or 120 min KLA stimulation (GSE67343).
Figure 4.
Figure 4.. Unannotated 5′ untranslated region (UTR) of Aim2 negatively regulates translation through a single iron-responsive element (IRE).
(A) Schematic of annotated and unannotated 5′UTR of most prevalent Aim2 isoforms in mouse macrophages. (B) Diagram of cloning strategy of Aim2’s 5′UTR in GFP plasmid. (C) Transfection strategy of 5′UTR-GFP plasmids co-transfected with an mCherry control plasmid at a 1–1 ratio in 293T cells. (D, E) Flow cytometry of 293T cells 72 hr post-transfection with control annotated and unannotated 5′UTR of Aim2 to measure GFP and mCherry (Ctl) protein fluorescence. (F) Using RegRNA2.0, a single IRE was found in the alternative 5′UTR, in addition to multiple Musashi binding elements (MBEs). (G) Diagram of how an IRE functions in the cytoplasm of a cell within a 5′UTR. With low or normal levels of iron, iron binding proteins (IRP1 or IRP2) bind to IRE and block translation. During high levels of iron, within a cell, IRP1 is sequestered by iron-sulfur (Fe-S) clusters and IRP2 is degraded, therefore allowing translation of the protein. (H, I) Flow cytometry of 293T cells 72 hr post-transfection of mCherry (Ctl), along with an annotated 5′UTR-GFP plasmid, unannotated 5′UTR-GFP plasmid, or a GFP plasmid containing the unannotated 5′UTR without the defined IRE. (J, K) Flow cytometry of 293T cells ± 100 µM ferric ammonium citrate (FAC) 72 hr post-transfection of mCherry (Ctl), along with an annotated 5′UTR-GFP plasmid or unannotated 5′UTR-GFP plasmid. (L) Overview of the polysome profiling protocol to analyze translation activity. (M) Cytoplasmic lysates from ±lipopolysaccharide (LPS)-treated cells were fractionated through sucrose gradients. Global RNA polysome profiles generated by the density gradient fractionation system are shown. A representative plot from stimulated primary bone marrow-derived macrophage (BMDM)-fractionated samples is shown. The experiment was performed three times. (N–Q) The relative distribution of Gapdh mRNA, encoding a housekeeping protein, Neat1, long non-coding RNA (lncRNA), annotated and unannotated Aim2 mRNA, was measured by RT-qPCR analysis of RNA. Each of the gradient fractions are calculated as relative enrichment when compared to unfractionated input mRNA; standard deviation represents technical triplicate. (R) Protein lysates of time-course LPS stimulation of 0 hr, 6 hr, 24 hr, 48 hr, and 72 hr without and with 100 µM of FAC (iron) added to immortalized WT BMDMs. Western blot performed on AIM2 and B-ACTIN. (S) Western blot quantification performed in FIJI, standard deviation represents biological triplicates, and p-value assessed using Student’s t-test.
Figure 4—figure supplement 1.
Figure 4—figure supplement 1.. Global characterization of alternative first exon (AFE).
(A) Length distribution of first exon from exclusion (CTL) exon and inclusion (lipopolysaccharide [LPS]) exon. (B) Graph of the length difference between the exclusion and inclusion exons, also known as ΔAFE. (C) All potential untranslated region (UTR) motifs were identified using RegRNA2.0 for either the exclusion (CTL) or inclusion (LPS)-specific first exons.
Figure 4—figure supplement 2.
Figure 4—figure supplement 2.. Aim2 iron-responsive element (IRE) hairpin structure predicted.
Using the Vienna RNAfold package, the IRE motif is folded into a hairpin, with strong basepairing.
Figure 4—figure supplement 3.
Figure 4—figure supplement 3.. IRP1 and IRP2 are not differentially expressed by lipopolysaccharide (LPS) in bone marrow-derived macrophages (BMDMs).
Genome browser tracks showing the transcript of either (A) IRP1 or (B) IRP2, followed by two RNA-sequencing tracks from primary BMDMs ± LPS for 6 hr. The normalized counts and DESeq2 analysis of IRP1 (C) and IRP2 (D) are represented in a bar graph in triplicate.
Figure 4—figure supplement 4.
Figure 4—figure supplement 4.. CRISPR/Cas9 knock-out of iron-responsive element (IRE) in Aim2 5′ untranslated region (UTR) leads to an increase of protein expression in mouse macrophages during inflammation.
(A) Genome browser shot. Top track indicates chromosome position. Second track shows the location of the Aim2 IRE, highlighted in light blue. The third track shows all the possible gRNAs found using the CRISPR/Cas9-NGG. Target track and the chosen gRNAs indicated in red. The last track shows the specific edits in the IRE knockout (KO) bone marrow-derived macrophage (BMDM) clonal cell line using the BLAT tool. (C–E) qRT-PCR was performed in biological triplicate, on wildtype (WT) or IRE KO immortalized CRISPR/Cas9 BMDM RNA extracts that had been stimulated with lipopolysaccharide (LPS) for indicated time points. (F) WT or (G) IRE KO protein lysates of time-course LPS stimulation of 0 hr, 24 hr, 48 hr, and 72 hr. Western blot performed on AIM2 and B-ACTIN. (H) Western blot quantification performed in FIJI, standard deviation represents biological triplicates, and p-value assessed using Student’s t-test.

Similar articles

Cited by

References

    1. Akira S, Uematsu S, Takeuchi O. Pathogen recognition and innate immunity. Cell. 2006;124:783–801. doi: 10.1016/j.cell.2006.02.015. - DOI - PubMed
    1. Anders S, Huber W. Differential expression analysis for sequence count data. Genome Biology. 2010;11:R106. doi: 10.1186/gb-2010-11-10-r106. - DOI - PMC - PubMed
    1. Anders S, Pyl PT, Huber W. HTSeq--a Python framework to work with high-throughput sequencing data. Bioinformatics. 2015;31:166–169. doi: 10.1093/bioinformatics/btu638. - DOI - PMC - PubMed
    1. Arteaga MF, La A de, Rosa D, Alvarez JA, Canessa CM. Multiple translational isoforms give functional specificity to serum- and glucocorticoid-induced kinase 1. Molecular Biology of the Cell. 2007;18:2072–2080. doi: 10.1091/mbc.e06-10-0968. - DOI - PMC - PubMed
    1. Atianand MK, Hu W, Satpathy AT, Shen Y, Ricci EP, Alvarez-Dominguez JR, Bhatta A, Schattgen SA, McGowan JD, Blin J, Braun JE, Gandhi P, Moore MJ, Chang HY, Lodish HF, Caffrey DR, Fitzgerald KA. A long noncoding RNA Lincrna-eps acts as a transcriptional brake to restrain inflammation. Cell. 2016;165:1672–1685. doi: 10.1016/j.cell.2016.05.075. - DOI - PMC - PubMed

Publication types