. 2021 May 28:10:e66419.
doi: 10.7554/eLife.66419.

Development and validation of a nomogram to better predict hypertension based on a 10-year retrospective cohort study in China

Affiliations

Development and validation of a nomogram to better predict hypertension based on a 10-year retrospective cohort study in China

Xinna Deng et al. Elife. .

Abstract

Background: Hypertension is a highly prevalent disorder. A nomogram to estimate the risk of hypertension in Chinese individuals is not available.

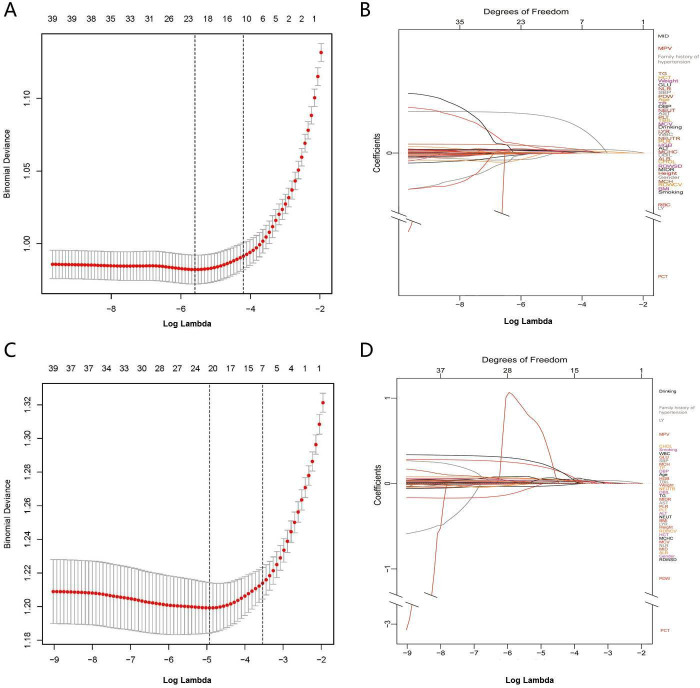
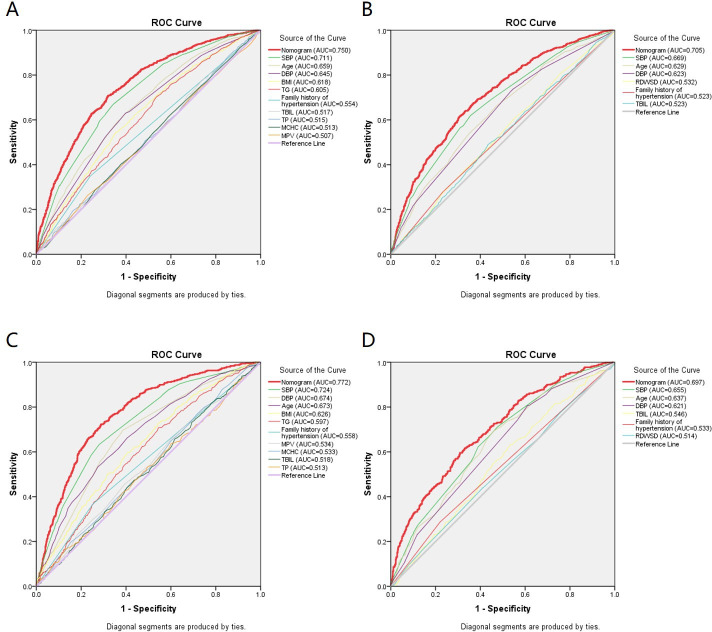
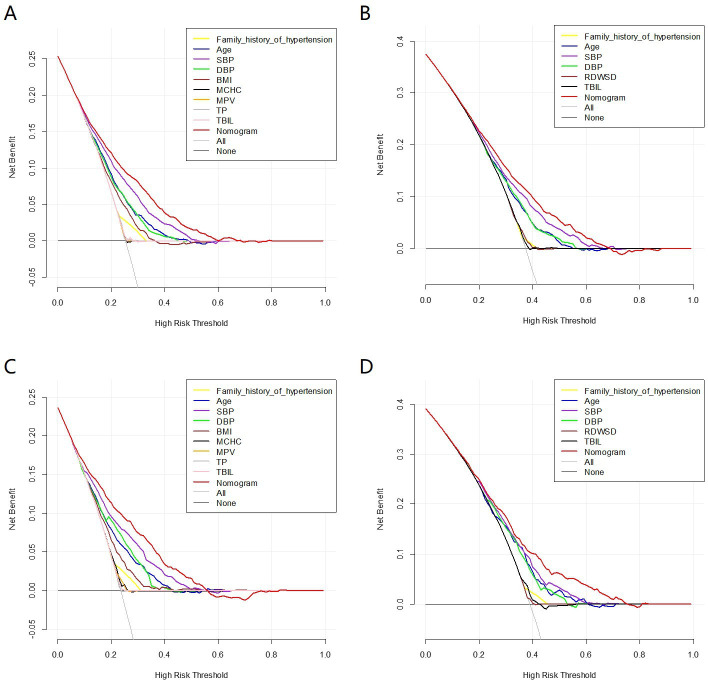
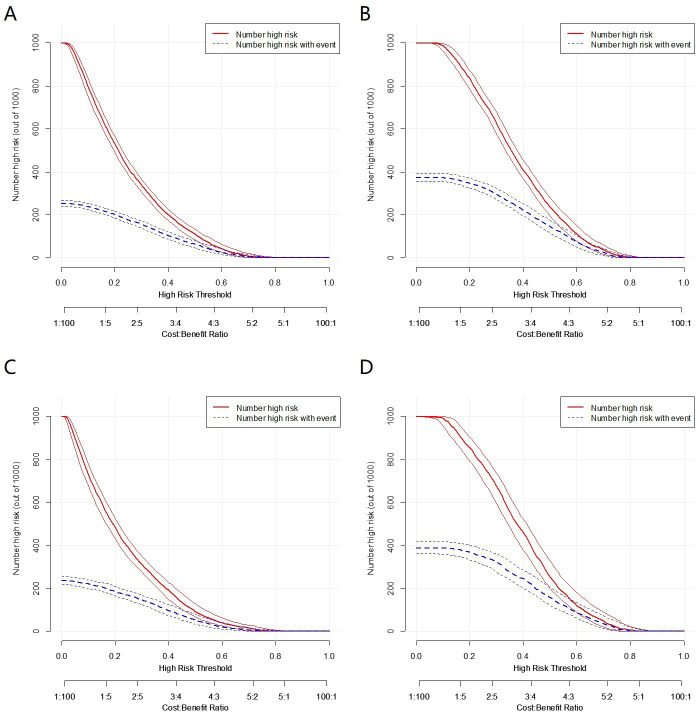
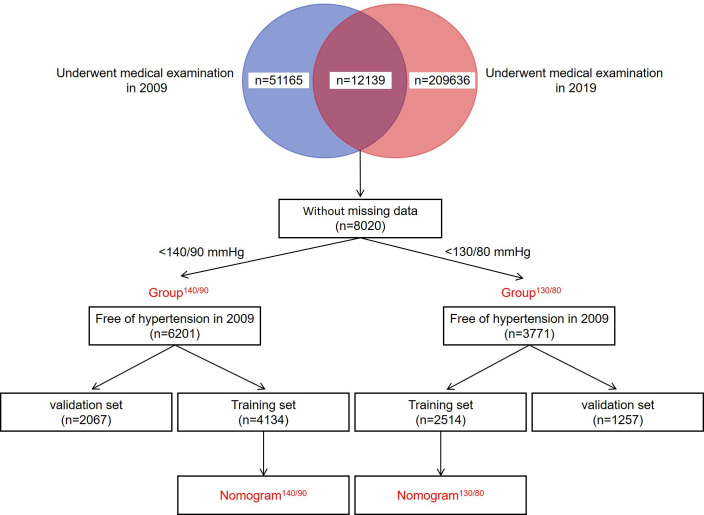
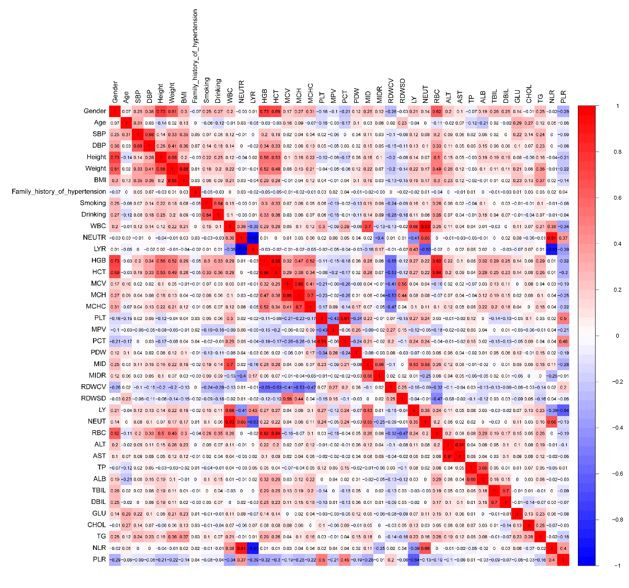
Methods: 6201 subjects were enrolled in the study and randomly divided into training set and validation set at a ratio of 2:1. The LASSO regression technique was used to select the optimal predictive features, and multivariate logistic regression to construct the nomograms. The performance of the nomograms was assessed and validated by AUC, C-index, calibration curves, DCA, clinical impact curves, NRI, and IDI.

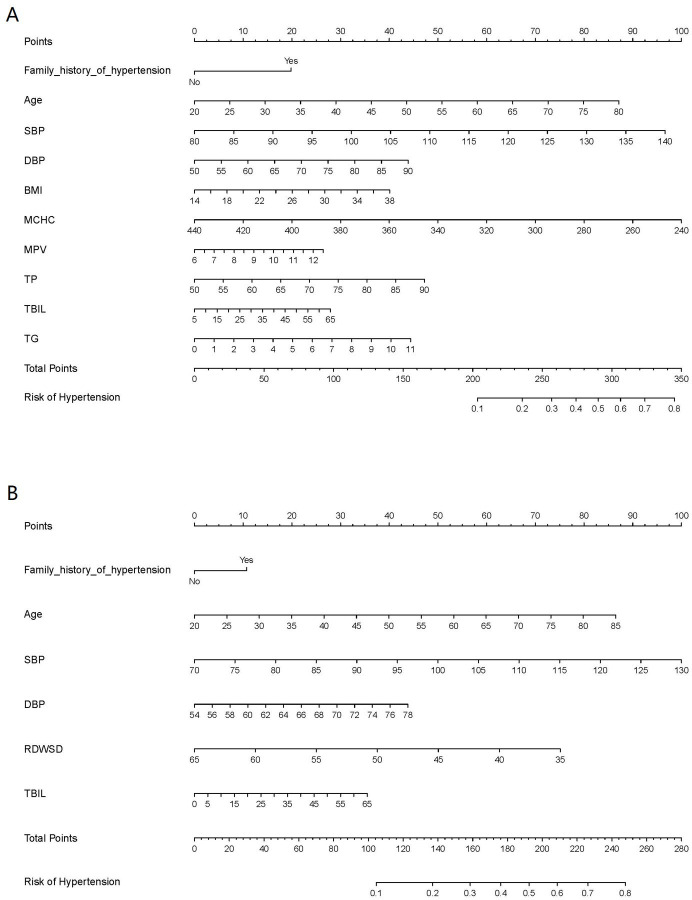
Results: The nomogram140/90 was developed with the parameters of family history of hypertension, age, SBP, DBP, BMI, MCHC, MPV, TBIL, and TG. AUCs of nomogram140/90 were 0.750 in the training set and 0.772 in the validation set. C-index of nomogram140/90 were 0.750 in the training set and 0.772 in the validation set. The nomogram130/80 was developed with the parameters of family history of hypertension, age, SBP, DBP, RDWSD, and TBIL. AUCs of nomogram130/80 were 0.705 in the training set and 0.697 in the validation set. C-index of nomogram130/80 were 0.705 in the training set and 0.697 in the validation set. Both nomograms demonstrated favorable clinical consistency. NRI and IDI showed that the nomogram140/90 exhibited superior performance than the nomogram130/80. Therefore, the web-based calculator of nomogram140/90 was built online.

Conclusions: We have constructed a nomogram that can be effectively used in the preliminary and in-depth risk prediction of hypertension in a Chinese population based on a 10-year retrospective cohort study.

Funding: This study was supported by the Hebei Science and Technology Department Program (no. H2018206110).

Keywords: human; hypertension; medicine; nomogram; risk prediction model.


Conflict of interest statement

XD, HH, XW, QL, XL, ZY, HW No competing interests declared

Figures

Figure 1.
Figure 1.. Texture feature selection using the least absolute shrinkage and selection operator (LASSO) binary logistic regression model.
(A) Identification of the optimal penalization coefficient lambda (λ) in the LASSO model with 10-fold cross-validation in Group140/90. (B) LASSO coefficient profiles of 21 features in Group140/90. The trajectory of each hypertension-related features’ coefficient was observed in the LASSO coefficient profiles with the changing of the lambda in LASSO algorithm. (C) Identification of the optimal penalization coefficient lambda (λ) in the LASSO model with 10-fold cross-validation in Group130/80. (D) LASSO coefficient profiles of 21 features in Group130/80. The trajectory of each hypertension-related features’ coefficient was observed in the LASSO coefficient profiles with the changing of the lambda in LASSO algorithm. SBP: systolic blood pressure; DBP: diastolic blood pressure; BMI: body mass index; WBC: white blood cell count; LYMPH: lymphocyte count; NEUT: neutrophil count; LYMPHP: lymphocyte percentage; NEUTP: neutrophil percentage; RBC: red blood cell count; MCHC: mean cell hemoglobin concentration; RDWCV: red blood cell distribution width-coefficient of variation; RDWSD: red blood cell distribution width standard deviation; PLT: platelet count; MPV: mean platelet volume; PCT: plateletcrit; PDW: platelet distribution width; ALT: alanine aminotransferase; AST: aspartate transaminase; TP: total protein; TBIL: total bilirubin; GLU: glucose; CHOL: cholesterol; TG: triglycerides; NLR: neutrophil-to-lymphocyte ratio.
Figure 2.
Figure 2.. Nomogram for the prediction of hypertension.
(A) Nomogram140/90 was constructed based on the data of Group140/90. (B) Nomogram130/80 was constructed based on the data of Group130/80. The points of each features were added to obtain the total points, and a vertical line was drawn on the total points to obtain the corresponding ‘risk of hypertension’. SBP: systolic blood pressure; DBP: diastolic blood pressure; BMI: body mass index; MCHC: mean cell hemoglobin concentration; MPV: mean platelet volume; TP: total protein; TBIL: total bilirubin; TG: triglycerides; RDWSD: red blood cell distribution width standard deviation.
Figure 3.
Figure 3.. Receiver operating characteristic (ROC) curves for the prediction of hypertension in the training set and validation set.
(A) ROC curves of the factors and nomogram140/90 in the training set of Group140/90. (B) ROC curves of the factors and nomogram130/80 in the training set of Group130/80. (C) ROC curves of the factors and nomogram140/90 in the validation set of Group140/90. (D) ROC curves of the factors and nomogram130/80 in the validation set of Group130/80. SBP: systolic blood pressure; DBP: diastolic blood pressure; BMI: body mass index; MCHC: mean cell hemoglobin concentration; MPV: mean platelet volume; TP: total protein; TBIL: total bilirubin; TG: triglycerides; RDWSD: red blood cell distribution width standard deviation.
Figure 4.
Figure 4.. Calibration curves of the nomogram prediction in the training set and validation set.
(A) Calibration curves of nomogram140/90 prediction in the training set of Group140/90. (B) Calibration curves of nomogram130/80 prediction in the training set of Group130/80. (C) Calibration curves of nomogram140/90 prediction in the validation set of Group140/90. (D) Calibration curves of nomogram130/80 prediction in the validation set of Group130/80.
Figure 5.
Figure 5.. Decision curve analysis (DCA) of the nomogram prediction in the training set and validation set.
(A) DCA of nomogram140/90 prediction in the training set of Group140/90. (B) DCA of nomogram130/80 prediction in the training set of Group130/80. (C) DCA of nomogram140/90 prediction in the validation set of Group140/90. (D) DCA of nomogram130/80 prediction in the validation set of Group130/80. SBP: systolic blood pressure; DBP: diastolic blood pressure; BMI: body mass index; MCHC: mean cell hemoglobin concentration; MPV: mean platelet volume; TP: total protein; TBIL: total bilirubin; TG: triglycerides; RDWSD: red blood cell distribution width standard deviation.
Figure 6.
Figure 6.. Clinical impact curves of the nomogram prediction in the training set and validation set.
(A) Clinical impact curves of nomogram140/90 prediction in the training set of Group140/90. (B) Clinical impact curves of nomogram130/80 prediction in the training set of Group130/80. (C) Clinical impact curves of nomogram140/90 prediction in the validation set of Group140/90. (D) Clinical impact curves of nomogram130/80 prediction in the validation set of Group130/80.
Figure 7.
Figure 7.. Flowchart of the procedure.
A total of 51,165 and 209,636 subjects who underwent physical examination in 2009 and 2019 were enrolled in this study, respectively. 8020 subjects who underwent medical examination both in 2009 and 2019 were finally enrolled. At a cut-off value of 140/90 mmHg, 6201 subjects who had normal blood pressure in 2009 were enrolled in Group140/90. At a cut-off value of 130/80 mmHg, 3771 subjects who had normal blood pressure in 2009 were enrolled in Group130/80. The data of Group140/90 and Group130/80 were used to construct the nomogram140/90 and nomogram130/80 for predicting hypertension, respectively.
Author response image 1.

Similar articles

Cited by

References

    1. Anderson CA, Appel LJ, Okuda N. Dietary sources of sodium in China, Japan, the United Kingdom, and the United States, women and men aged 40 to 59 years: the INTERMAP study. Journal of the American Dietetic Association. 2010;110:736–745. doi: 10.1016/j.jada.2010.02.007. - DOI - PMC - PubMed
    1. Asgari S, Moazzeni SS, Azizi F, Abdi H, Khalili D, Hakemi MS, Hadaegh F. Sex-specific incidence rates and risk factors for hypertension during 13 years of follow-up: The tehran lipid and glucose study. Global Heart. 2020;15:29. doi: 10.5334/gh.780. - DOI - PMC - PubMed
    1. Bozorgmanesh M, Hadaegh F, Mehrabi Y. A point-score system superior to blood pressure measures alone for predicting incident hypertension: Tehran Lipid and Glucose Study. Journal of Hypertension. 2011;29:1486–1493. doi: 10.1097/HJH.0b013e328348fdb2. - DOI - PubMed
    1. Burnier M, Egan BM. Adherence in Hypertension. Circulation Research. 2019;124:1124–1140. doi: 10.1161/CIRCRESAHA.118.313220. - DOI - PubMed
    1. Chen Y, Wang C, Liu Y. Incident hypertension and its prediction model in a prospective northern urban Han Chinese cohort study. Journal of Human Hypertension. 2016;30:794–800. doi: 10.1038/jhh.2016.23. - DOI - PubMed

Publication types