. 2021 Aug 2;220(8):e202012104.
doi: 10.1083/jcb.202012104. Epub 2021 May 28.

ESCRT, not intralumenal fragments, sorts ubiquitinated vacuole membrane proteins for degradation

Affiliations

ESCRT, not intralumenal fragments, sorts ubiquitinated vacuole membrane proteins for degradation

Xi Yang et al. J Cell Biol. .

Abstract

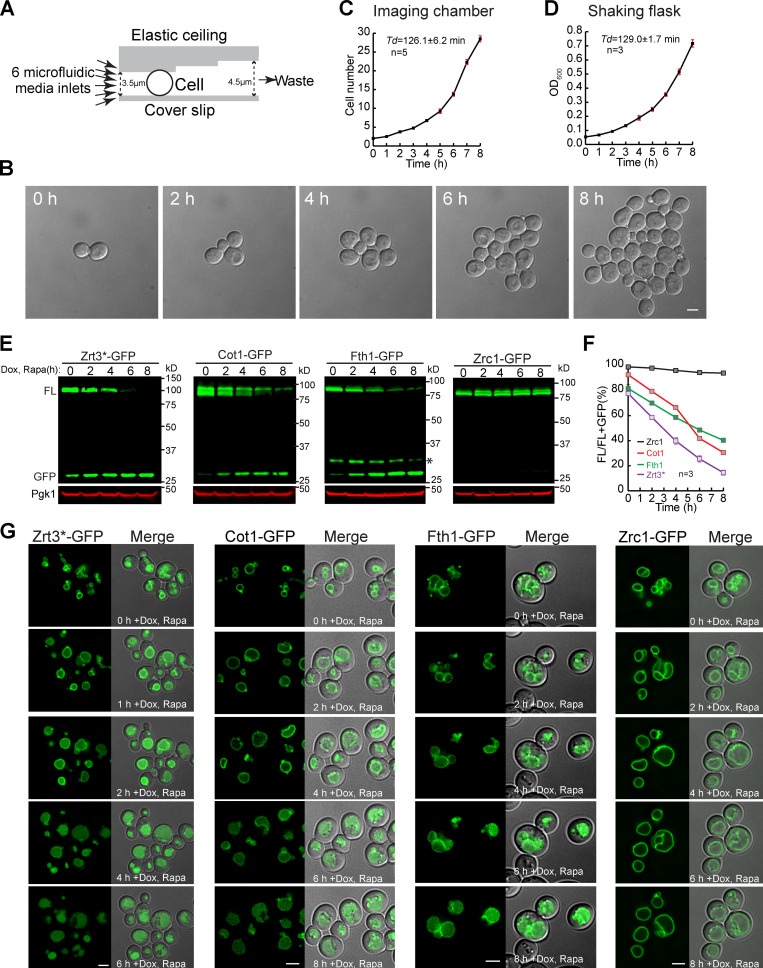
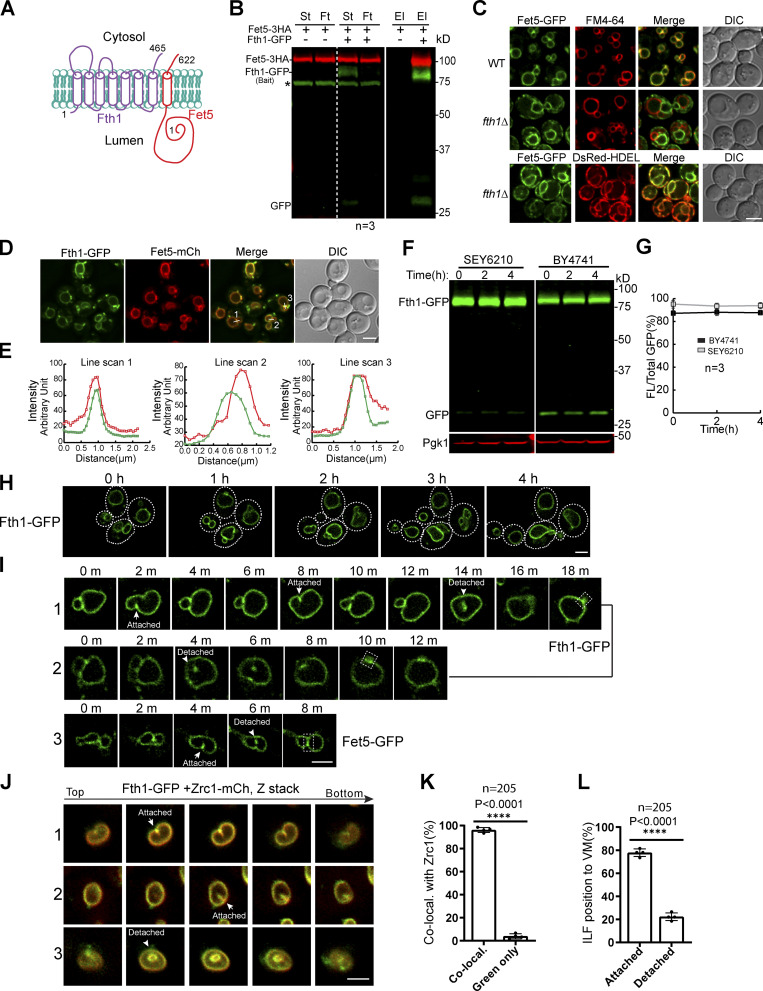
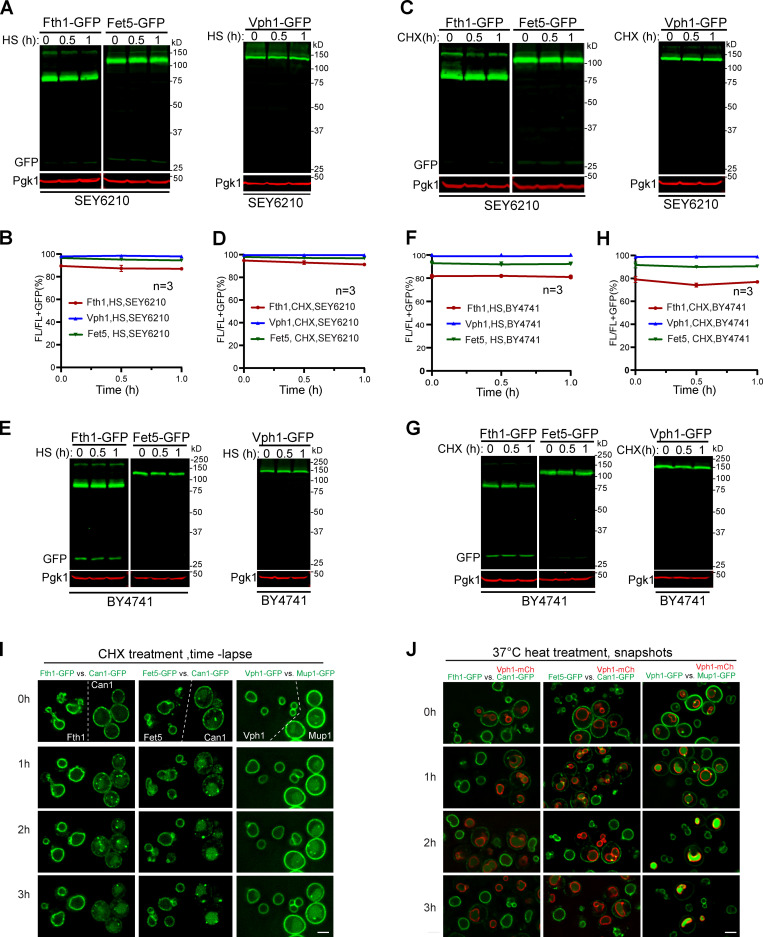
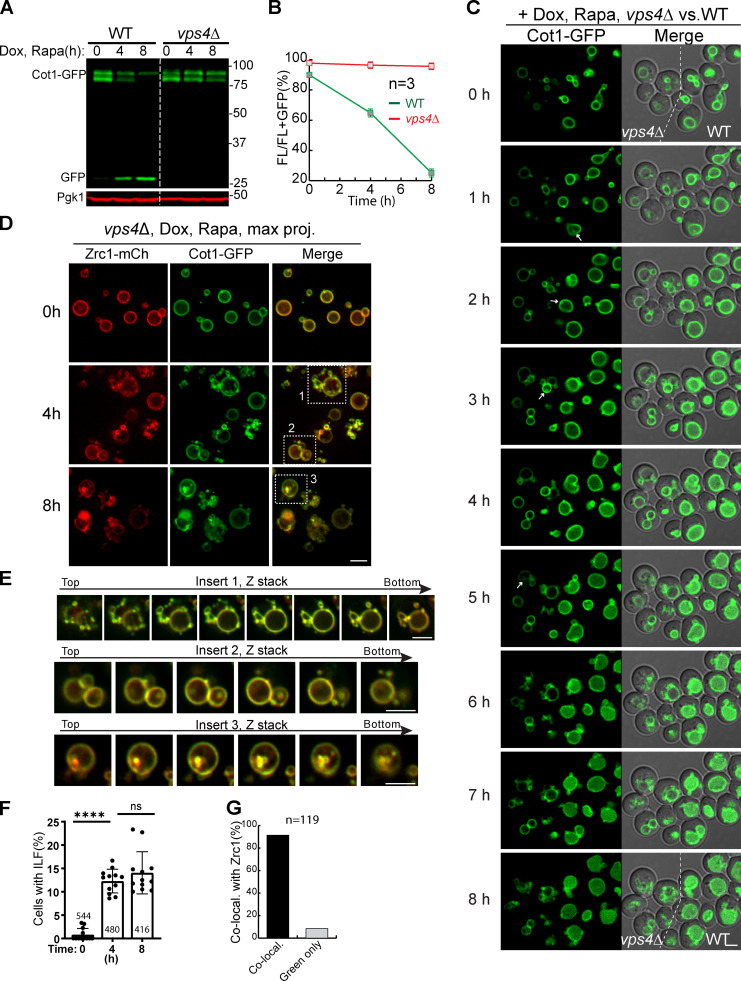
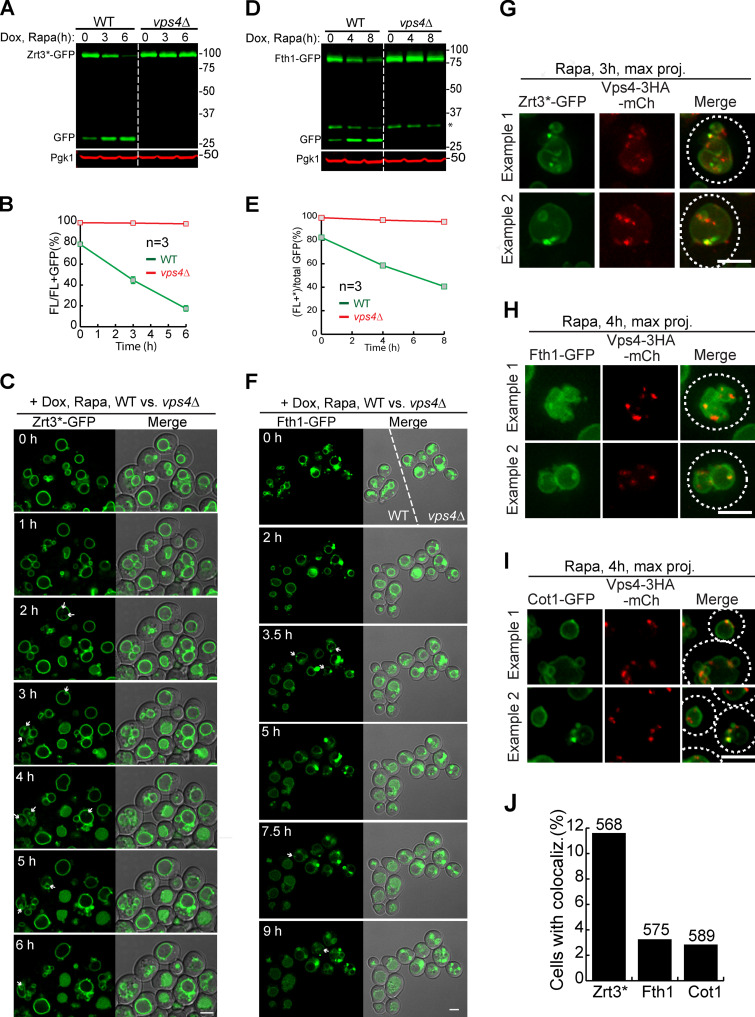
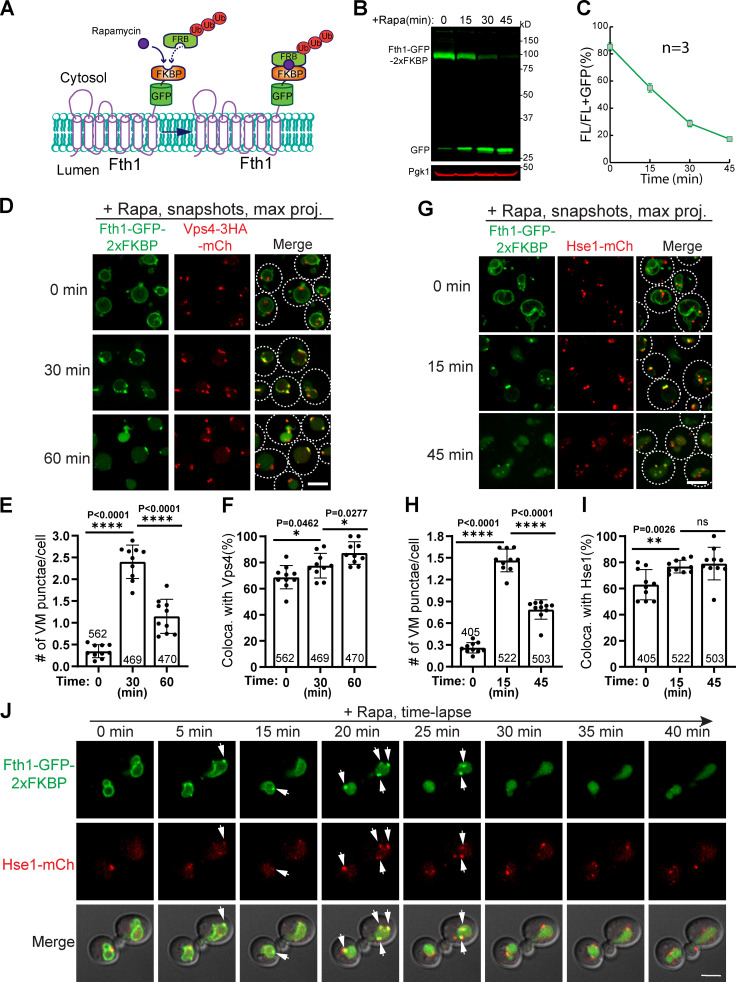
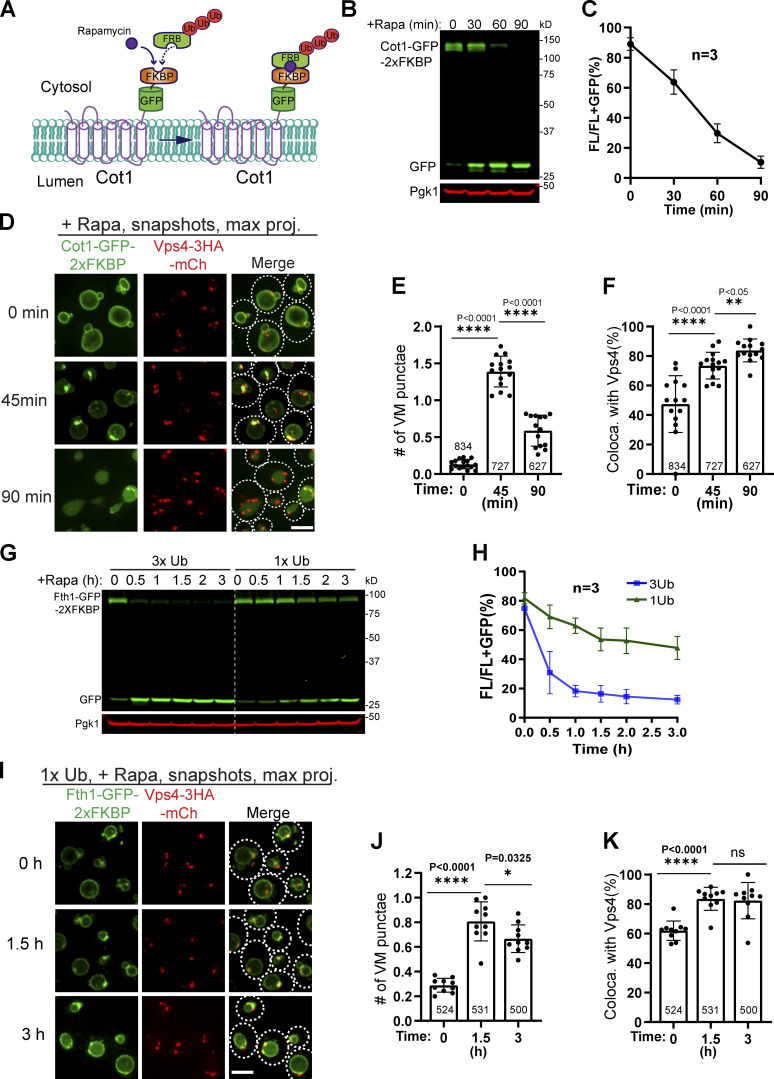
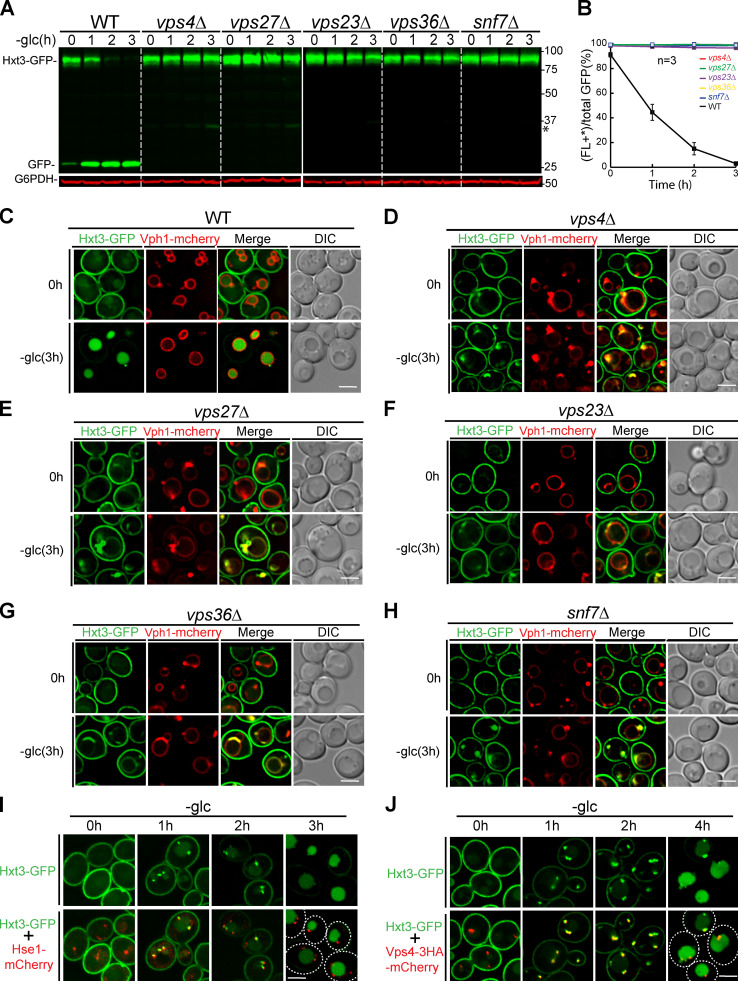
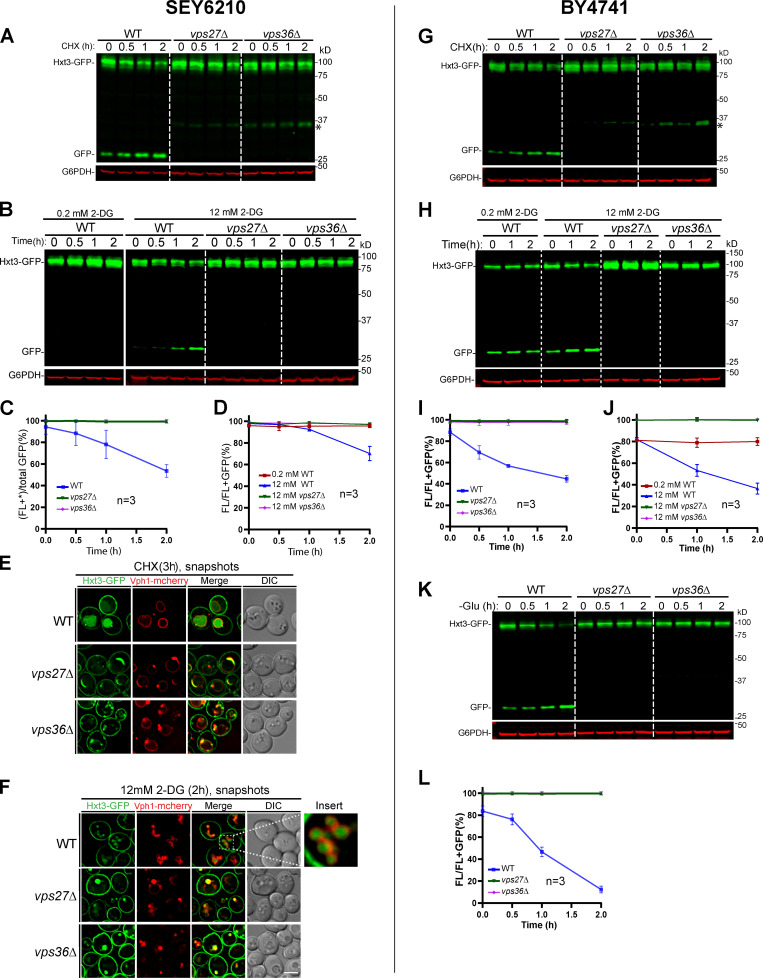
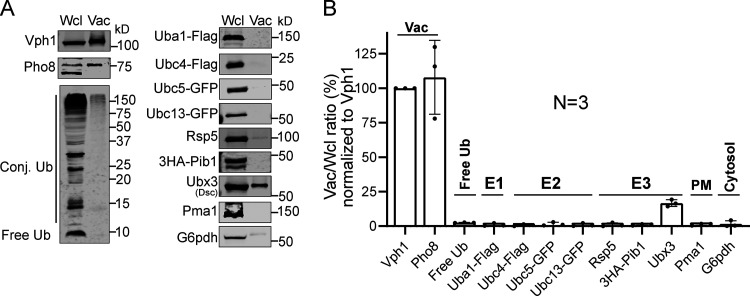
The lysosome (or vacuole in fungi and plants) is an essential organelle for nutrient sensing and cellular homeostasis. In response to environmental stresses such as starvation, the yeast vacuole can adjust its membrane composition by selectively internalizing membrane proteins into the lumen for degradation. Regarding the selective internalization mechanism, two competing models have been proposed. One model suggests that the ESCRT machinery is responsible for the sorting. In contrast, the ESCRT-independent intralumenal fragment (ILF) pathway proposes that the fragment generated by homotypic vacuole fusion is responsible for the sorting. Here, we applied a microfluidics-based imaging method to capture the complete degradation process in vivo. Combining live-cell imaging with a synchronized ubiquitination system, we demonstrated that ILF cargoes are not degraded through intralumenal fragments. Instead, ESCRTs function on the vacuole membrane to sort them into the lumen for degradation. We further discussed challenges in reconstituting vacuole membrane protein degradation.


Figures

Figure 1.
Figure 1.
Developing a live-cell imaging method to study VM dynamics.(A) Design of a microfluidic imaging chamber. (B) Time-lapse imaging of mid-log cells in a microfluidic imaging chamber. (C and D) Growth curves showing the Td of WT cells in an imaging chamber (C) or shaking flask (D). Error bars represent SD. (E) Western blots to measure the degradation kinetics of VM proteins. Asterisk indicates the protease cleavage product. (F) Quantification (±SD, n = 3) of protein levels in E. (G) Time-lapse imaging to capture the degradation of VM proteins. Scale bars, 2 µm. Dox, doxycycline; FL, full-length protein fused with GFP; Rapa, rapamycin.
Figure 2.
Figure 2.
Fth1 forms a stable complex with Fet5 and is not constitutively degraded.(A) Membrane topology of the Fth1–Fet5 complex. (B) Coimmunoprecipitation showing the interaction between Fth1 and Fet5. El, elution; Ft, flow through; St, starting material. Asterisk indicates the nonspecific band. (C) The complex formation is essential for Fet5 to exit the ER. FM4-64 and DsRed-HDEL highlight VM and ER, respectively. (D) Fth1-GFP colocalizes with Fet5-mCherry at the boundary membrane of adjacent vacuoles. (E) Line scans to show the colocalization in D. (F) Fth1-GFP is not constitutively degraded in either SEY6210 or BY4741 background. (G) Quantification (±SD, n = 3) of protein levels in F. (H) Time-lapse imaging to show no increase of lumenal GFP during normal vacuole fusion and fission processes. Dashed lines indicate the periphery of yeast cells. (I) Time-lapse imaging to show the formation of ILFs and their fusion back to the VM. (J and K) Images (J) and quantification (K) showing the colocalization of Fth1-GFP with Zrc1-mCherry on ILFs. Each data point in K represents a biological repeat. A total of 205 ILFs were counted. (L) Distribution of the ILFs relative to the VM. DIC, differential interference contrast. Scale bars, 3 µm.
Figure 3.
Figure 3.
Neither CHX nor heat shock triggers the VM protein degradation in vivo.(A, C, E, and G) Western blots showing that Fth1-GFP, Fet5-GFP, and Vph1-GFP in either SEY6210 or BY4741 background were stable after 1-h heat shock (HS) at 37°C or CHX treatment. (B, D, F, and H) Quantification (±SD, n = 3) of protein levels in A, C, E, and G, respectively. (I) Time-lapse imaging showing the subcellular localization of VM-GFP (Fth1, Fet5, and Vph1) and PM-GFP (Can1 and Mup1) during CHX treatment. (J) Snapshot images showing the subcellular localization of VM-GFP (Fth1, Fet5, and Vph1) and PM-GFP (Can1 and Mup1) during heat treatment. For clarity, the PM-GFP strain was colabeled with Vph1-mCherry. Scale bar, 3 µm.
Figure 4.
Figure 4.
The ESCRT machinery is essential for the degradation of Cot1.(A) Western blots showing the degradation of Cot1-GFP in WT and vps4Δ cells. (B) Quantification (±SD, n = 3) of protein levels in A. (C) Time-lapse imaging of Cot1-GFP in WT and vps4Δ strains during an 8-h rapamycin treatment. Both strains were grown in the same imaging chamber. Arrows highlight the ILFs in vps4Δ cells. (D) Images showing the colocalization of Cot1-GFP with Zrc1-mCherry in vps4Δ strain cells during rapamycin treatment. (E) Z stacks showing the colocalization of Cot1-GFP with Zrc1-mCherry in the inserts of D. (F) Percentage of vps4Δ cells with ILF during rapamycin treatment. Error bars represent SD. Numbers on each column indicate the total number of cells counted. The statistical analysis was performed with a paired Student t test. ****, P ≤ 0.0001. (G) Quantification of the colocalization between Cot1-GFP and Zrc1-mCherry on ILF. Scale bars, 3 µm.
Figure S1.
Figure S1.
The ESCRT machinery is essential for the degradation of VM proteins, related to Fig. 4.(A) Western blots showing the degradation of Zrt3*-GFP in WT and vps4Δ cells. (B) Quantification (±SD, n = 3) of protein levels in A. (C) Time-lapse imaging of Zrt3*-GFP in WT and vps4Δ strains during a 6-h rapamycin treatment. Both strains were grown in the same chamber. Arrows highlight the intralumenal structures in vps4Δ cells. (D) Western blots showing the degradation of Fth1-GFP in WT and vps4Δ strains. Asterisk indicates a 35-kD cleavage product of Fth1-GFP when expressed from a TET-OFF plasmid. (E) Quantification (±SD, n = 3) of protein levels in D. (F) Time-lapse imaging of Fth1-GFP in WT and vps4Δ cells during a 9-h rapamycin treatment. Both strains were grown in the same chamber. Arrows highlight the intralumenal structures in vps4Δ cells. (G–I) During rapamycin treatment, Zrt3* (G), Fth1 (H), and Cot1 (I) were sorted into punctate structures that colocalized with Vps4-3HA-mCherry. (J) Percentage of yeast cells that contain colocalized punctae. White dashed lines indicate the periphery of yeast cells. Numbers on top of the columns were the counted cell number. Dox, doxycycline; FL, full-length protein fused with GFP; Rapa, rapamycin. Scale bars, 3 µm.
Figure 5.
Figure 5.
The ESCRT machinery colocalizes with ubiquitinated Fth1-GFP during RapID degradation.(A) Design of the RapIDeg system for Fth1 degradation. (B) Western blots showing the fast degradation of Fth1-GFP-2xFKBP. (C) Quantification (±SD, n = 3) of protein levels in B. (D) Snapshots showing the colocalization of Fth1-GFP-2xFKBP with Vps4-3HA-mCherry during degradation. Dashed lines indicate the periphery of yeast cells. (E and F) Quantification of the number of Fth1 punctae per cell and their colocalization with Vps4-3HA-mCherry in D. Error bars represent SD. Numbers on each column indicate the total number of cells counted. (G) Snapshot Imaging showing the colocalization of Fth1-GFP-2xFKBP with Hse1-mCherry during degradation. (H and I) Quantification of the number of Fth1 punctae per cell and their colocalization with Hse1-mCherry in D. (J) Time-lapse imaging to show the colocalization (arrows) of Fth1-GFP-2xFKBP punctae with Hse1-mCherry during degradation. Ub, ubiquitin. Scale bars, 3 µm.
Figure S2.
Figure S2.
The ESCRT machinery colocalizes with ubiquitinated cargo proteins, related to Fig. 5.(A) Design of the 3xUb RapIDeg system for Cot1 degradation. (B) Western blots showing the fast degradation of Cot1-GFP-2xFKBP. (C) Quantification (±SD, n = 3) of protein levels in B. (D) Snapshots showing the colocalization of Cot1-GFP with Vps4-mCherry during degradation. (E and F) Quantification of the number of Cot1 punctae per cell and their colocalization with Vps4-mCherry in D. Each data point represents a single image containing ∼30–50 cells. A total of 13–15 images from three biological replicates were quantified at each time point. (G) Comparison of Fth1-GFP-2xFKBP degradation kinetics between 3xUb and 1xUb strains. (H) Quantification (±SD, n = 3) of protein levels in G. (I) Colocalization of Fth1-GFP-2xFKBP with Vps4-3HA-mCherry in the 1xUb RapIDeg strain. White dashed lines indicate the periphery of yeast cells. (J and K) Quantification of the number of Fth1 punctae per cell and their colocalization with Vps4-3HA-mCherry in I. Each data point represents a single image containing ∼50 cells. A total of 10 images from three biological replicates were quantified for each time point. Error bars represent SD. Numbers on each column indicated the total number of cells counted. The statistical analysis was performed with a paired Student t test. Scale bars, 3 µm.
Figure S3.
Figure S3.
The ESCRT machinery is essential for the degradation of plasma protein Hxt3 during glucose starvation.(A) Western blots showing the degradation of Hxt3-GFP after glucose starvation in the indicated strains. Asterisk indicates a minor cleavage product from full-length protein. (B) Quantification (±SD, n = 3) of protein levels in A. (C–H) Subcellular localization of Hxt3-GFP before (0 h) and after (3 h) glucose starvation in WT (C), vps4Δ (D), vps27Δ (E), vps23Δ (F), vps36Δ (G), and snf7Δ (H) cells. (I and J) Colocalization of Hxt3-GFP with Hse1-mCherry (I) and Vps4-3HA-mCherry (J) during glucose starvation. Dashed lines indicate the periphery of yeast cells. Scale bars, 3 µm.
Figure S4.
Figure S4.
The ESCRT machinery is essential for the degradation of PM protein Hxt3 in both SEY6210 and BY4741, related to Fig. S3.(A and B) Degradation of Hxt3-GFP in WT, vps27Δ, and vps36Δ cells in SEY6210 background under CHX (A) or 2-DG (B) treatment. The asterisk indicates a minor cleavage product from full-length protein. (C and D) Quantification (±SD, n = 3) of protein levels in A and B, respectively. (E) Subcellular localization of Hxt3-GFP in WT, vps27Δ, and vps36Δ cells after CHX treatment. (F) Subcellular localization of Hxt3-GFP in WT, vps27Δ, and vps36Δ cells after 2-DG treatment. The insert highlights fragmented vacuoles. (G and H) Degradation of Hxt3-GFP in WT, vps27Δ, and vps36Δ strains in BY4741 background under CHX (G) or 2-DG (H) treatment. (I and J) Quantification (±SD, n = 3) of protein levels in G and H, respectively. (K) Degradation of Hxt3-GFP under glucose starvation in WT, vps27Δ, and vps36Δ strains in BY4741 background. (L) Quantification (±SD, n = 3) of protein levels in K. Scale bars, 2 µm.
Figure S5.
Figure S5.
Purified vacuoles do not contain a functional ubiquitination system.(A) Comparison of protein levels between whole-cell lysate (Wcl) and purified vacuoles (Vac). Samples that contain a similar level of Vph1 were loaded in each lane. (B) Quantification (±SD, n = 3) of the relative protein levels in A, which was normalized to Vph1.

Comment in

Similar articles

Cited by

References

    1. Adell, M.A.Y., Migliano S.M., Upadhyayula S., Bykov Y.S., Sprenger S., Pakdel M., Vogel G.F., Jih G., Skillern W., Behrouzi R., et al. . 2017. Recruitment dynamics of ESCRT-III and Vps4 to endosomes and implications for reverse membrane budding. eLife. 6:e31652. 10.7554/eLife.31652 - DOI - PMC - PubMed
    1. Arines, F.M., Hamlin A.J., Yang X., Liu Y.J., and Li M.. 2021. A selective transmembrane recognition mechanism by a membrane-anchored ubiquitin ligase adaptor. J. Cell Biol. 220:e202001116. 10.1083/jcb.202001116 - DOI - PMC - PubMed
    1. Askwith, C., Eide D., Van Ho A., Bernard P.S., Li L., Davis-Kaplan S., Sipe D.M., and Kaplan J.. 1994. The FET3 gene of S. cerevisiae encodes a multicopper oxidase required for ferrous iron uptake. Cell. 76:403–410. 10.1016/0092-8674(94)90346-8 - DOI - PubMed
    1. Cabrera, M., and Ungermann C.. 2008. Purification and in vitro analysis of yeast vacuoles. Methods Enzymol. 451:177–196. 10.1016/S0076-6879(08)03213-8 - DOI - PubMed
    1. Christiano, R., Arlt H., Kabatnik S., Mejhert N., Lai Z.W., Farese R.V. Jr., and Walther T.C.. 2020. A Systematic Protein Turnover Map for Decoding Protein Degradation. Cell Rep. 33:108378. 10.1016/j.celrep.2020.108378 - DOI - PMC - PubMed

Publication types

MeSH terms

Substances