

TDP-43 proteinopathy occurs independently of autophagic substrate accumulation and underlies nuclear defects in Niemann-Pick C disease
- PMID: 34048071
- PMCID: PMC8608685
- DOI: 10.1111/nan.12738
TDP-43 proteinopathy occurs independently of autophagic substrate accumulation and underlies nuclear defects in Niemann-Pick C disease
Abstract
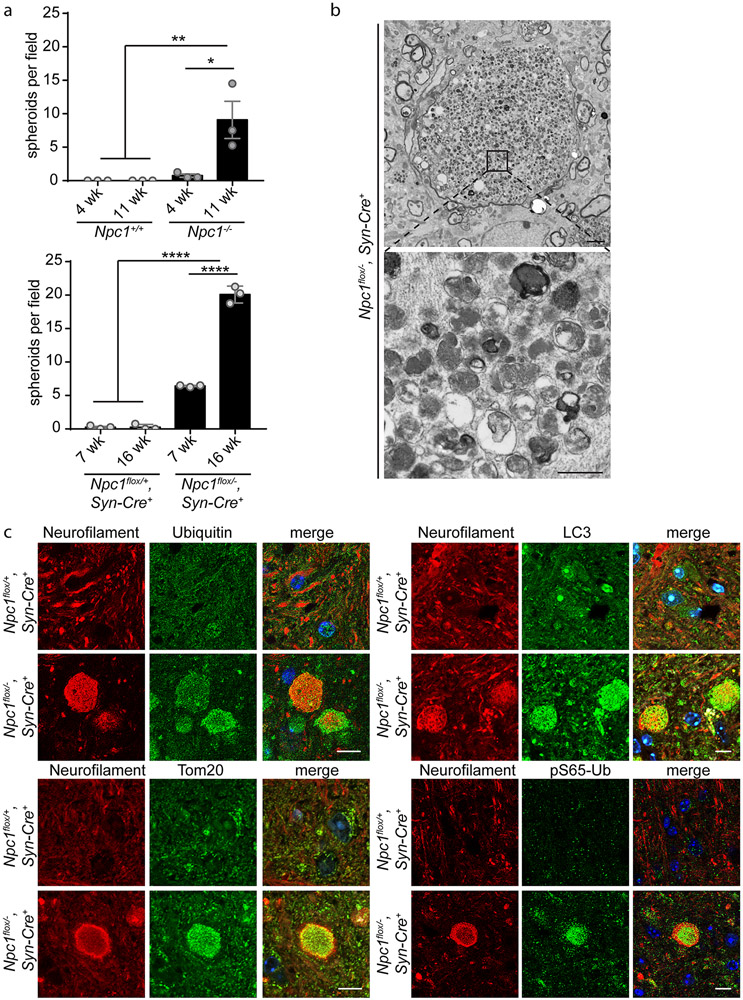
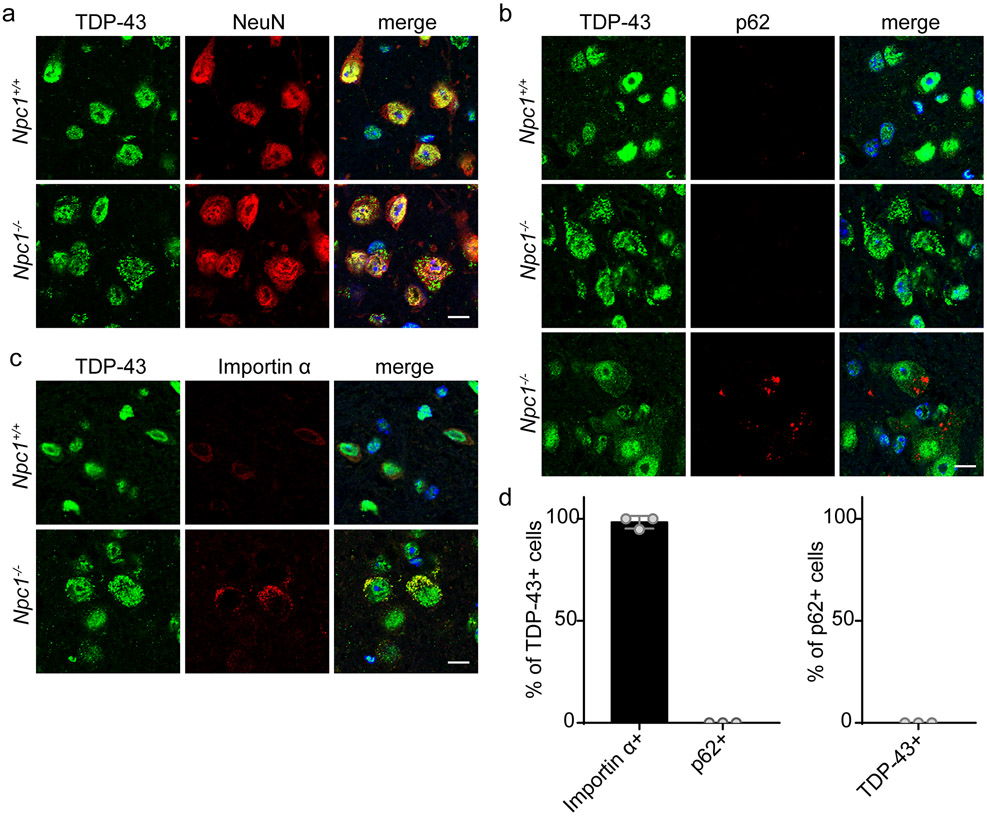
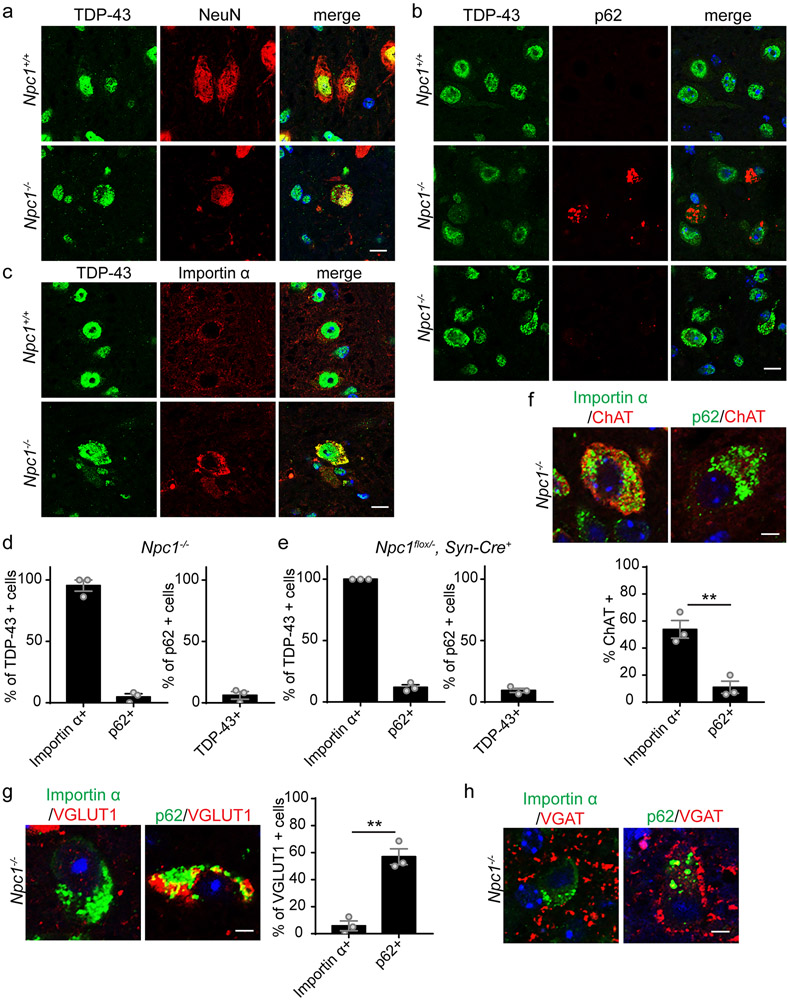
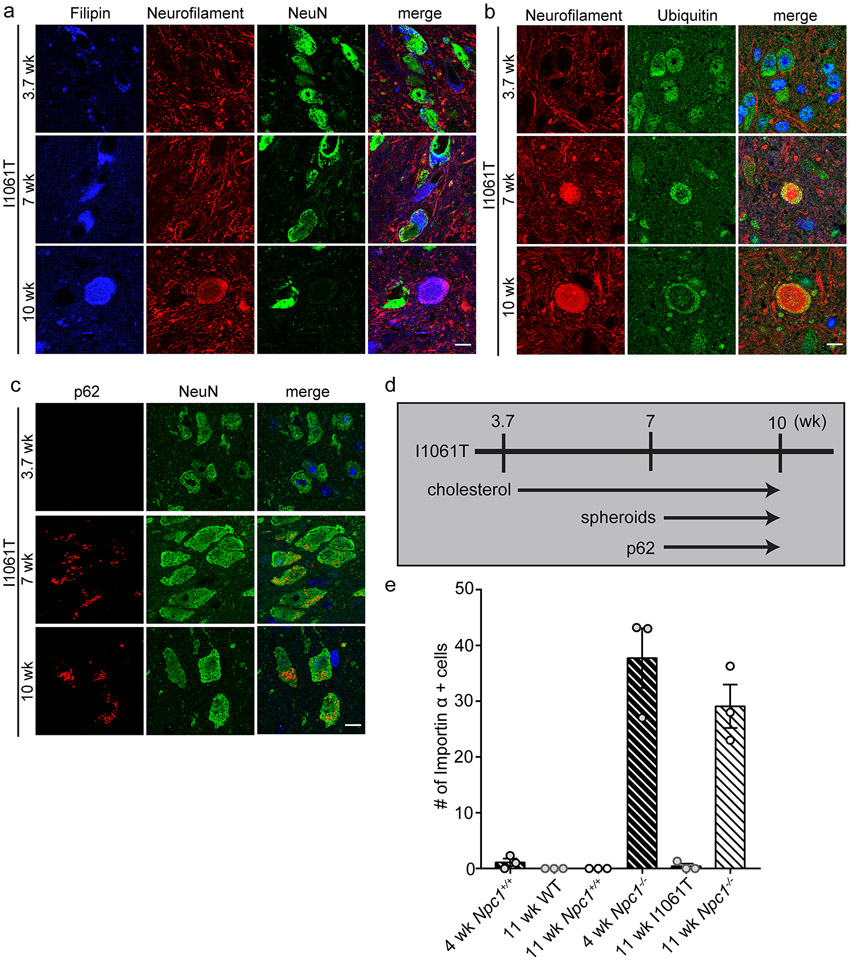
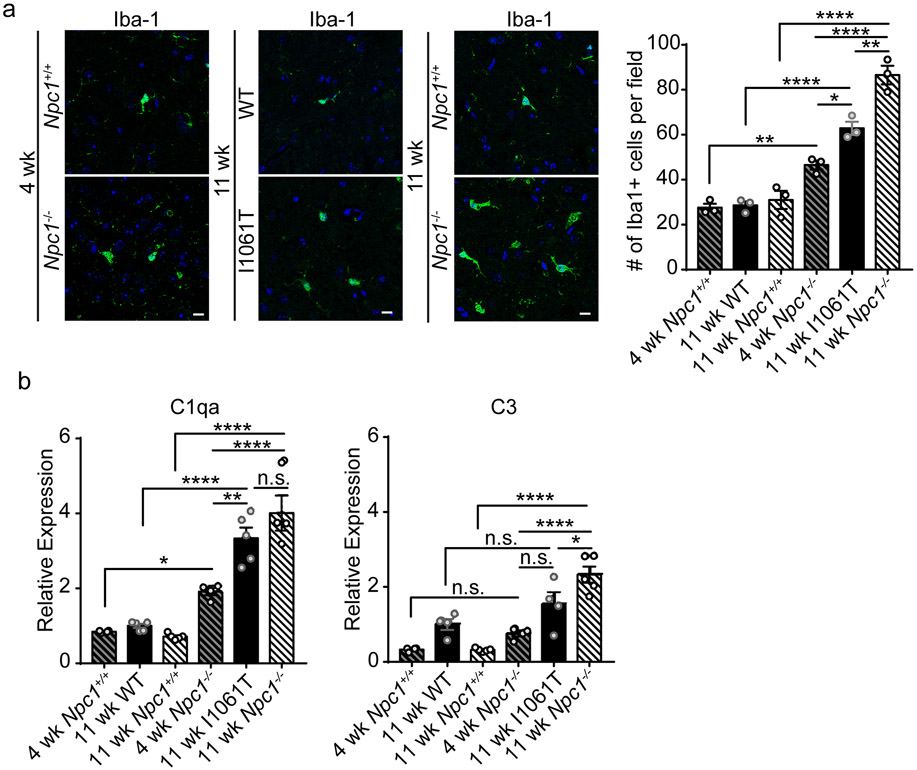
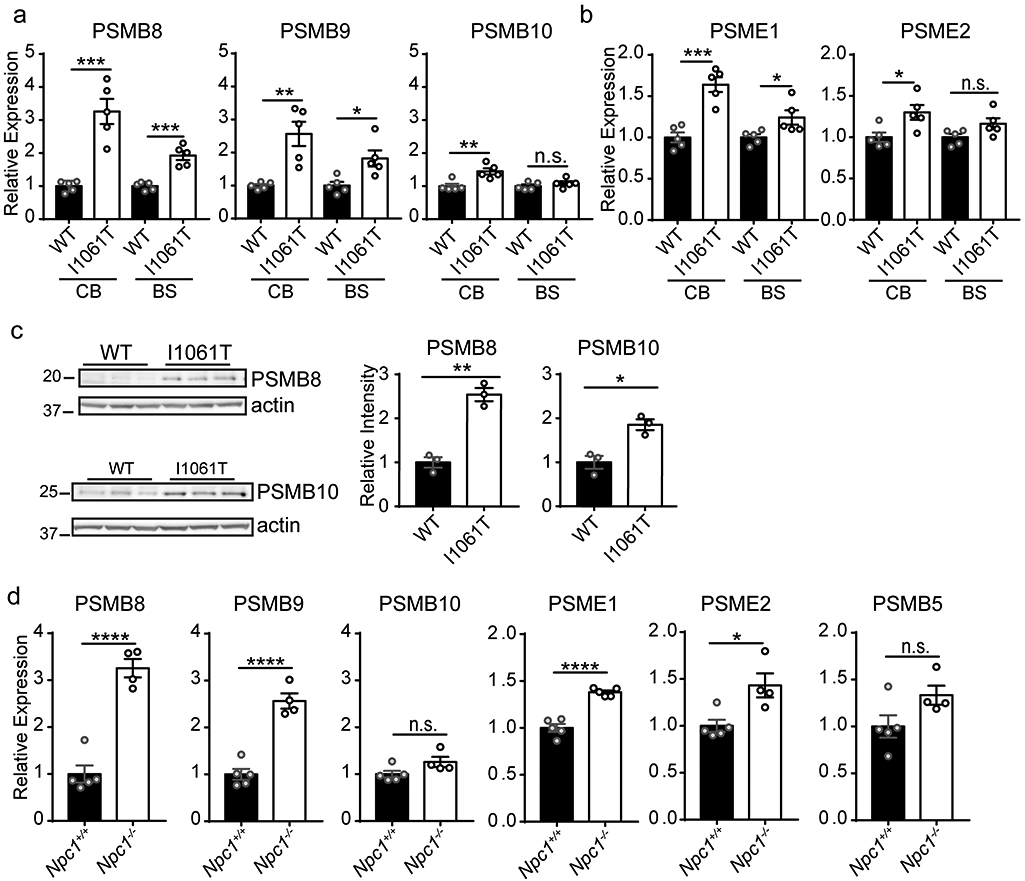
Aims: Neuronal cytoplasmic inclusions of TAR-DNA binding protein of 43 kDa (TDP-43) are a pathological hallmark of diverse neurodegenerative disorders, yet the processes that mediate their formation and their functional significance remain incompletely understood. Both dysfunction in autophagy and neuroinflammation have been linked to TDP-43 mislocalisation. Here, we investigate TDP-43 proteinopathy in Niemann-Pick type C disease (NPC), an autosomal recessive lysosomal storage disease (LSD) distinguished by the accumulation of unesterified cholesterol within late endosomes and lysosomes. NPC is characterised by neurodegeneration, neuroinflammation and multifocal disruption of the autophagy pathway.
Methods: We utilised immunohistochemistry, confocal microscopy, electron microscopy and biochemical and gene expression studies to characterise TDP-43 pathology and autophagic substrate accumulation in Npc1-deficient mice.
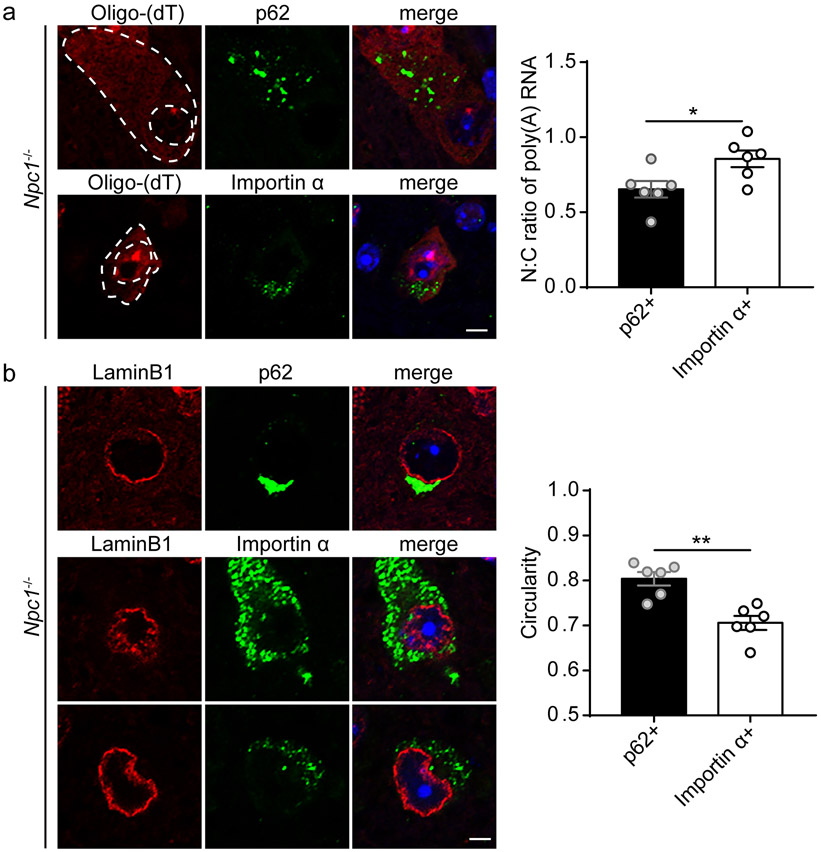
Results: In the NPC brain, cytoplasmic TDP-43 mislocalisation was independent of autophagic substrate accumulation. These pathologies occurred in distinct neuronal subtypes, as brainstem cholinergic neurons were more susceptible to TDP-43 mislocalisation, whereas glutamatergic neurons exhibited hallmarks of autophagic dysfunction. Furthermore, TDP-43 mislocalisation did not co-localise with markers of stress granules or progress to ubiquitinated aggregates over months in vivo, indicating a stable, early stage in the aggregation process. Neither microgliosis nor neuroinflammation were sufficient to drive TDP-43 proteinopathy in the NPC brain. Notably, cytoplasmic TDP-43 co-localised with the nuclear import factor importin α, and TDP-43 mislocalised neurons demonstrated nuclear membrane abnormalities and disruption of nucleocytoplasmic transport.
Conclusion: Our findings highlight the relationship between LSDs and TDP-43 proteinopathy, define its functional importance in NPC by triggering nuclear dysfunction, and expand the spectrum of TDP-43 pathology in the diseased brain.
Keywords: Niemann-Pick type C; TDP-43; autophagy; lysosomal diseases; nucleocytoplasmic transport.
© 2021 British Neuropathological Society.
Figures
Similar articles
-
Altered localization and functionality of TAR DNA Binding Protein 43 (TDP-43) in niemann- pick disease type C.Acta Neuropathol Commun. 2016 May 18;4(1):52. doi: 10.1186/s40478-016-0325-4. Acta Neuropathol Commun. 2016. PMID: 27193329 Free PMC article.
-
Finding pathogenic commonalities between Niemann-Pick type C and other lysosomal storage disorders: Opportunities for shared therapeutic interventions.Biochim Biophys Acta Mol Basis Dis. 2020 Oct 1;1866(10):165875. doi: 10.1016/j.bbadis.2020.165875. Epub 2020 Jun 6. Biochim Biophys Acta Mol Basis Dis. 2020. PMID: 32522631 Review.
-
β-Cyclodextrin-threaded biocleavable polyrotaxanes ameliorate impaired autophagic flux in Niemann-Pick type C disease.J Biol Chem. 2015 Apr 10;290(15):9442-54. doi: 10.1074/jbc.M115.636803. Epub 2015 Feb 24. J Biol Chem. 2015. PMID: 25713067 Free PMC article.
-
Impaired proteolysis underlies autophagic dysfunction in Niemann-Pick type C disease.Hum Mol Genet. 2012 Nov 15;21(22):4876-87. doi: 10.1093/hmg/dds324. Epub 2012 Aug 7. Hum Mol Genet. 2012. PMID: 22872701 Free PMC article.
-
Endo-lysosomal dysfunction and neuronal-glial crosstalk in Niemann-Pick type C disease.Philos Trans R Soc Lond B Biol Sci. 2024 Apr 8;379(1899):20220388. doi: 10.1098/rstb.2022.0388. Epub 2024 Feb 19. Philos Trans R Soc Lond B Biol Sci. 2024. PMID: 38368932 Free PMC article. Review.
Cited by
-
Alterations in Proteostasis Mechanisms in Niemann-Pick Type C Disease.Int J Mol Sci. 2024 Mar 29;25(7):3806. doi: 10.3390/ijms25073806. Int J Mol Sci. 2024. PMID: 38612616 Free PMC article. Review.
-
TDP-43 and Inflammation: Implications for Amyotrophic Lateral Sclerosis and Frontotemporal Dementia.Int J Mol Sci. 2021 Jul 21;22(15):7781. doi: 10.3390/ijms22157781. Int J Mol Sci. 2021. PMID: 34360544 Free PMC article. Review.
-
Recognition of the TDP-43 nuclear localization signal by importin α1/β.Cell Rep. 2022 Jun 28;39(13):111007. doi: 10.1016/j.celrep.2022.111007. Cell Rep. 2022. PMID: 35767952 Free PMC article.
-
Decoding TDP-43: the molecular chameleon of neurodegenerative diseases.Acta Neuropathol Commun. 2024 Dec 31;12(1):205. doi: 10.1186/s40478-024-01914-9. Acta Neuropathol Commun. 2024. PMID: 39736783 Free PMC article. Review.
References
-
- Arai T, Hasegawa M, Akiyama H, Ikeda K, Nonaka T, Mori H, et al. TDP-43 is a component of ubiquitin-positive tau-negative inclusions in frontotemporal lobar degeneration and amyotrophic lateral sclerosis. Biochem Biophys Res Commun. 2006;351(3):602–11. - PubMed
-
- Neumann M, Sampathu DM, Kwong LK, Truax AC, Micsenyi MC, Chou TT, et al. Ubiquitinated TDP-43 in frontotemporal lobar degeneration and amyotrophic lateral sclerosis. Science. 2006;314(5796):130–3. - PubMed
-
- Iguchi Y, Katsuno M, Niwa J, Takagi S, Ishigaki S, Ikenaka K, et al. Loss of TDP-43 causes age-dependent progressive motor neuron degeneration. Brain. 2013;136(Pt 5):1371–82. - PubMed
Publication types
MeSH terms
Substances
Grants and funding
LinkOut - more resources
Full Text Sources
Other Literature Sources
Molecular Biology Databases
