

A Single-Organelle Optical Omics Platform for Cell Science and Biomarker Discovery
- PMID: 34048235
- PMCID: PMC8865453
- DOI: 10.1021/acs.analchem.1c01131
A Single-Organelle Optical Omics Platform for Cell Science and Biomarker Discovery
Abstract
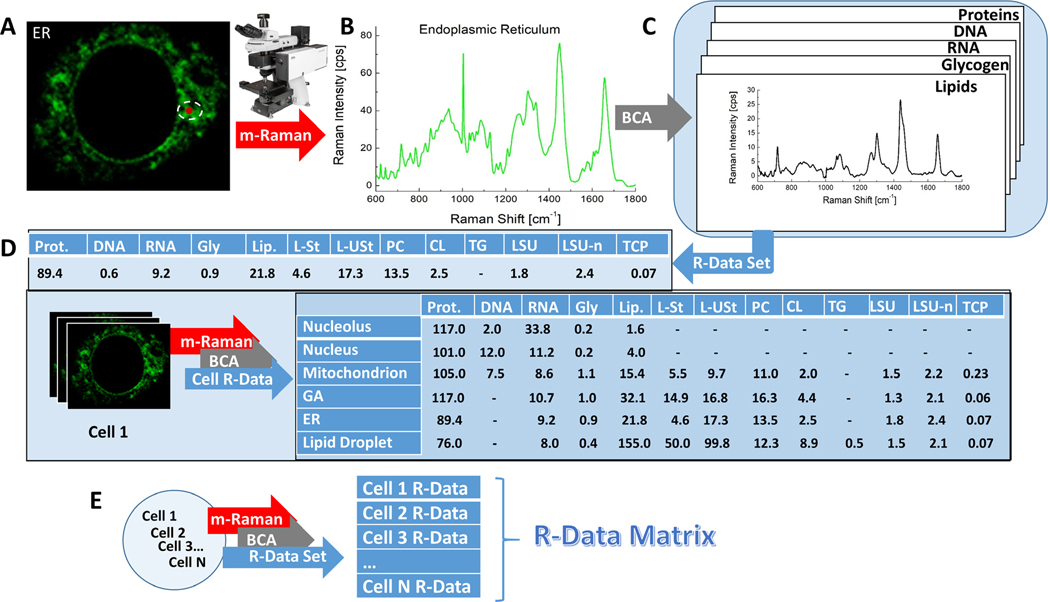
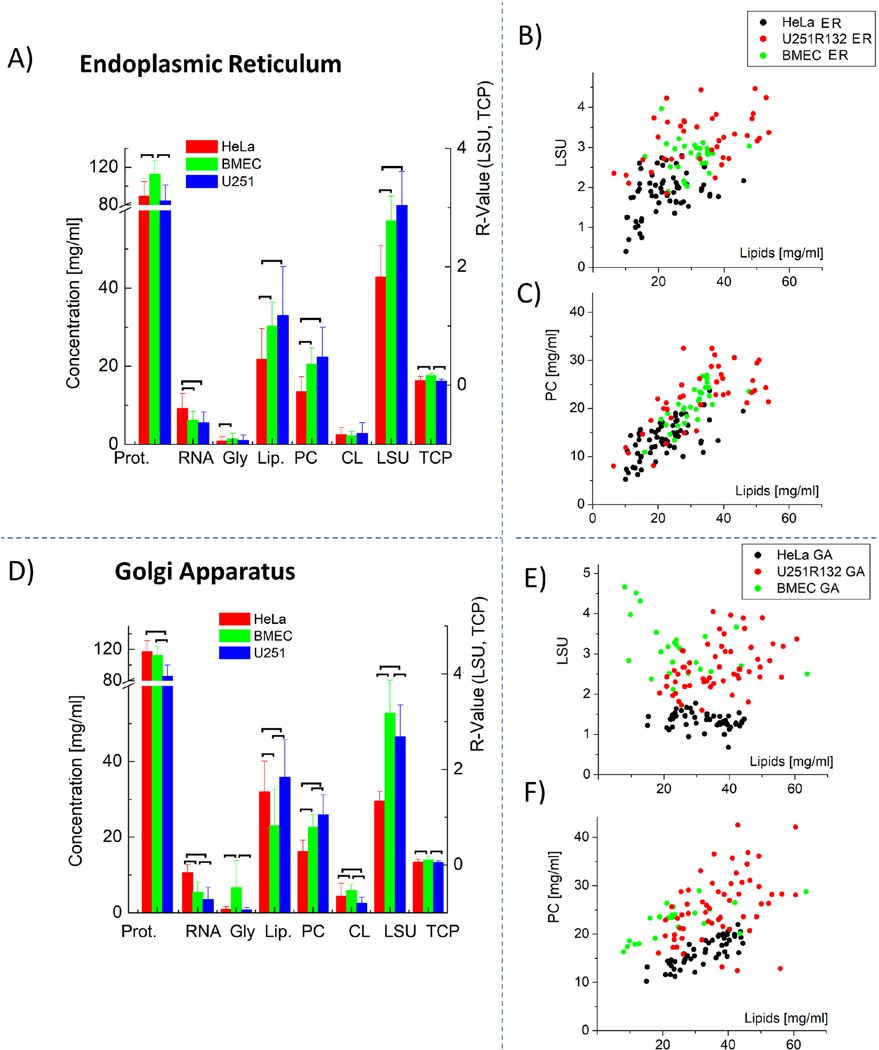
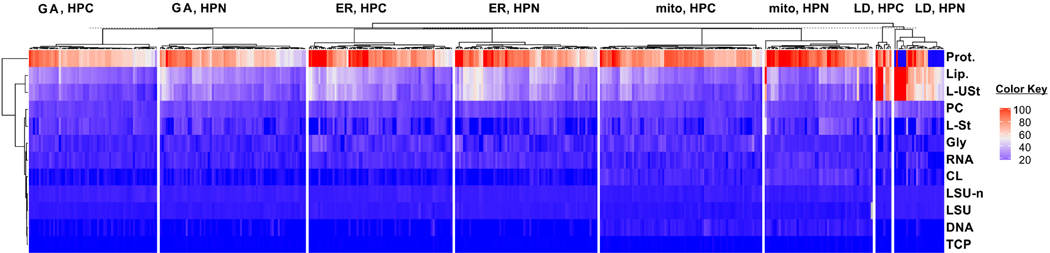
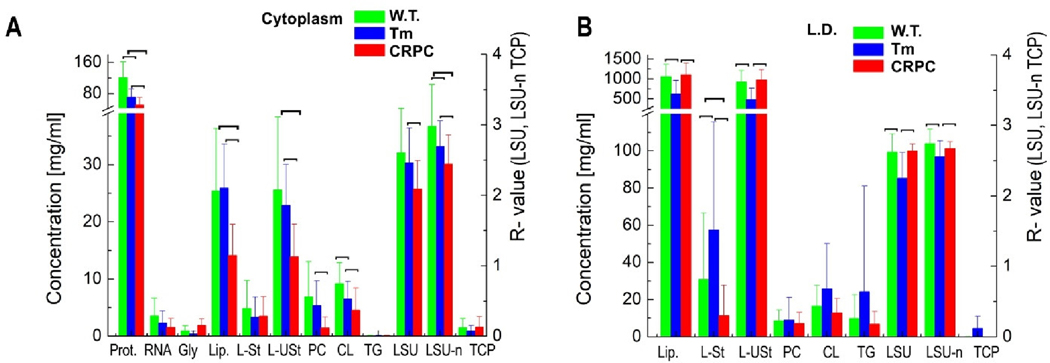
Research in fundamental cell biology and pathology could be revolutionized by developing the capacity for quantitative molecular analysis of subcellular structures. To that end, we introduce the Ramanomics platform, based on confocal Raman microspectrometry coupled to a biomolecular component analysis algorithm, which together enable us to molecularly profile single organelles in a live-cell environment. This emerging omics approach categorizes the entire molecular makeup of a sample into about a dozen of general classes and subclasses of biomolecules and quantifies their amounts in submicrometer volumes. A major contribution of our study is an attempt to bridge Raman spectrometry with big-data analysis in order to identify complex patterns of biomolecules in a single cellular organelle and leverage discovery of disease biomarkers. Our data reveal significant variations in organellar composition between different cell lines. We also demonstrate the merits of Ramanomics for identifying diseased cells by using prostate cancer as an example. We report large-scale molecular transformations in the mitochondria, Golgi apparatus, and endoplasmic reticulum that accompany the development of prostate cancer. Based on these findings, we propose that Ramanomics datasets in distinct organelles constitute signatures of cellular metabolism in healthy and diseased states.
Figures
Similar articles
-
Sexual Harassment and Prevention Training.2024 Mar 29. In: StatPearls [Internet]. Treasure Island (FL): StatPearls Publishing; 2025 Jan–. 2024 Mar 29. In: StatPearls [Internet]. Treasure Island (FL): StatPearls Publishing; 2025 Jan–. PMID: 36508513 Free Books & Documents.
-
Short-Term Memory Impairment.2024 Jun 8. In: StatPearls [Internet]. Treasure Island (FL): StatPearls Publishing; 2025 Jan–. 2024 Jun 8. In: StatPearls [Internet]. Treasure Island (FL): StatPearls Publishing; 2025 Jan–. PMID: 31424720 Free Books & Documents.
-
Quantitative Chemical Imaging of Organelles.Acc Chem Res. 2024 Jul 16;57(14):1906-1917. doi: 10.1021/acs.accounts.4c00191. Epub 2024 Jun 25. Acc Chem Res. 2024. PMID: 38916405 Free PMC article.
-
How lived experiences of illness trajectories, burdens of treatment, and social inequalities shape service user and caregiver participation in health and social care: a theory-informed qualitative evidence synthesis.Health Soc Care Deliv Res. 2025 Jun;13(24):1-120. doi: 10.3310/HGTQ8159. Health Soc Care Deliv Res. 2025. PMID: 40548558
-
Smartphone and tablet self management apps for asthma.Cochrane Database Syst Rev. 2013 Nov 27;2013(11):CD010013. doi: 10.1002/14651858.CD010013.pub2. Cochrane Database Syst Rev. 2013. PMID: 24282112 Free PMC article.
Cited by
-
Mitochondrial Dysfunction: A Prelude to Neuropathogenesis of SARS-CoV-2.ACS Chem Neurosci. 2022 Feb 2;13(3):308-312. doi: 10.1021/acschemneuro.1c00675. Epub 2022 Jan 20. ACS Chem Neurosci. 2022. PMID: 35049274 Free PMC article.
-
Identification of extracellular vesicles from their Raman spectra via self-supervised learning.Sci Rep. 2024 Mar 21;14(1):6791. doi: 10.1038/s41598-024-56788-7. Sci Rep. 2024. PMID: 38514697 Free PMC article.
-
Single cell metabolism: current and future trends.Metabolomics. 2022 Oct 1;18(10):77. doi: 10.1007/s11306-022-01934-3. Metabolomics. 2022. PMID: 36181583 Free PMC article. Review.
-
Lipidomics and temporal-spatial distribution of organelle lipid.J Biol Methods. 2025 Jan 16;12(1):e99010049. doi: 10.14440/jbm.2025.0094. eCollection 2025. J Biol Methods. 2025. PMID: 40200947 Free PMC article. Review.
-
Rapid, label-free histopathological diagnosis of liver cancer based on Raman spectroscopy and deep learning.Nat Commun. 2023 Jan 4;14(1):48. doi: 10.1038/s41467-022-35696-2. Nat Commun. 2023. PMID: 36599851 Free PMC article.
References
-
- Chan DC, Mitochondria: Dynamic organelles in disease, aging, and development. Cell 2006, 125 (7), 1241–1252. - PubMed
-
- Cox TM; Cachon-Gonzalez MB, The cellular pathology of lysosomal diseases. J Pathol 2012, 226 (2), 241–254. - PubMed
-
- Bozza PT; Viola JPB, Lipid droplets in inflammation and cancer. Prostag Leukotr Ess 2010, 82 (4–6), 243–250. - PubMed
Publication types
MeSH terms
Substances
Grants and funding
LinkOut - more resources
Full Text Sources
Other Literature Sources
