. 2021 Jun;20(12):1195-1208.
doi: 10.1080/15384101.2021.1930679. Epub 2021 May 28.

Energy restriction causes metaphase delay and chromosome mis-segregation in cancer cells

Affiliations

Energy restriction causes metaphase delay and chromosome mis-segregation in cancer cells

Aoxing Cheng et al. Cell Cycle. 2021 Jun.

Abstract

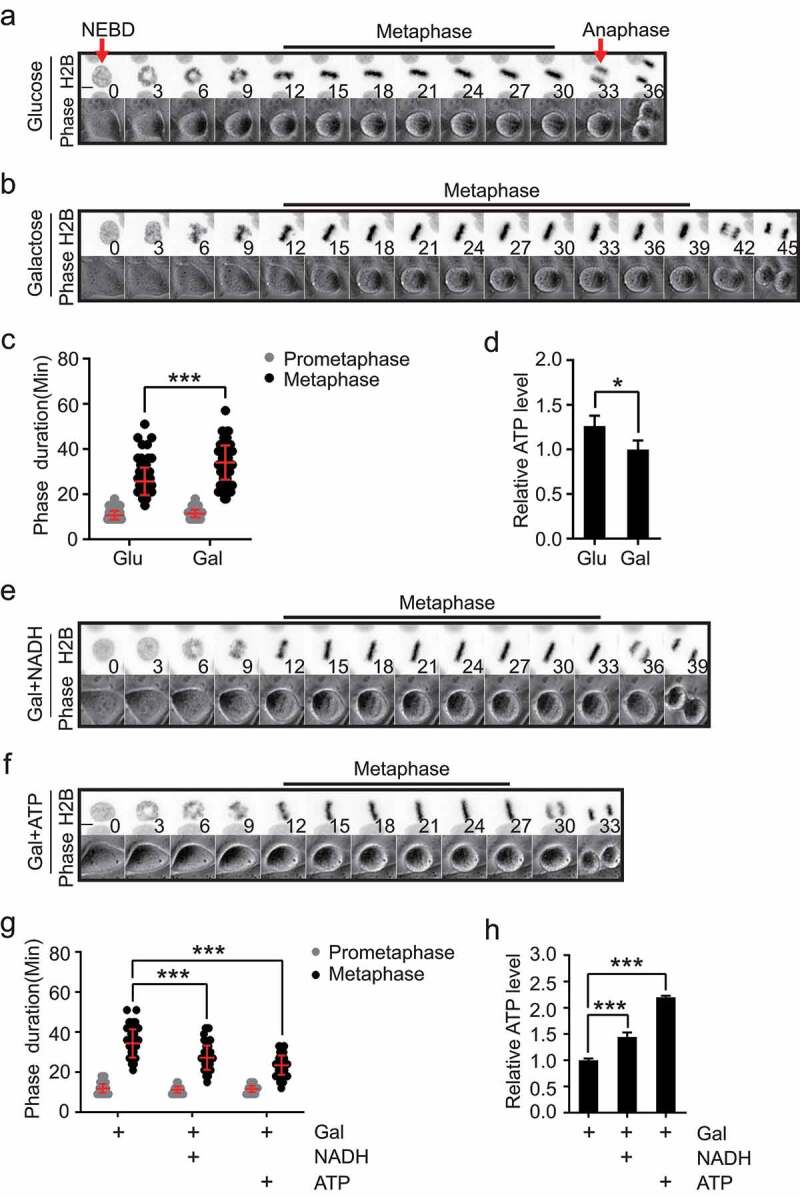
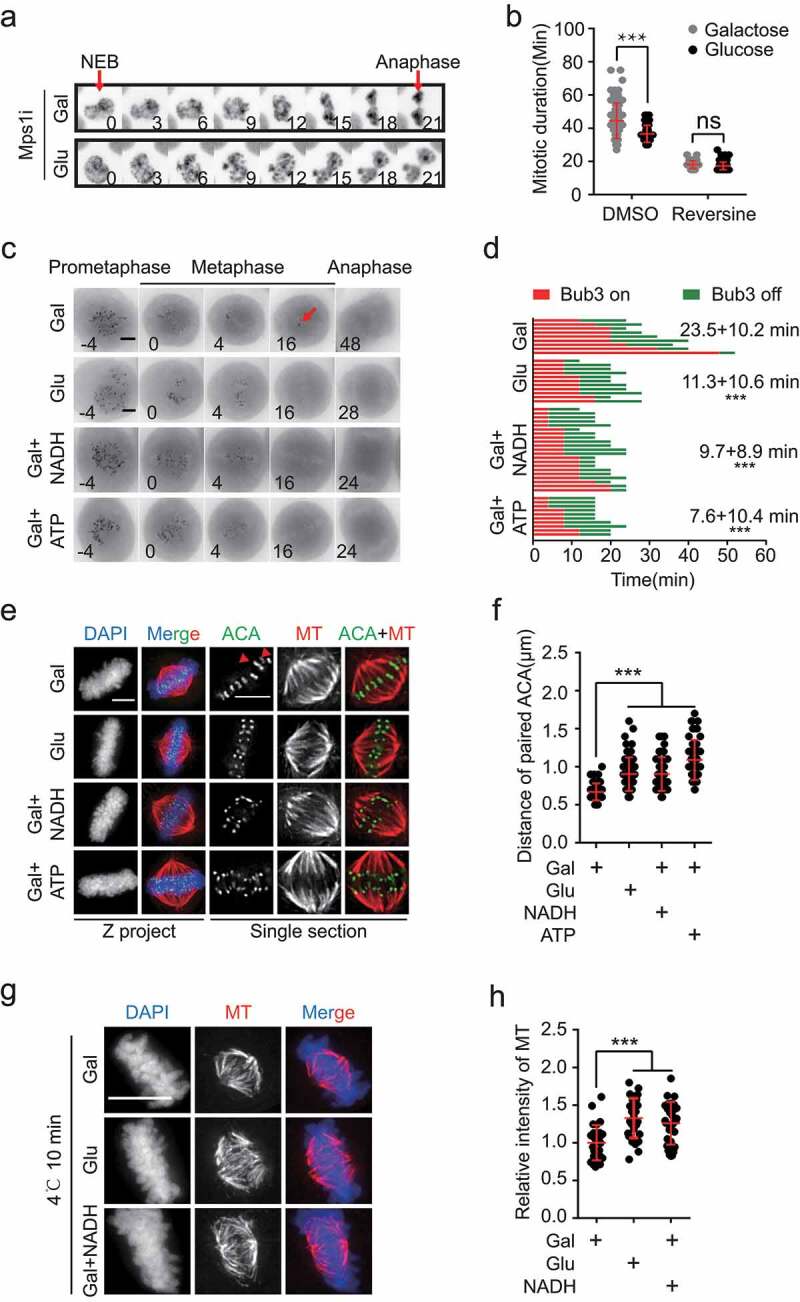
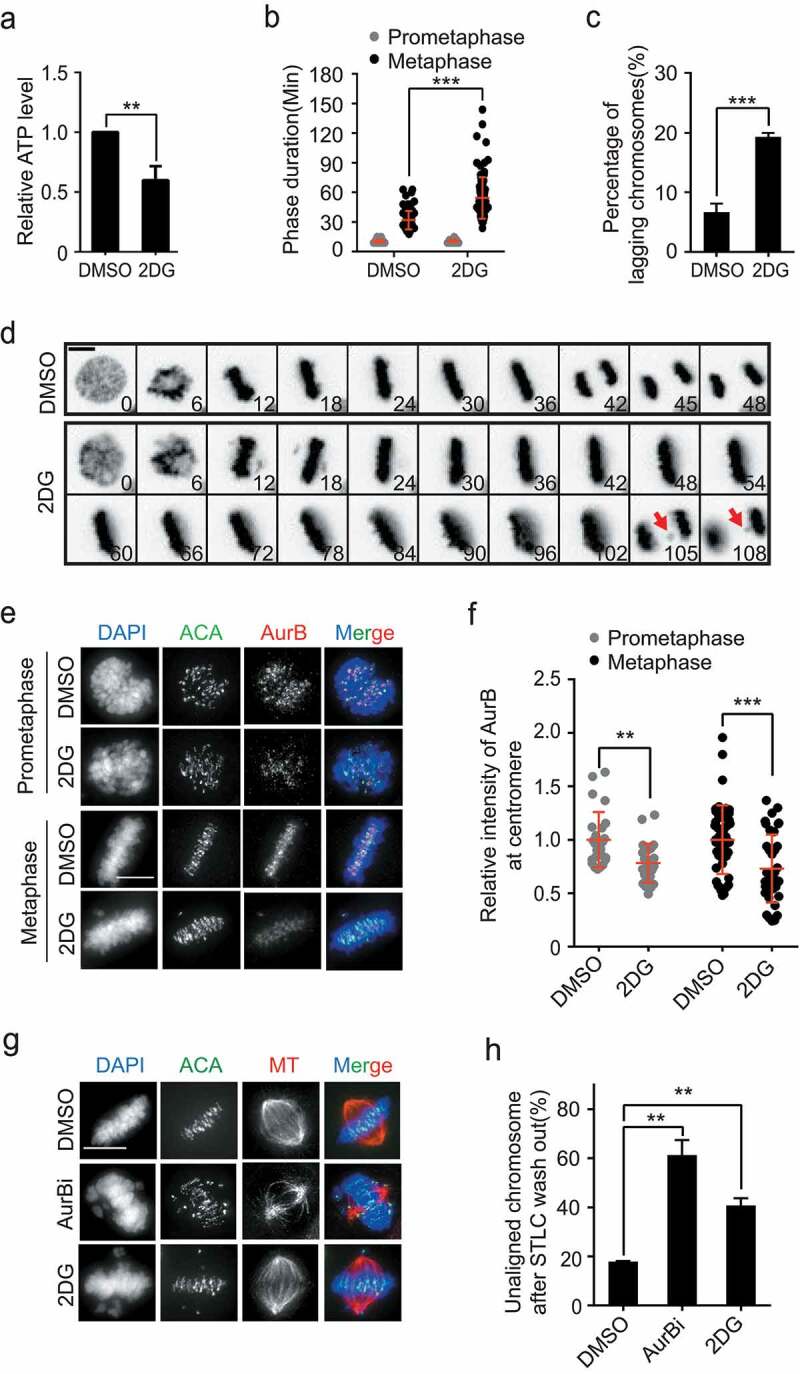
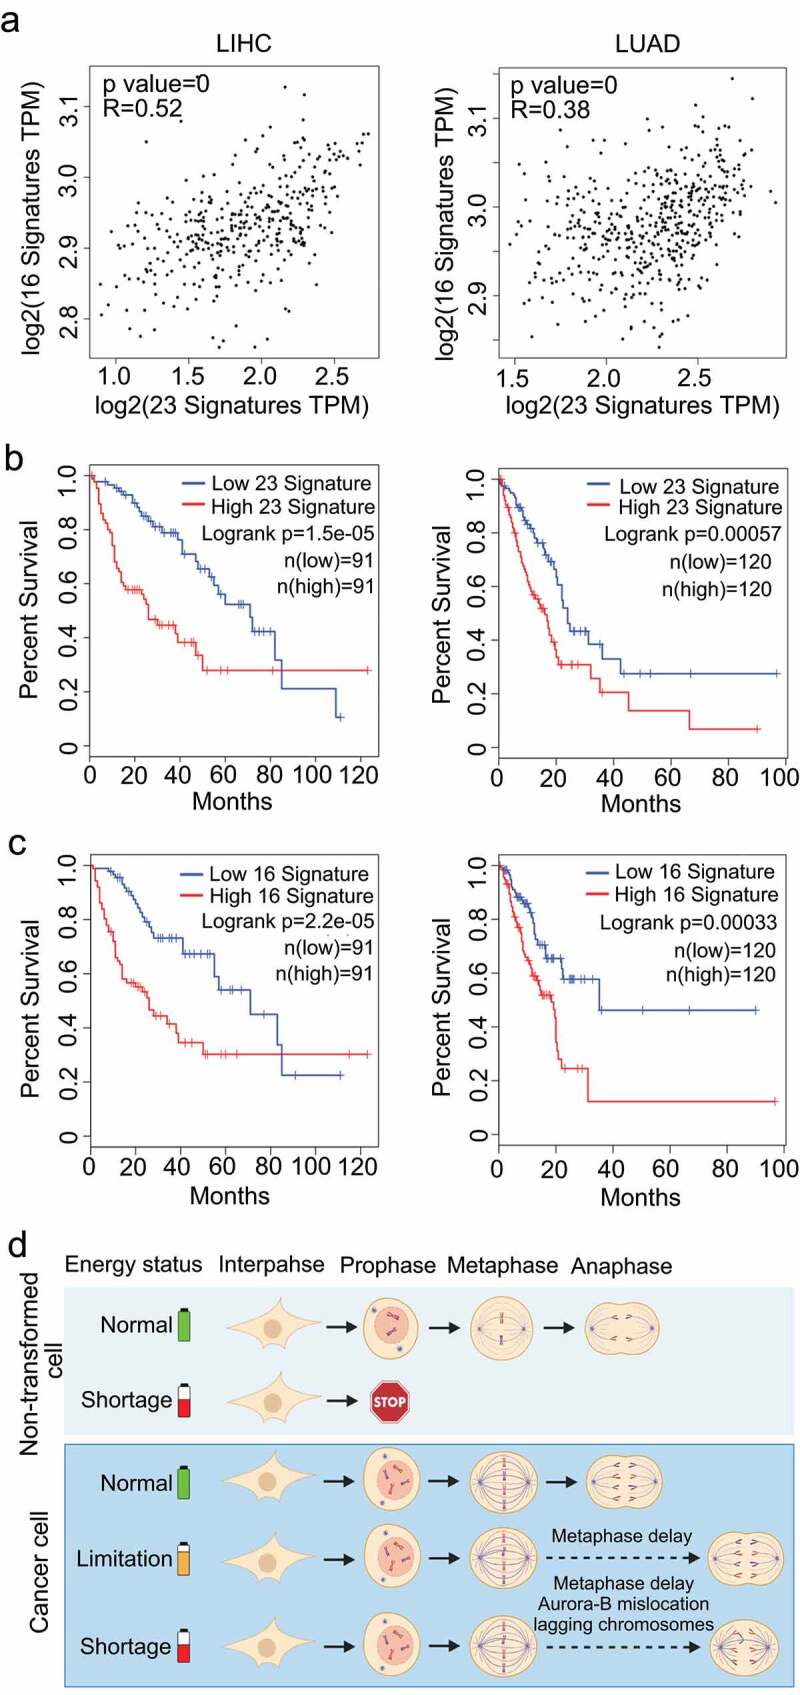
ATP metabolism during mitosis needs to be coordinated with numerous energy-demanding activities, especially in cancer cells whose metabolic pathways are reprogramed to sustain rapid proliferation in a nutrient-deficient environment. Although strategies targeting the energy metabolic pathways have shown therapeutic efficacy in preclinical cancer models, how normal cells and cancer cells differentially respond to energy shortage is unclear. In this study, using time-lapse microscopy, we found that cancer cells displayed unique mitotic phenotypes in a dose-dependent manner upon decreasing ATP (i.e. energy) supply. When reduction in ATP concentration was moderate, chromosome movements in mitosis were barely affected, while the metaphase-anaphase transition was significantly prolonged due to reduced tension between the sister-kinetochores, which delayed the satisfaction of the spindle assembly checkpoint. Further reduction in ATP concentration led to a decreased level of Aurora-B at the centromere, resulting in increased chromosome mis-segregation after metaphase delay. In contrast to cancer cells, ATP restriction in non-transformed cells induced cell cycle arrest in interphase, rather than causing mitotic defects. In addition, data mining of cancer patient database showed a correlation between signatures of energy production and chromosomal instability possibly resulted from mitotic defects. Together, these results reveal that energy restriction induces differential responses in normal and cancer cells, with chromosome mis-segregation only observed in cancer cells. This points to targeting energy metabolism as a potentially cancer-selective therapeutic strategy.

Keywords: ATP; cancer cells; chromosome mis-segregation; energy restriction; metaphase-anaphase transition.


Conflict of interest statement

No potential conflict of interest was reported by the author(s).

Figures

Figure 1.
Figure 1.
ATP restriction led to delay in metaphase to anaphase transition. (a–d) HeLa cells stably expressing GFP-H2B were imaged using both phase-contrast and fluorescence microscopy to monitor the duration of different mitotic phases in glucose (Glu) or galactose-containing (Gal) culture medium. Time 0 is defined as the NEBD (Nuclear Envelope Breakdown). Scale bar: 5 μm. Arrows indicate the Nuclear Envelope Breakdown and chromosome segregation at anaphase. Representative images are shown in (a, b), and the statistical results are shown in (c), n = 123 cells for Glu and n = 105 cells for Gal. Quantitation of the relative ATP level in mitotic cells cultured in glucose or galactose-containing medium is shown in (d), n = 3 independent experiments. (e-h) HeLa cells stably expressing GFP-H2B were treated with 1 mM NADH or 1 mM ATP and the durations of distinct mitotic phases were analyzed. Representative images are shown in (e, f), and the statistical results are shown in (g), n = 86 cells for Gal, n = 93 cells for Gal+NADH, n = 98 cells for Gal+ATP. Quantitation of the relative ATP level of mitotic HeLa cells cultured in galactose-containing medium with or without 1 mM NADH or 1 mM ATP is shown in (h), n = 3 independent experiments
Figure 2.
Figure 2.
ATP restriction delayed the satisfaction of the spindle assembly checkpoint. (a, b) HeLa cells stably expressing GFP-H2B were treated with 500 nM reversine (an inhibitor of Mps1 kinase) and durations of the mitotic phases in glucose or galactose-containing medium were analyzed. Scale bar: 5 μm. Representative images are shown in (a), and the statistical results are shown in (b), n = 76 cells for Gal, n = 51 cells for Glu, n = 56 cells for Gal+reversine, n = 118 cells for Glu+reversine. (c, d) HeLa cells stably expressing GFP-Bub3 were imaged to monitor kinetochore-microtubule connection in glucose, galactose-containing medium or galactose-containing medium treated with 1 mM NADH or 1 mM ATP. Scale bar: 5 μm. Arrows indicate the GFP-Bub3 positive kinetochore. Representative images are shown in (c), and the statistical results are shown in (d), n = 11 cells for Glu, n = 9 cells for Gal, n = 21 cells for Gal+NADH, n = 10 cells for Gal+ATP. Time 0 is defined at the completion of chromosome alignment. Average duration from time 0 to the time when Bub3 dissociates from kinetochore is labeled. (e,f) HeLa cells were synchronized with thymidine and released to Gal or Glu medium. 7 hours after the release from the thymidine block, 1 mM NADH or 1 mM ATP was added to the Gal medium. 2 hours later, the cells were fixed and stained with DAPI (Blue), α-tubulin (Red) and ACA (Green), Scale bar: 5 μm. Arrows indicate the mis-aligned or unaligned sister-kinetochore pairs. Representative images are shown in (e), and the statistical results of inter-kinetochore (paired ACA) distances are shown in (f), n = 69 for Gal, n = 69 for Glu, n = 62 for Gal+NADH, n = 69 for Gal+ATP. (g, h) HeLa cells were synchronized with thymidine and released to Gal or Glu medium. 7 hours after the release from the thymidine block, 1 mM NADH was added to the Gal medium. 2 hours later, the culture dish was placed on ice (4°C) for 10 minutes. Then the cells were fixed and stained with DAPI (Blue) and α-tubulin (Red). Scale bar: 10 μm. Representative images are shown in (g), and the statistical results of stable α-tubulin are shown in (h), n = 28 cells for Gal, n = 29 cells for Glu, n = 28 cells for Gal+NADH
Figure 3.
Figure 3.
Severe ATP restriction led to errors in chromosome segregation in cancer cells. (a-d) After treatment with or without 5 mM 2DG, the ATP levels of mitotic HeLa cells were detected. The statistical results are shown in (a), n = 4 independent experiments. The phase duration was analyzed. The statistical results are shown in (b), n = 104 cells for DMSO, n = 98 cells for 2DG. The percentage of lagging chromosome is shown in (c), n = 3 independent experiments. Representative images are shown in (d). Scale bar: 5 μm. Arrows indicate the lagging chromosomes. (e, f) Immunofluorescence staining of Aurora-B and ACA in HeLa cells at the prometaphase and metaphase after treatment with or without 5 mM 2DG. Representative images are shown in (e), Scale bar: 10 μm, and the statistical results are shown in (f), n = 25 cells for the prometaphase (DMSO), n = 26 cells for the prometaphase (2DG), n = 49 cells for the metaphase (DMSO), n = 38 cells for the metaphase (2DG). (g, h) HeLa cells were treated as indicated in the Supplementary Figure 4(i) and co-stained for α-tubulin (red), ACA (green), and DNA (blue). The representative immunofluorescence images are shown in (g), Scale bar: 10 μm. The statistical results of unaligned chromosomes are shown in (h), n = 2 independent experiments
Figure 4.
Figure 4.
ATP production-related gene cluster and CIN signature are positively correlated in LIHC and LUAD. (a) Data analyses from TCGA datasets showed that the expression of ATP production-related gene cluster and CIN signature are positively correlated in LIHC (Liver hepatocellular carcinoma) and LUAD (Lung adenocarcinoma). (b) Data analyses from TCGA datasets showed that the CIN signature predicts survival in LIHC and LUAD. (c) The ATP production-related gene cluster predicts survival in LIHC and LUAD. (d) Graphic summary

Similar articles

Cited by

References

    1. Jia L, Kim S, Yu H.. Tracking spindle checkpoint signals from kinetochores to APC/C. Trends Biochem Sci. 2013;38(6):302–311. - PubMed
    1. Skog S, Tribukait B, Sundius G. Energy metabolism and ATP turnover time during the cell cycle of Ehrlich ascites tumour cells. Exp Cell Res. 1982;141:23–29. - PubMed
    1. Salazar-Roa M, Malumbres M. Fueling the cell division cycle. Trends Cell Biol. 2017;27:69–81. - PubMed
    1. Wang Z, Fan M, Candas D, et al. Cyclin B1/Cdk1 coordinates mitochondrial respiration for cell-cycle G2/M progression. Dev Cell. 2014;29:217–232. - PMC - PubMed
    1. Harbauer AB, Opalińska M, Gerbeth C, et al. Mitochondria. Cell cycle-dependent regulation of mitochondrial preprotein translocase. Science. 2014;346:1109–1113. - PubMed

Publication types

MeSH terms