. 2021 May 28;17(5):e1009570.
doi: 10.1371/journal.pgen.1009570. eCollection 2021 May.

The DNMT3A PWWP domain is essential for the normal DNA methylation landscape in mouse somatic cells and oocytes

Affiliations

The DNMT3A PWWP domain is essential for the normal DNA methylation landscape in mouse somatic cells and oocytes

Kanako Kibe et al. PLoS Genet. .

Abstract

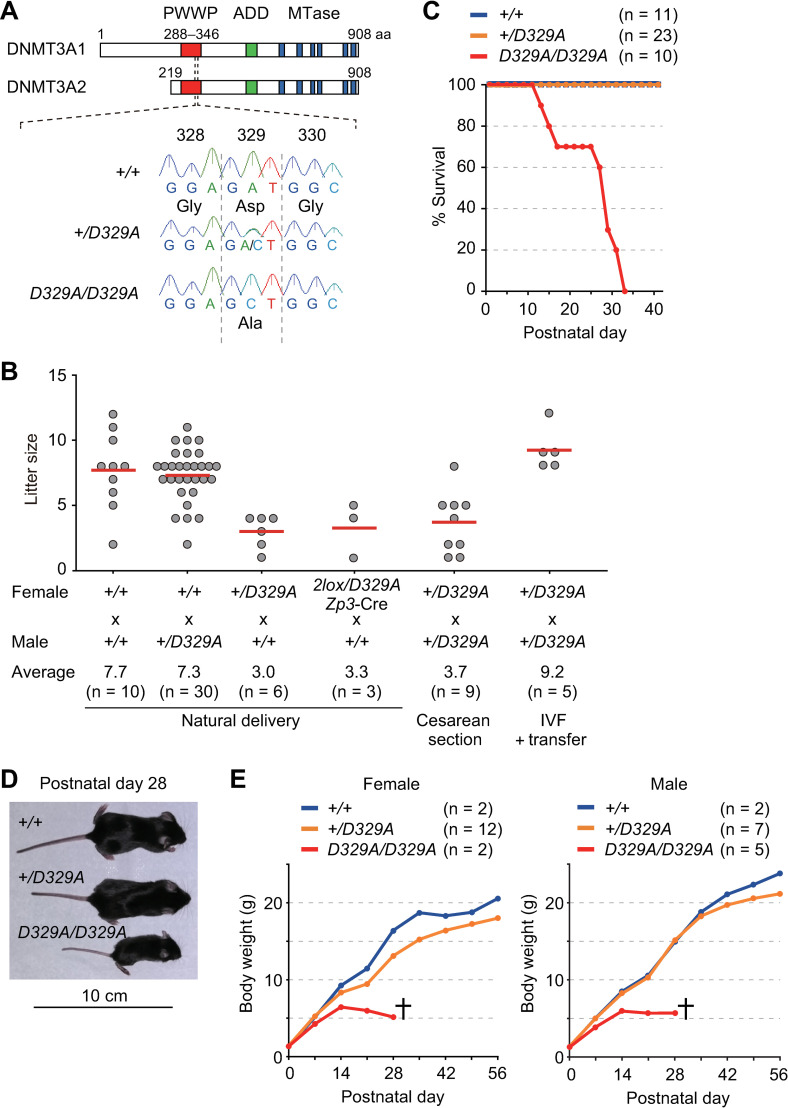
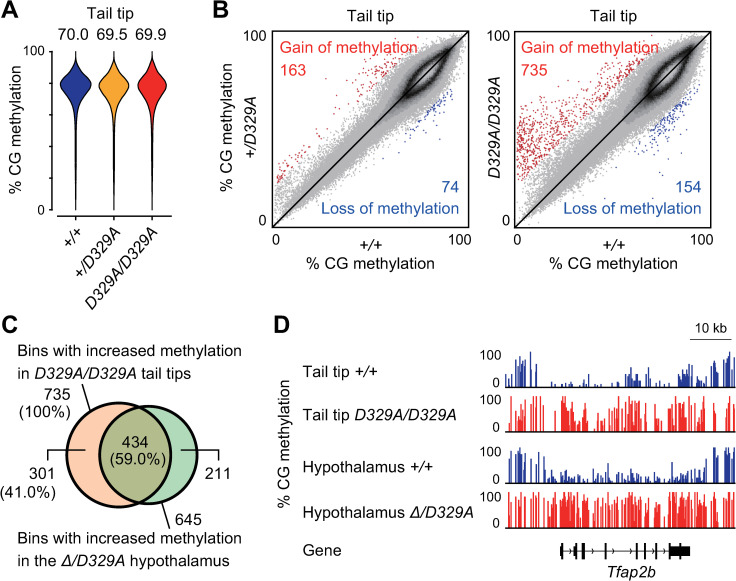
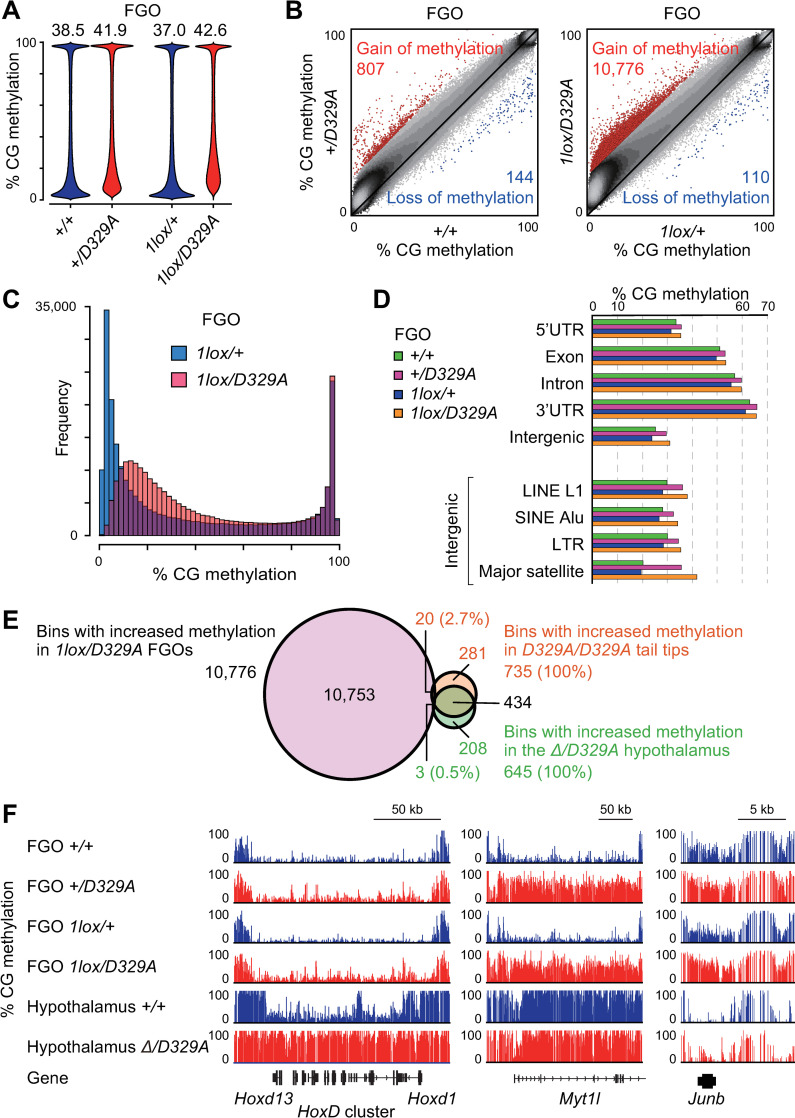
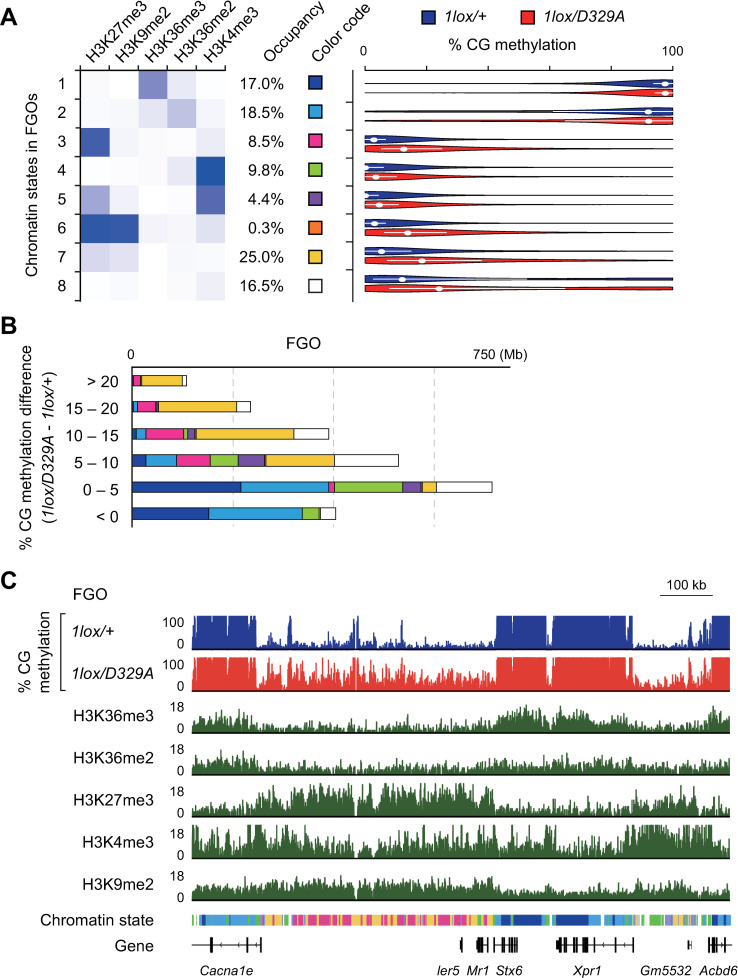
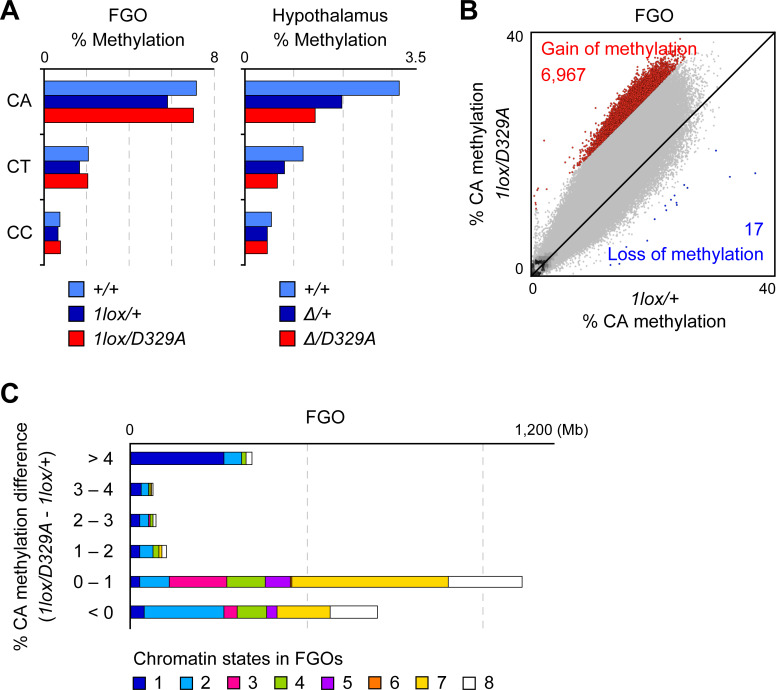
DNA methylation at CG sites is important for gene regulation and embryonic development. In mouse oocytes, de novo CG methylation requires preceding transcription-coupled histone mark H3K36me3 and is mediated by a DNA methyltransferase DNMT3A. DNMT3A has a PWWP domain, which recognizes H3K36me2/3, and heterozygous mutations in this domain, including D329A substitution, cause aberrant CG hypermethylation of regions marked by H3K27me3 in somatic cells, leading to a dwarfism phenotype. We herein demonstrate that D329A homozygous mice show greater CG hypermethylation and severer dwarfism. In oocytes, D329A substitution did not affect CG methylation of H3K36me2/3-marked regions, including maternally methylated imprinting control regions; rather, it caused aberrant hypermethylation in regions lacking H3K36me2/3, including H3K27me3-marked regions. Thus, the role of the PWWP domain in CG methylation seems similar in somatic cells and oocytes; however, there were cell-type-specific differences in affected regions. The major satellite repeat was also hypermethylated in mutant oocytes. Contrary to the CA hypomethylation in somatic cells, the mutation caused hypermethylation at CH sites, including CA sites. Surprisingly, oocytes expressing only the mutated protein could support embryonic and postnatal development. Our study reveals that the DNMT3A PWWP domain is important for suppressing aberrant CG hypermethylation in both somatic cells and oocytes but that D329A mutation has little impact on the developmental potential of oocytes.


Conflict of interest statement

The authors have declared that no competing interests exist.

Figures

Fig 1
Fig 1. The generation and phenotypic analysis of Dnmt3aD329A mice.
(A) The structure of mouse DNMT3A (DNMT3A1 and DNMT3A2) and the position of D329A substitution. Known domains are indicated by colored boxes. Oocytes express both DNMT3A1 and DNMT3A2 while most other cell types only express DNMT3A1. An example of genotyping by Sanger sequencing is shown. (B) Litter size at birth obtained upon various crosses. Horizontal bars represent the mean litter size. (C) Postnatal survival of pups of each genotype. (D) Gross morphology of mice representative of each genotype. (E) Body weight changes of each genotype during postnatal development.
Fig 2
Fig 2. Aberrant CG hypermethylation in Dnmt3aD329A tail tips.
(A) Bean plots showing the distributions of CG methylation levels of 10-kb bins in the tail tips of the indicated genotypes. The number above each plot indicates the global CG methylation level. (B) Scatter plots comparing the CG methylation levels of 10-kb bins between the tail tips of indicated genotypes. Bins showing a ≥20% increase and those showing a ≥20% decrease in mutants in comparison to wild-type controls are shown by red and blue dots, respectively. (C) A Venn diagram showing the overlap between hypermethylated 10-kb bins of Dnmt3aD329A/D329A tail tips and those of the Dnmt3aΔ/D329A hypothalamus. (D) A genome browser view of a region showing aberrant CG hypermethylation in tail tips and the hypothalamus. Published data were used for the CG methylation profiles of hypothalamus [41].
Fig 3
Fig 3. Aberrant CG hypermethylation in Dnmt3aD329A oocytes.
(A) Bean plots showing the distributions of CG methylation levels of 10-kb bins in FGOs of the indicated genotypes. The number above each plot indicates the global CG methylation level. (B) Scatter plots comparing the CG methylation levels of 10-kb bins between FGOs of the indicated genotypes. Bins showing a ≥20% increase and those showing a ≥20% decrease in mutants in comparison to controls are shown by red and blue dots, respectively. (C) Histograms showing the frequencies of 10-kb bins across CG methylation levels in Dnmt3a1lox/+ and Dnmt3a1lox/D329A FGOs. (D) The CG methylation levels of indicated genomic annotations and repeats in FGOs of the indicated genotypes. Note that introns and intergenic regions contain various repeat sequences in addition to unique sequences. (E) A Venn diagram showing the overlaps between hypermethylated bins in indicated tissues of the indicated genotypes. (F) A genome browser view of regions showing CG hypermethylation (middle and right) and those showing little change (left) in mutant FGOs. Note that the HoxD cluster is hypermethylated in mutant hypothalamus but not in mutant FGOs.
Fig 4
Fig 4. Aberrant CG hypermethylation and histone H3 marks in Dnmt3aD329A oocytes.
(A) Definition of an eight-state model based on five histone H3 marks in wild-type FGOs. Darker shades of blue in the emission profile represent greater enrichment of the histone mark in each chromatin state (left). The genomic occupancy of each chromatin state is also shown. Violin plots show the distribution of CG methylation levels (single CGs, sequencing depth >15) within regions labeled with each chromatin state in FGOs of the indicated genotypes (right). White dots and bars indicate the median and first and third quartiles, respectively. (B) Stacked bar charts showing the abundance of each chromatin state in the bulk of 10-kb bins with the indicated degrees of CG hypermethylation in Dnmt3a1lox/D329A FGOs in comparison to Dnmt3a1lox/+ FGOs. The chromatin states are indicated by the color code shown in (A). (C) A genome browser view showing the CG methylation levels (%) in Dnmt3a1lox/D329A FGOs and histone marks (RPM) and chromatin states in wild-type FGOs. The chromatin states are indicated below the histone mark profiles using the color code shown in (A).
Fig 5
Fig 5. Aberrant CH methylation in Dnmt3aD329A oocytes.
(A) Bar graphs showing the methylation levels of the respective CH dinucleotides in FGOs (left) and the hypothalamus (right) of indicated genotypes. (B) Scatter plot comparing the CA methylation levels of 10-kb bins between FGOs of the indicated genotypes. Bins showing a ≥10% increase and those showing a ≥10% decrease in mutant FGOs in comparison to control FGOs are shown by red and blue dots, respectively. (C) Stacked bar charts showing the abundance of each chromatin state in the bulk of 10-kb bins with different degrees of CA hypermethylation in Dnmt3a1lox/D329A FGOs in comparison to Dnmt3a1lox/+ FGOs. The chromatin states correspond to those defined in Fig 4A.

Similar articles

Cited by

References

    1. Schübeler D. Function and information content of DNA methylation. Nature. 2015; 517: 321–326. 10.1038/nature14192 - DOI - PubMed
    1. Smith ZD, Meissner A. The simplest explanation: passive DNA demethylation in PGCs. EMBO J. 2013; 32: 318–321. 10.1038/emboj.2012.349 - DOI - PMC - PubMed
    1. Greenberg MVC, Bourc’his D. The diverse roles of DNA methylation in mammalian development and disease. Nat Rev Mol Cell Biol. 2019; 20, 590–607. 10.1038/s41580-019-0159-6 - DOI - PubMed
    1. Lister R, Pelizzola M, Dowen RH, Hawkins RD, Hon G, Tonti-Filippini J, et al.. Human DNA methylomes at base resolution show widespread epigenomic differences. Nature. 2009; 462: 315–322. 10.1038/nature08514 - DOI - PMC - PubMed
    1. Laurent L, Wong E, Li G, Huynh T, Tsirigos A, Ong CT, et al.. Dynamic changes in the human methylome during differentiation. Genome Res. 2010; 20: 320–331. 10.1101/gr.101907.109 - DOI - PMC - PubMed

Publication types