A proposed population-health based metric for evaluating representativeness of air quality monitoring in cities: Using Hong Kong as a demonstration
- PMID: 34048462
- PMCID: PMC8162681
- DOI: 10.1371/journal.pone.0252290
A proposed population-health based metric for evaluating representativeness of air quality monitoring in cities: Using Hong Kong as a demonstration
Abstract
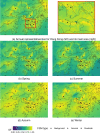
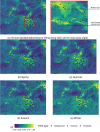
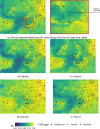
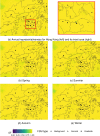
City air quality monitoring (AQM) network are typically sparsely distributed due to high operation costs. It is of the question of how well it can reflect public health risks to air pollution given the diversity and heterogeneity in pollution, and spatial variations in population density. Combing high-resolution air quality model, spatial population distribution and health risk factors, we proposed a population-health based metric for AQM representativeness. This metric was demonstrated in Hong Kong using hourly modelling data of PM10, PM2.5, NO2 and O3 in 2019 with grid cells of 45m * 48m. Individual and total hospital admission risks (%AR) of these pollutants were calculated for each cell, and compared with those calculated at 16 monitoring sites using the similarity frequency (SF) method. AQM Representativeness was evaluated by SF and a population-health based network representation index (PHNI), which is population-weighted SF over the study-domain. The representativeness varies substantially among sites as well as between population- and area-based evaluation methods, reflecting heterogeneity in pollution and population. The current AQM network reflects population health risks well for PM10 (PHNI = 0.87) and PM2.5 (PHNI = 0.82), but is less able to represent risks for NO2 (PHNI = 0.59) and O3 (PHNI = 0.78). Strong seasonal variability in PHNI was found for PM, increasing by >11% during autumn and winter compared to summer due to regional transport. NO2 is better represented in urban than rural, reflecting the heterogeneity of urban traffic pollution. Combined health risk (%ARtotal) is well represented by the current AQM network (PHNI = 1), which is more homogenous due to the dominance and anti-correlation of NO2 and O3 related %AR. The proposed PHNI metric is useful to compare the health risk representativeness of AQM for individual and multiple pollutants and can be used to compare the effectiveness of AQM across cities.
Conflict of interest statement
The authors have declared that no competing interests exist.
Figures


Similar articles
-
The impact of the congestion charging scheme on air quality in London. Part 1. Emissions modeling and analysis of air pollution measurements.Res Rep Health Eff Inst. 2011 Apr;(155):5-71. Res Rep Health Eff Inst. 2011. PMID: 21830496
-
Part 4. Interaction between air pollution and respiratory viruses: time-series study of daily mortality and hospital admissions in Hong Kong.Res Rep Health Eff Inst. 2010 Nov;(154):283-362. Res Rep Health Eff Inst. 2010. PMID: 21446214
-
Assessment of the impact of sensor error on the representativeness of population exposure to urban air pollutants.Environ Int. 2022 Jul;165:107329. doi: 10.1016/j.envint.2022.107329. Epub 2022 May 30. Environ Int. 2022. PMID: 35660952
-
The London low emission zone baseline study.Res Rep Health Eff Inst. 2011 Nov;(163):3-79. Res Rep Health Eff Inst. 2011. PMID: 22315924
-
Characteristics of Major Air Pollutants in China.Adv Exp Med Biol. 2017;1017:7-26. doi: 10.1007/978-981-10-5657-4_2. Adv Exp Med Biol. 2017. PMID: 29177957 Review.
Cited by
-
Estimation of On-Road PM2.5 Distributions by Combining Satellite Top-of-Atmosphere With Microscale Geographic Predictors for Healthy Route Planning.Geohealth. 2022 Sep 1;6(9):e2022GH000669. doi: 10.1029/2022GH000669. eCollection 2022 Sep. Geohealth. 2022. PMID: 36101834 Free PMC article.
-
Risk tradeoffs between nitrogen dioxide and ozone pollution during the COVID-19 lockdowns in the Greater Bay area of China.Atmos Pollut Res. 2022 Oct;13(10):101549. doi: 10.1016/j.apr.2022.101549. Epub 2022 Sep 6. Atmos Pollut Res. 2022. PMID: 36092859 Free PMC article.
References
-
- D’amato G, Cecchi L, Amato D’, Liccardi G. Urban Air Pollution and Climate Change as Environmental Risk Factors of Respiratory Allergy: An Update. J Investig Allergol Clin Immunol. 2010. - PubMed
-
- Sunyer J. Urban air pollution and chronic obstructive pulmonary disease: a review Histological background. Eur Respir J. 2001;17. - PubMed
-
- Bhatnagar A. Environmental cardiology: Studying mechanistic links between pollution and heart disease. Circulation Research. 2006. pp. 692–705. 10.1161/01.RES.0000243586.99701.cf - DOI - PubMed
-
- World Health Organization. Ambient Air Pollution: A global assessment of exposure and burden of disease. World Heal Organ. 2016.
Publication types
MeSH terms
Substances
LinkOut - more resources
Full Text Sources
Other Literature Sources
Medical
Research Materials

