

Smell compounds classification using UMAP to increase knowledge of odors and molecular structures linkages
- PMID: 34048487
- PMCID: PMC8162648
- DOI: 10.1371/journal.pone.0252486
Smell compounds classification using UMAP to increase knowledge of odors and molecular structures linkages
Abstract
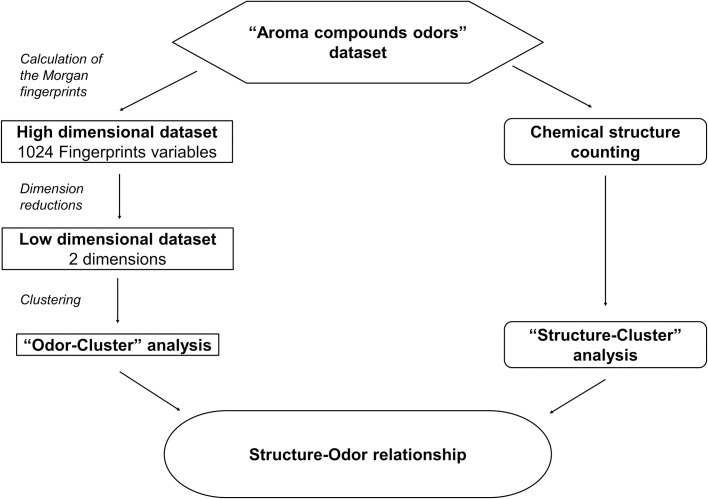
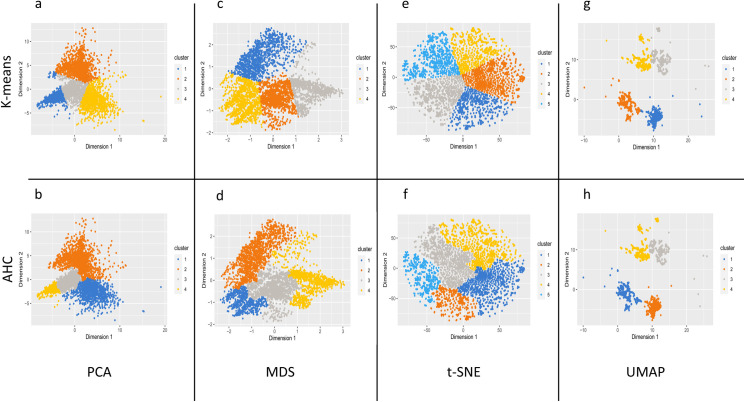
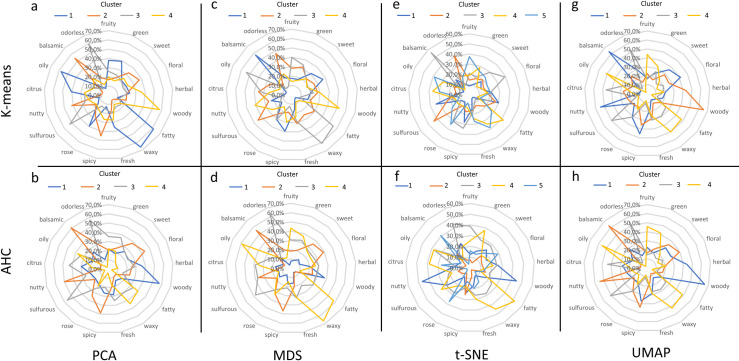
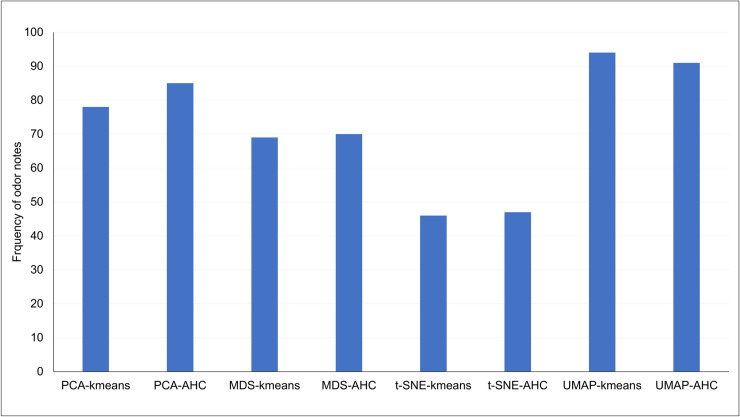
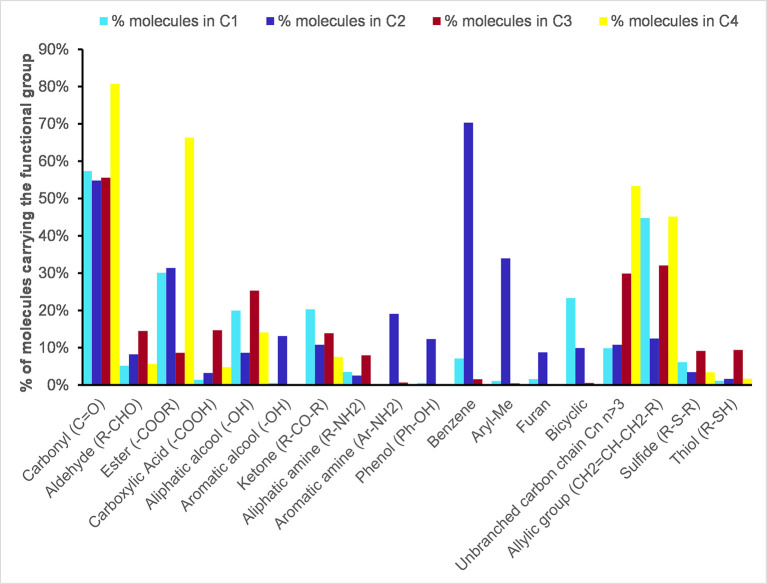
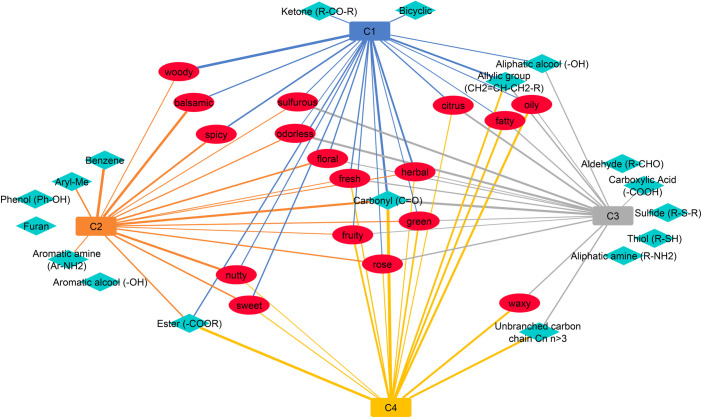
This study aims to highlight the relationships between the structure of smell compounds and their odors. For this purpose, heterogeneous data sources were screened, and 6038 odorant compounds and their known associated odors (162 odor notes) were compiled, each individual molecule being represented with a set of 1024 structural fingerprint. Several dimensional reduction techniques (PCA, MDS, t-SNE and UMAP) with two clustering methods (k-means and agglomerative hierarchical clustering AHC) were assessed based on the calculated fingerprints. The combination of UMAP with k-means and AHC methods allowed to obtain a good representativeness of odors by clusters, as well as the best visualization of the proximity of odorants on the basis of their molecular structures. The presence or absence of molecular substructures has been calculated on odorant in order to link chemical groups to odors. The results of this analysis bring out some associations for both the odor notes and the chemical structures of the molecules such as "woody" and "spicy" notes with allylic and bicyclic structures, "balsamic" notes with unsaturated rings, both "sulfurous" and "citrus" with aldehydes, alcohols, carboxylic acids, amines and sulfur compounds, and "oily", "fatty" and "fruity" characterized by esters and with long carbon chains. Overall, the use of UMAP associated to clustering is a promising method to suggest hypotheses on the odorant structure-odor relationships.
Conflict of interest statement
The authors have declared that no competing interests exist.
Figures

Similar articles
-
Combining the Classification and Pharmacophore Approaches to Understand Homogeneous Olfactory Perceptions at Peripheral Level: Focus on Two Aroma Mixtures.Molecules. 2023 May 11;28(10):4028. doi: 10.3390/molecules28104028. Molecules. 2023. PMID: 37241770 Free PMC article.
-
Dimensionality reduction by UMAP reinforces sample heterogeneity analysis in bulk transcriptomic data.Cell Rep. 2021 Jul 27;36(4):109442. doi: 10.1016/j.celrep.2021.109442. Cell Rep. 2021. PMID: 34320340
-
Multivariate Statistical Analysis and Odor-Taste Network To Reveal Odor-Taste Associations.J Agric Food Chem. 2020 Sep 23;68(38):10318-10328. doi: 10.1021/acs.jafc.9b05462. Epub 2019 Nov 22. J Agric Food Chem. 2020. PMID: 31691560
-
Odors: from chemical structures to gaseous plumes.Neurosci Biobehav Rev. 2020 Apr;111:19-29. doi: 10.1016/j.neubiorev.2020.01.009. Epub 2020 Jan 10. Neurosci Biobehav Rev. 2020. PMID: 31931034 Free PMC article. Review.
-
The perception of odor is not a surrogate marker for chemical exposure: a review of factors influencing human odor perception.Clin Toxicol (Phila). 2013 Feb;51(2):70-6. doi: 10.3109/15563650.2013.767908. Clin Toxicol (Phila). 2013. PMID: 23387344 Review.
Cited by
-
Biocatalytic Production of Aldehydes: Exploring the Potential of Lathyrus cicera Amine Oxidase.Biomolecules. 2021 Oct 18;11(10):1540. doi: 10.3390/biom11101540. Biomolecules. 2021. PMID: 34680172 Free PMC article.
-
Combining the Classification and Pharmacophore Approaches to Understand Homogeneous Olfactory Perceptions at Peripheral Level: Focus on Two Aroma Mixtures.Molecules. 2023 May 11;28(10):4028. doi: 10.3390/molecules28104028. Molecules. 2023. PMID: 37241770 Free PMC article.
-
A topological data analysis-based method for gait signals with an application to the study of multiple sclerosis.PLoS One. 2022 May 13;17(5):e0268475. doi: 10.1371/journal.pone.0268475. eCollection 2022. PLoS One. 2022. PMID: 35560328 Free PMC article.
-
Identification of STAT3 phosphorylation inhibitors using generative deep learning, virtual screening, molecular dynamics simulations, and biological evaluation for non-small cell lung cancer therapy.Mol Divers. 2025 Aug;29(4):3189-3205. doi: 10.1007/s11030-024-11067-5. Epub 2024 Dec 23. Mol Divers. 2025. PMID: 39715975 Free PMC article.
-
Pred-O3, a web server to predict molecules, olfactory receptors and odor relationships.Nucleic Acids Res. 2024 Jul 5;52(W1):W507-W512. doi: 10.1093/nar/gkae305. Nucleic Acids Res. 2024. PMID: 38661190 Free PMC article.
References
-
- Braga A, Guerreiro C, Belo I. Generation of Flavors and Fragrances Through Biotransformation and De Novo Synthesis. Food Bioprocess Technol. 2018. December;11(12):2217–28.
-
- Kini A, Firestein S. The Molecular Basis of Olfaction. CHIMIA International Journal for Chemistry. 2001;453–9.
Publication types
MeSH terms
LinkOut - more resources
Full Text Sources
Other Literature Sources
Research Materials
Miscellaneous
