

Characterization of a Sex-Determining Region and Its Genomic Context via Statistical Estimates of Haplotype Frequencies in Daughters and Sons Sequenced in Pools
- PMID: 34048551
- PMCID: PMC8350356
- DOI: 10.1093/gbe/evab121
Characterization of a Sex-Determining Region and Its Genomic Context via Statistical Estimates of Haplotype Frequencies in Daughters and Sons Sequenced in Pools
Abstract
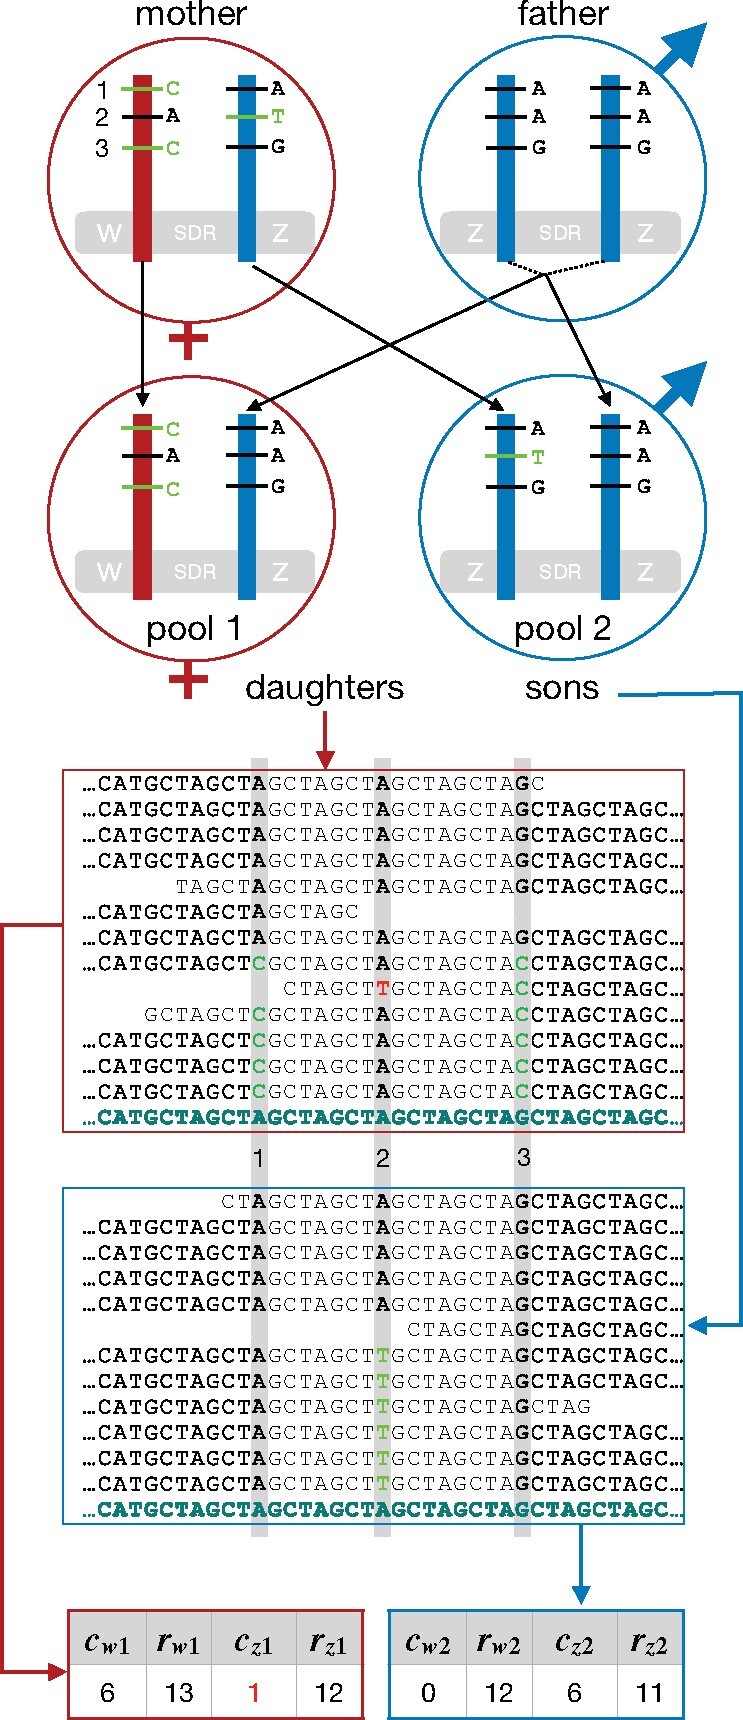
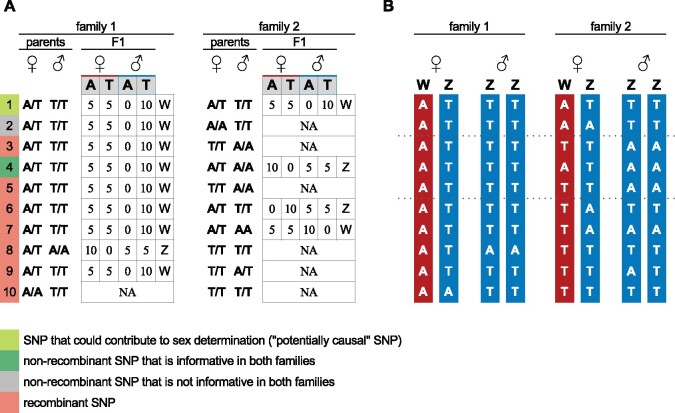
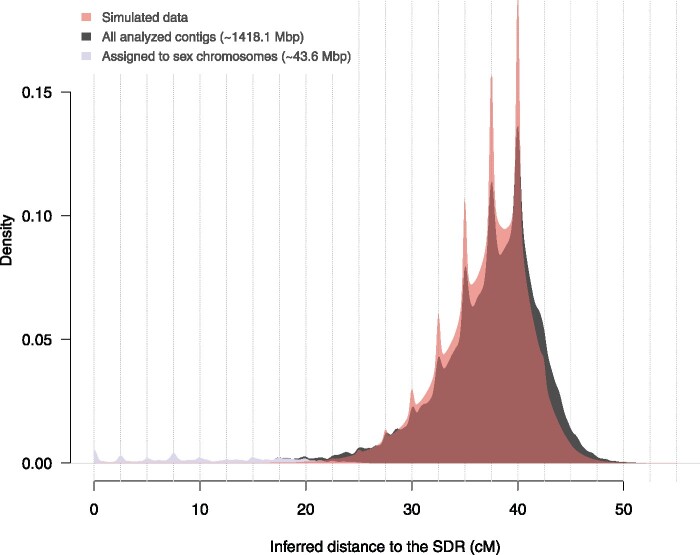
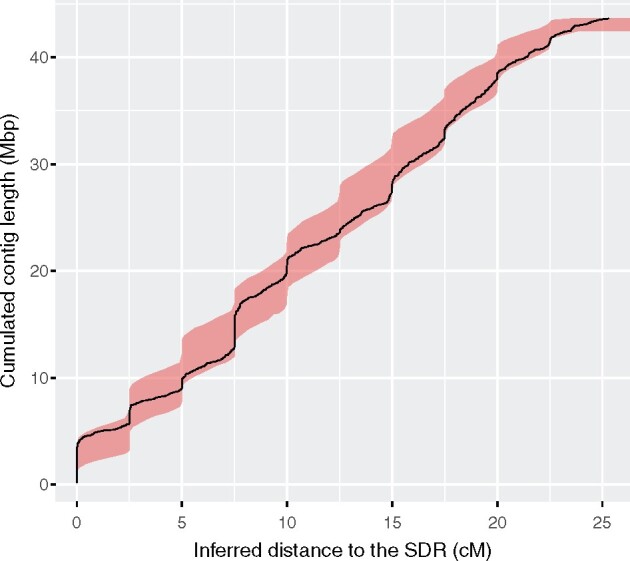
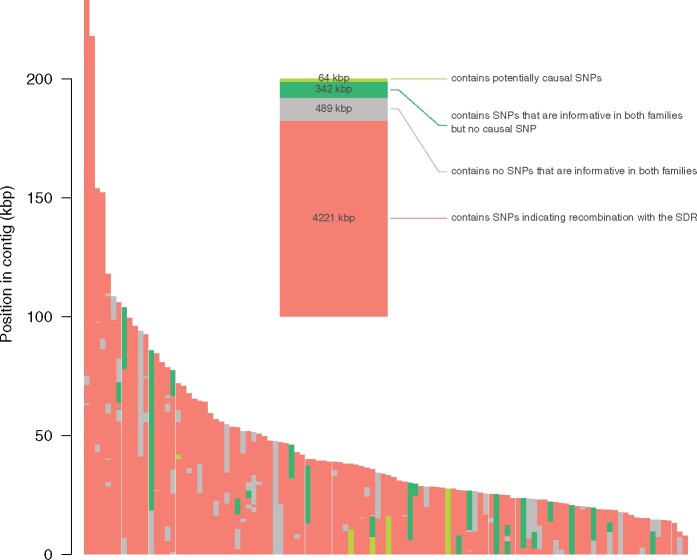
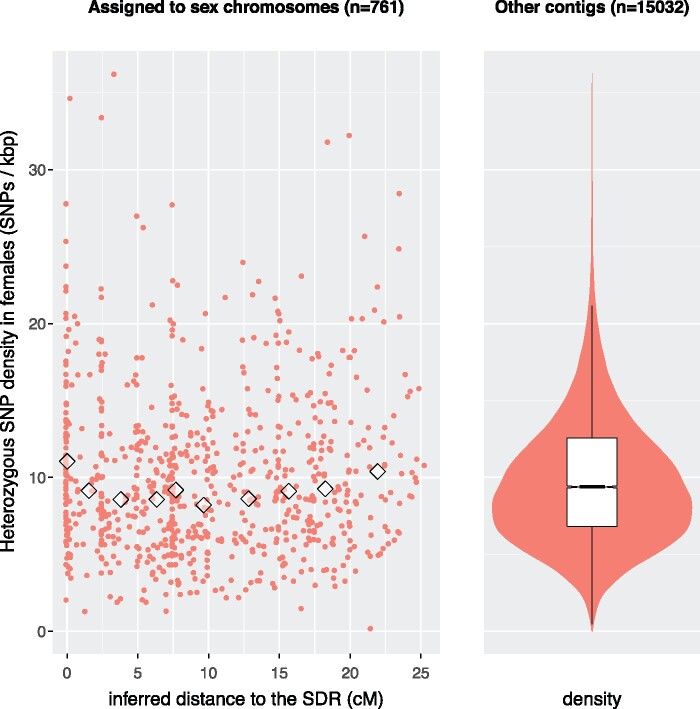
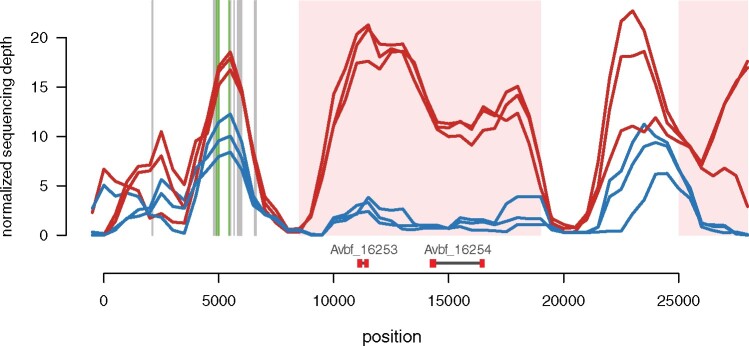
Sex chromosomes are generally derived from a pair of autosomes that have acquired a locus controlling sex. Sex chromosomes may evolve reduced recombination around this locus and undergo a long process of molecular divergence. At that point, the original loci controlling sex may be difficult to pinpoint. This difficulty has affected many model species from mammals to birds to flies, which present highly diverged sex chromosomes. Identifying sex-controlling loci is easier in species with molecularly similar sex chromosomes. Here we aimed at pinpointing the sex-determining region (SDR) of Armadillidium vulgare, a terrestrial isopod with female heterogamety (ZW females and ZZ males) and whose sex chromosomes appear to show low genetic divergence. To locate the SDR, we assessed single-nucleotide polymorphism (SNP) allele frequencies in F1 daughters and sons sequenced in pools (pool-seq) in several families. We developed a Bayesian method that uses the SNP genotypes of individually sequenced parents and pool-seq data from F1 siblings to estimate the genetic distance between a given genomic region (contig) and the SDR. This allowed us to assign more than 43 Mb of contigs to sex chromosomes, and to demonstrate extensive recombination and very low divergence between these chromosomes. By taking advantage of multiple F1 families, we delineated a very short genomic region (∼65 kb) that presented no evidence of recombination with the SDR. In this short genomic region, the comparison of sequencing depths between sexes highlighted female-specific genes that have undergone recent duplication, and which may be involved in sex determination in A. vulgare.
Keywords: SNP; gene duplication; pool-seq; recombination; sex chromosomes; terrestrial isopods.
© The Author(s) 2021. Published by Oxford University Press on behalf of the Society for Molecular Biology and Evolution.
Figures
Similar articles
-
The Genome of Armadillidium vulgare (Crustacea, Isopoda) Provides Insights into Sex Chromosome Evolution in the Context of Cytoplasmic Sex Determination.Mol Biol Evol. 2019 Apr 1;36(4):727-741. doi: 10.1093/molbev/msz010. Mol Biol Evol. 2019. PMID: 30668787
-
Divergent Evolutionary Trajectories of Two Young, Homomorphic, and Closely Related Sex Chromosome Systems.Genome Biol Evol. 2018 Mar 1;10(3):742-755. doi: 10.1093/gbe/evy045. Genome Biol Evol. 2018. PMID: 29608717 Free PMC article.
-
Reconstruction of female heterogamety from admixture of XX-XY and ZZ-ZW sex-chromosome systems within a frog species.Mol Ecol. 2018 Oct;27(20):4078-4089. doi: 10.1111/mec.14831. Epub 2018 Sep 4. Mol Ecol. 2018. PMID: 30086193
-
Avian sex, sex chromosomes, and dosage compensation in the age of genomics.Chromosome Res. 2014 Apr;22(1):45-57. doi: 10.1007/s10577-014-9409-9. Chromosome Res. 2014. PMID: 24599719 Review.
-
[Origin and evolution of mammalian sex chromosomes].C R Acad Sci III. 2001 Jan;324(1):1-11. doi: 10.1016/s0764-4469(00)01278-6. C R Acad Sci III. 2001. PMID: 11212497 Review. French.
Cited by
-
Temporal stability of sex ratio distorter prevalence in natural populations of the isopod Armadillidium vulgare.Heredity (Edinb). 2024 Nov;133(5):287-297. doi: 10.1038/s41437-024-00713-1. Epub 2024 Aug 6. Heredity (Edinb). 2024. PMID: 39107546
-
Heterogeneous distribution of sex ratio distorters in natural populations of the isopod Armadillidium vulgare.Biol Lett. 2023 Jan;19(1):20220457. doi: 10.1098/rsbl.2022.0457. Epub 2023 Jan 11. Biol Lett. 2023. PMID: 36628964 Free PMC article.
References
-
- Akagi T, Henry IM, Tao R, Comai L.. 2014. A Y-chromosome–encoded small RNA acts as a sex determinant in persimmons. Science 346:646. - PubMed
-
- Artault J-C. 1977. [Thèse de 3ème cycle]. Contribution à l’étude des garnitures chromosomiques chez quelques Crustacés Isopodes. Poitiers (France: ): Université de Poitiers.
Publication types
MeSH terms
LinkOut - more resources
Full Text Sources
Other Literature Sources
Miscellaneous
