. 2021 Jun 8;54(6):1304-1319.e9.
doi: 10.1016/j.immuni.2021.05.006. Epub 2021 May 9.

SARS-CoV-2 exacerbates proinflammatory responses in myeloid cells through C-type lectin receptors and Tweety family member 2

Affiliations

SARS-CoV-2 exacerbates proinflammatory responses in myeloid cells through C-type lectin receptors and Tweety family member 2

Qiao Lu et al. Immunity. .

Abstract

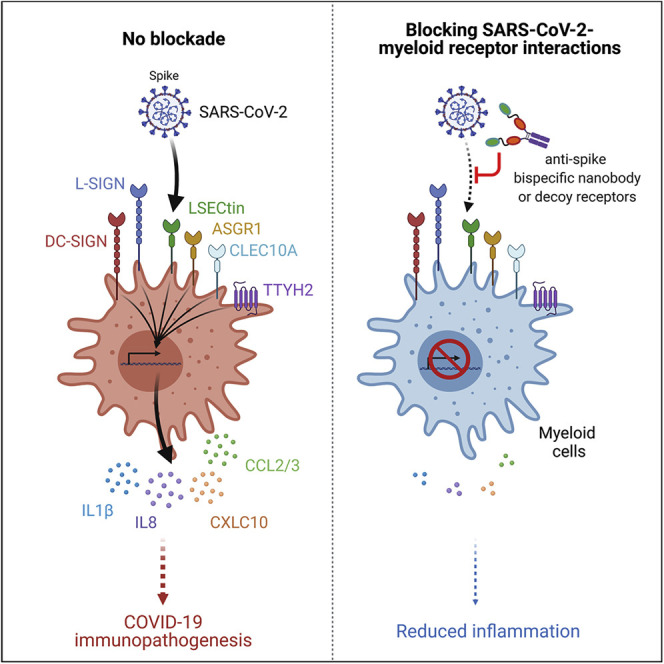
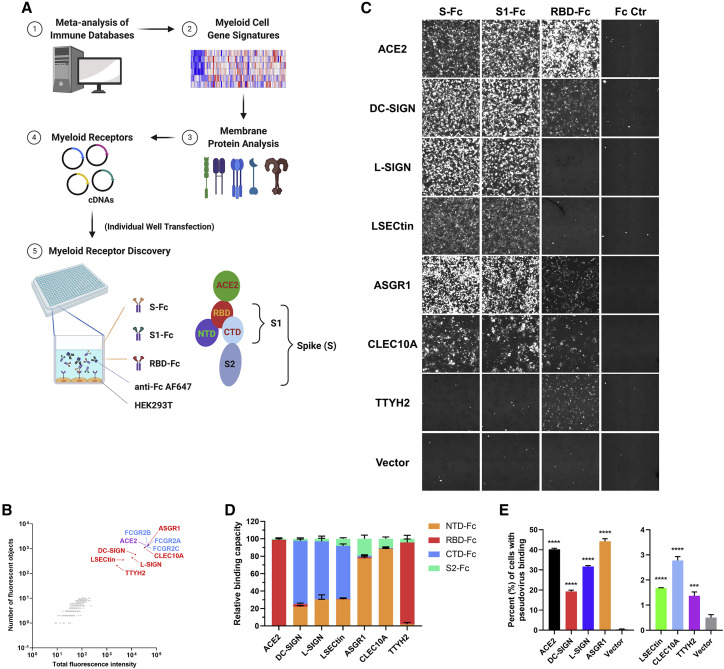
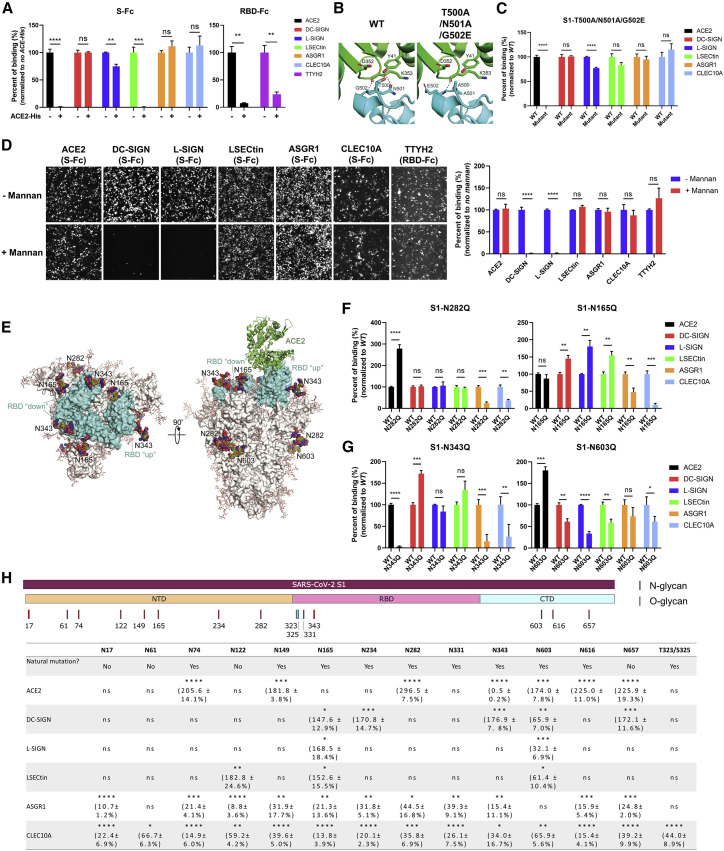
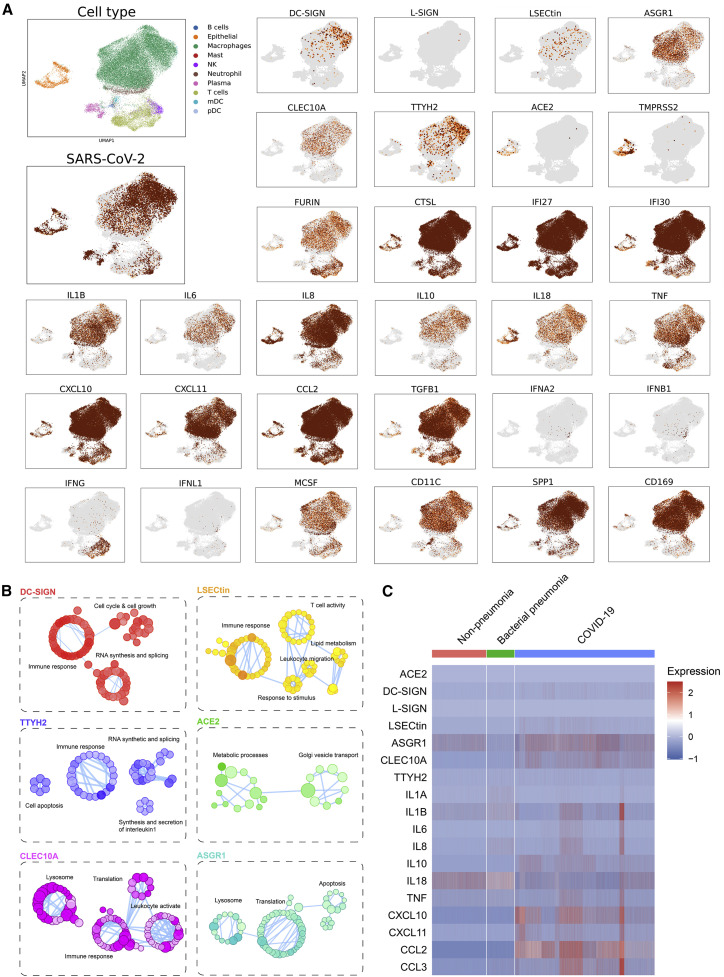
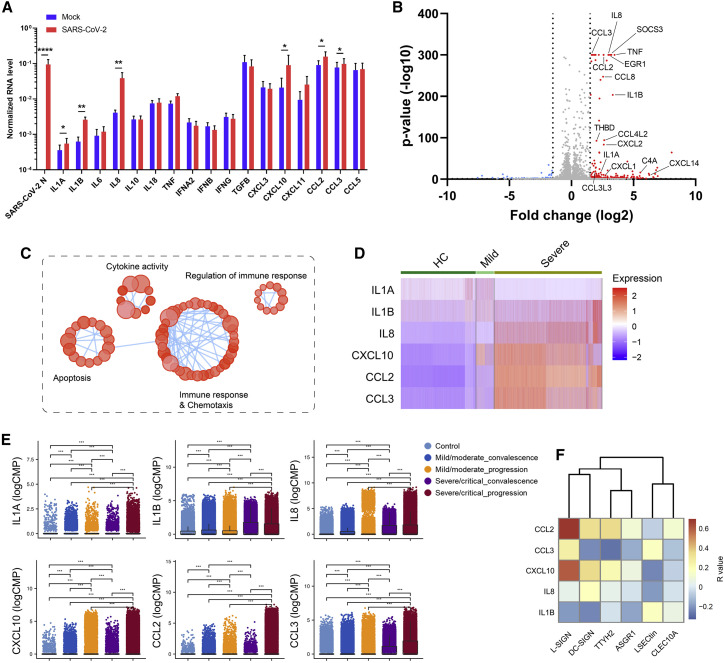
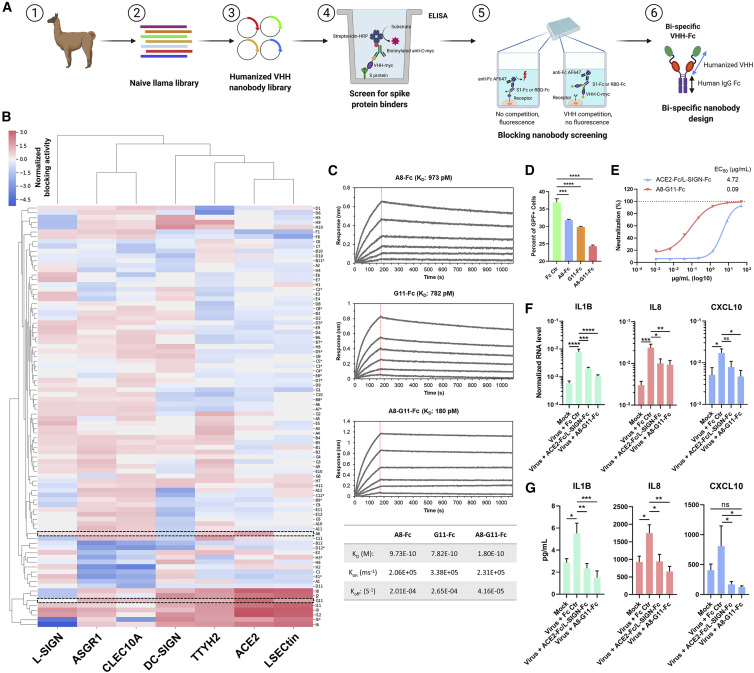
Despite mounting evidence of severe acute respiratory syndrome coronavirus 2 (SARS-CoV-2) engagement with immune cells, most express little, if any, of the canonical receptor of SARS-CoV-2, angiotensin-converting enzyme 2 (ACE2). Here, using a myeloid cell receptor-focused ectopic expression screen, we identified several C-type lectins (DC-SIGN, L-SIGN, LSECtin, ASGR1, and CLEC10A) and Tweety family member 2 (TTYH2) as glycan-dependent binding partners of the SARS-CoV-2 spike. Except for TTYH2, these molecules primarily interacted with spike via regions outside of the receptor-binding domain. Single-cell RNA sequencing analysis of pulmonary cells from individuals with coronavirus disease 2019 (COVID-19) indicated predominant expression of these molecules on myeloid cells. Although these receptors do not support active replication of SARS-CoV-2, their engagement with the virus induced robust proinflammatory responses in myeloid cells that correlated with COVID-19 severity. We also generated a bispecific anti-spike nanobody that not only blocked ACE2-mediated infection but also the myeloid receptor-mediated proinflammatory responses. Our findings suggest that SARS-CoV-2-myeloid receptor interactions promote immune hyperactivation, which represents potential targets for COVID-19 therapy.

Keywords: ASGR1; CLEC10A; COVID-19; DC-SIGN; L-SIGN; LSECtin; SARS-CoV-2; TTYH2; myeloid cells; proinflammatory responses.


Conflict of interest statement

Declaration of interests J.W., Q.L., J.L., B.H., J.D., and Y.L. are named inventors on a patent application that describes the anti-SARS-CoV-2 blocking nanobodies. J.W. is a consultant for Lilly Asia Ventures and is on the Scientific Advisory Board of Rootpath Genomics, which is not relevant to this work. M.S.D. is a consultant for Inbios, Vir Biotechnology, and NGM Biopharmaceuticals and is on the Scientific Advisory Board of Moderna and Immunome. The Diamond laboratory has received unrelated funding support in sponsored research agreements from Moderna, Vir Biotechnology, and Emergent BioSolutions.

Figures

None
Graphical abstract
Figure 1
Figure 1
Discovery of C-type lectins and TTYH2 as interacting partners of the SARS-CoV-2 S protein (A) Schematic of the myeloid cell receptor discovery approach. Individual plasmids of genes encoding myeloid cell receptors were transfected into HEK293T cells, and a human Fc-tagged SARS-CoV-2 S protein mixture (S-Fc, S1-Fc, and RBD-Fc) and anti-human immunoglobulin G (IgG) Fc detection antibody were added to the cell culture to assess binding (see STAR Methods for more details). S protein subunits and subdomains relative to ACE2 binding (RBD) are also shown. (B) Other than ACE2 (purple), DC-SIGN, L-SIGN, LSECtin, ASGR1, CLEC10A, and TTYH2 (all in red) were identified as binding partners for the SARS-CoV-2 S protein (n = 2). Fc receptors (blue) served as positive controls. (C) Representative images of the binding of the Fc-tagged S protein, its subunits, or Fc control (Fc Ctr) to the indicated receptors, captured by the cellular detection system (CDS) (n = 3). (D) Quantification of the interaction between S protein subdomains/subunits and different receptors, indicated on the x axis. Normalized binding capacity is shown on the y axis (the sum of the total fluorescence intensity to the indicated receptor was set to 100). (E) Binding between HEK293T cells expressing the indicated receptors and HIV-GFP virus pseudotyped with the SARS-CoV-2 S protein was detected by an anti-S polyclonal antibody and analyzed by flow cytometry (n = 4). Data are presented as the mean ± SEM of five pooled independent experiments (D) or a representative experiment (E); ∗∗∗p < 0.001, ∗∗∗∗p < 0.0001 by one-way ANOVA (E). n refers to the number of independent experiments. See also Figure S1.
Figure 2
Figure 2
Glycan-dependent SARS-CoV-2 S interaction with C-type lectins via residues distinct from ACE2 (A) Quantification of S-Fc or RBD-Fc binding to HEK293T cells expressing the indicated receptors in the presence or absence of a 100× excess (in the mass ratio) of His-tagged ACE2 ectodomain recombinant protein (ACE2-His) (n = 3). (B) The hydrogen bond formation between the Lys352-Asp353, Tyr41 of human ACE2 (green) and the Thr500-Asn501-Gly502 loop segment of the wild-type (WT) SARS-CoV-2 receptor binding motif (RBM) (PDB: 6M0J; left, cyan) or the Ala500-Ala501-Glu502 SARS-CoV-2 RBM mutant (right, cyan). (C) Quantitative comparison of binding to the indicated receptors of Fc-tagged WT S1 and the T500A/N501A/G502A mutant S1 recombinant protein (n = 3). (D) Representative images (left) and quantification (right) of binding of S-Fc or RBD-Fc (for TTYH2) to the indicated receptors in the presence or absence of 20 μg/mL mannan (n = 3). (E) Glycosylated SARS-CoV-2 S protein model highlighting Asn(N)165, N282, N343, and N603 glycans. The SARS-CoV-2 RBD is colored cyan, and the ACE2 N-terminal peptidase domain is shown in green. (F) Quantification of representative S1 Asn mutants that enhanced interaction with ACE2 (N282Q, left) or some of the C-type lectins (N165Q, right) (n = 3). (G) Quantification of representative S1 Asn mutants that reduced interaction with ACE2 (N343Q, left) or C-type lectins (N603Q, right) (n = 3). (H) Schematic of the distribution of N- or O-glycosylation sites in the S1 subunit (top panel) and existence of natural mutations related to some of these sites among ∼5,000 SARS-CoV-2 viral genomes as well as quantitative analysis of the effect of individual mutations of these sites on S protein binding to the indicated receptors (bottom panel). All fluorescence images were captured by CDS and analyzed by CellProfiler software. Data are presented as the mean ± SEM of a representative experiment (A, C, D, F, and G) or three pooled independent experiments (H). ns, not significant. p < 0.05, ∗∗p < 0.01, ∗∗∗p < 0.001, ∗∗∗∗p < 0.0001 by two-tailed unpaired Student’s t test (A, C, D, F, and G) or one-way ANOVA (H). n refers to the number of independent experiments. See also Figure S2.
Figure 3
Figure 3
Myeloid cell-associated expression of C-type lectins and TTYH2 in individuals with COVID-19 (A) Uniform manifold approximation and projection (UMAP) visualizations of single cells isolated from BAL fluid from six individuals with severe COVID-19, with color-coded clusters. Levels of SARS-CoV-2 viral RNA and the indicated host transcripts were plotted individually. (B) Gene Ontology (GO) pathway enrichment connectivity diagram displaying pathways enriched in infected cells expressing the indicated receptors. The color shades of dots in each diagram denote the p value of the hypergeometric test (the darker, the smaller the p value), the size of the dots represents the number of genes associated in the indicated pathway (the larger, the more associated genes), and functionally related dots are connected by lines. (C) Heatmaps of gene expression of myeloid receptors and pro-inflammatory cytokine/chemokines in BAL myeloid cells isolated from individuals without pneumonia and those with bacterial pneumonia and COVID-19. See also Figure S3.
Figure 4
Figure 4
Myeloid cell receptors mediate ACE2-independent SARS-CoV-2 virus-immune interactions (A) HEK293T cells transfected with the indicated receptors or vector control were co-cultured with HIV-GFP virus pseudotyped with SARS-CoV-2 WT or mutant (T500A/N501A/G502E) S protein (SARS-CoV-2 pseudovirus) in the presence or absence of mannan (100 μg/mL) for 48 h, followed by flow cytometry analysis of GFP expression (n = 3). (B) Human PBMC-derived myeloid cells were co-cultured with SARS-CoV-2 pseudovirus with WT S protein in the presence or absence of mannan (100 μg/mL) for 48 h, followed by flow cytometry analysis (n = 3). (C) HEK293T cells with or without ACE2 overexpression (left) and human PBMC-derived myeloid cells (right) were co-cultured with SARS-CoV-2 pseudovirus in the presence of Fc Ctr or anti-ACE2 antibody (20 μg/mL). GFP-positive cells were quantified by flow cytometry after 48-h incubation (n = 3). (D and E) Human PBMC-derived myeloid cells were co-cultured with SARS-CoV-2 pseudovirus with WT S protein (D) or a clinical isolate of SARS-CoV-2 (MOI = 1) (E), with or without Fc-tagged S-interacting decoy receptor(s) (25 μg/mL of each). Cells were analyzed by flow cytometry after 48-h incubation (D) or lysed for RNA extraction and RT-PCR analysis after 24-h incubation (E). The viral mRNA level was normalized to the host GAPDH level, and the average value of the Fc Ctr group was set to 100 (E) (n = 3). Representative flow cytometry plots (left) and statistical analysis (right) are shown in (A), (B), and (D). Data are presented as mean ± SEM of a representative experiment. p < 0.05, ∗∗∗p < 0.001, ∗∗∗∗p < 0.0001 by two-way ANOVA (A), two-tailed unpaired Student’s t test (B and right panel in C), or one-way ANOVA (left panel in C, D, and E). n refers to the number of independent experiments. See also Figure S4.
Figure 5
Figure 5
SARS-CoV-2 viral-immune interactions promote hyperinflammatory responses (A) Human PBMC-derived myeloid cells from four healthy donors were incubated with a clinical isolate of SARS-CoV-2 (MOI = 0.5). Mock control was performed using conditioned medium. Cells were lysed, and RNA was harvested at 24 h after incubation. mRNA levels of the SARS-CoV-2 N protein and the indicated cytokines and chemokines were measured by RT-PCR and normalized to that of GAPDH. Data were presented as mean ± SEM of four pooled cohorts. p < 0.05, ∗∗p < 0.01, ∗∗∗∗p < 0.0001 by two-tailed paired Student’s t test. (B and C) Human PBMC-derived myeloid cells of one representative donor were incubated with a clinical isolate of SARS-CoV-2 (MOI = 0.5) or conditioned medium, followed by bulk RNA-seq analysis to dissect upregulated gene expression triggered by the virus. A volcano plot of gene expression (B) and a GO pathway enrichment connectivity diagram (C) are shown. (D) Heatmaps of proinflammatory gene expression in BAL myeloid cell subsets from healthy control (HC) individuals and those with mild or severe COVID-19. (E) Proinflammatory gene expression in BAL myeloid cell subsets was plotted for healthy individuals (control) or individuals with COVID-19 with different disease statuses. Data are presented as boxplots with the indicated mean line (black). ∗∗∗p < 0.001 by Wilcoxon rank-sum test. (F) Correlation between the expression of myeloid receptors and the cytokines/chemokines in the myeloid cell subsets from COVID-19 BAL samples. (E) and (F) were from the same scRNA-seq dataset.
Figure 6
Figure 6
Identification of nanobodies capable of blocking SARS-CoV-2-induced hyperinflammatory responses (A) Schematic of the nanobody screening program to develop bispecific nanobodies that block S protein interaction with ACE2 and myeloid cell receptors (see STAR Methods for details). (B) Clustered heatmap of the relative blocking score for each VHH nanobody. Clones A8 and G11 are highlighted in the rectangular areas, and non-RBD interacting nanobodies were labeled with an asterisk (n = 3). (C) Probelife kinetics analysis of binding of A8-Fc, G11-Fc, and A8-G11-Fc to the S protein. KD, Kon, and Koff values of individual nanobodies are shown in the table. A representative experiment is shown. (D) Human PBMC-derived myeloid cells were incubated with HIV-GFP virus pseudotyped with SARS-CoV-2 S protein in the presence of Fc Ctr, A8-Fc, G11-Fc, or A8-G11-Fc (50 μg/mL) for 48 h, followed by flow cytometry (n = 3). (E) Neutralization of mNeonGreen SARS-CoV-2 reporter virus (MOI = 1) infection of HEK293T cells expressing ACE2 by an S-interacting decoy receptor cocktail (ACE2-Fc/L-SIGN-Fc, 25 μg/mL of each) or a bi-specific nanobody (A8-G11-Fc, 50 μg/mL). (F and G) Human PBMC-derived myeloid cells from two healthy cohorts were incubated with a clinical isolate of SARS-CoV-2 (MOI = 0.5) in the presence of Fc Ctr protein (50 μg/mL), an ACE2-Fc/L-SIGN-Fc cocktail (25 μg/mL of each), or an A8-G11-Fc bi-specific nanobody (50 μg/mL). Mock control was performed using conditioned medium. Cells were lysed for RNA extraction, and the supernatant was harvested 24 h after incubation. mRNA levels of the indicated cytokines and chemokines were measured by RT-PCR and normalized to that of GAPDH (F), and cytokines in the supernatant were quantified by a multiplex magnetic bead assay (G). Data are presented as mean ± SEM of a representative experiment (D and E) or four independent pooled experiments (F and G). p < 0.05, ∗∗p < 0.01, ∗∗∗p < 0.001, ∗∗∗∗p < 0.0001 by one-way ANOVA (D, F, and G). n refers to the number of independent experiments. See also Figure S6.

Similar articles

Cited by

References

    1. Alvarez C.P., Lasala F., Carrillo J., Muñiz O., Corbí A.L., Delgado R. C-type lectins DC-SIGN and L-SIGN mediate cellular entry by Ebola virus in cis and in trans. J. Virol. 2002;76:6841–6844. - PMC - PubMed
    1. Blanco-Melo D., Nilsson-Payant B.E., Liu W.-C., Uhl S., Hoagland D., Møller R., Jordan T.X., Oishi K., Panis M., Sachs D., et al. Imbalanced Host Response to SARS-CoV-2 Drives Development of COVID-19. Cell. 2020;181:1036–1045.e9. - PMC - PubMed
    1. Bost P., Giladi A., Liu Y., Bendjelal Y., Xu G., David E., Blecher-Gonen R., Cohen M., Medaglia C., Li H., et al. Host-Viral Infection Maps Reveal Signatures of Severe COVID-19 Patients. Cell. 2020;181:1475–1488.e12. - PMC - PubMed
    1. Brouwer P.J.M., Caniels T.G., van der Straten K., Snitselaar J.L., Aldon Y., Bangaru S., Torres J.L., Okba N.M.A., Claireaux M., Kerster G., et al. Potent neutralizing antibodies from COVID-19 patients define multiple targets of vulnerability. Science. 2020;369:643–650. - PMC - PubMed
    1. Brudner M., Karpel M., Lear C., Chen L., Yantosca L.M., Scully C., Sarraju A., Sokolovska A., Zariffard M.R., Eisen D.P., et al. Lectin-dependent enhancement of Ebola virus infection via soluble and transmembrane C-type lectin receptors. PLoS ONE. 2013;8:e60838. - PMC - PubMed

Publication types

MeSH terms