

The role of ethanolamine phosphate phospholyase in regulation of astrocyte lipid homeostasis
- PMID: 34048714
- PMCID: PMC8233209
- DOI: 10.1016/j.jbc.2021.100830
The role of ethanolamine phosphate phospholyase in regulation of astrocyte lipid homeostasis
Abstract
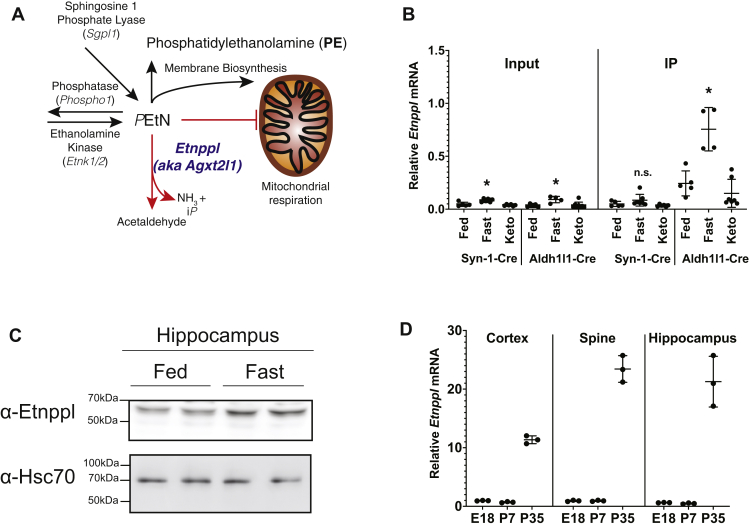
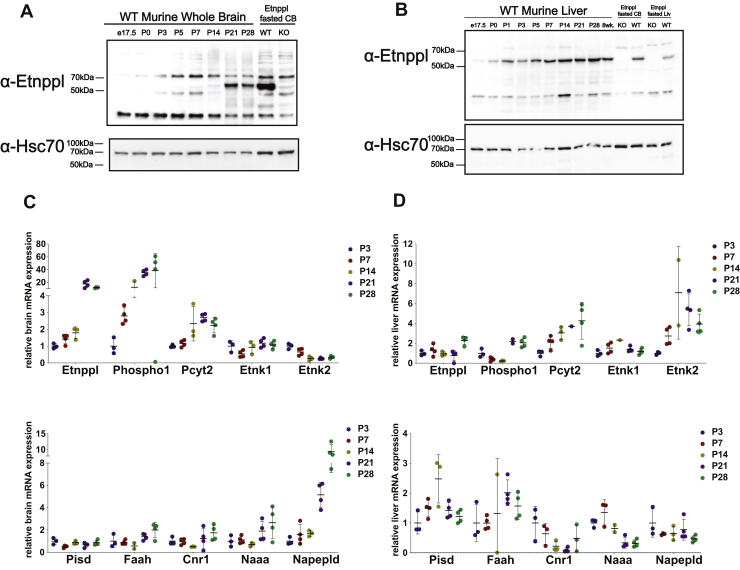
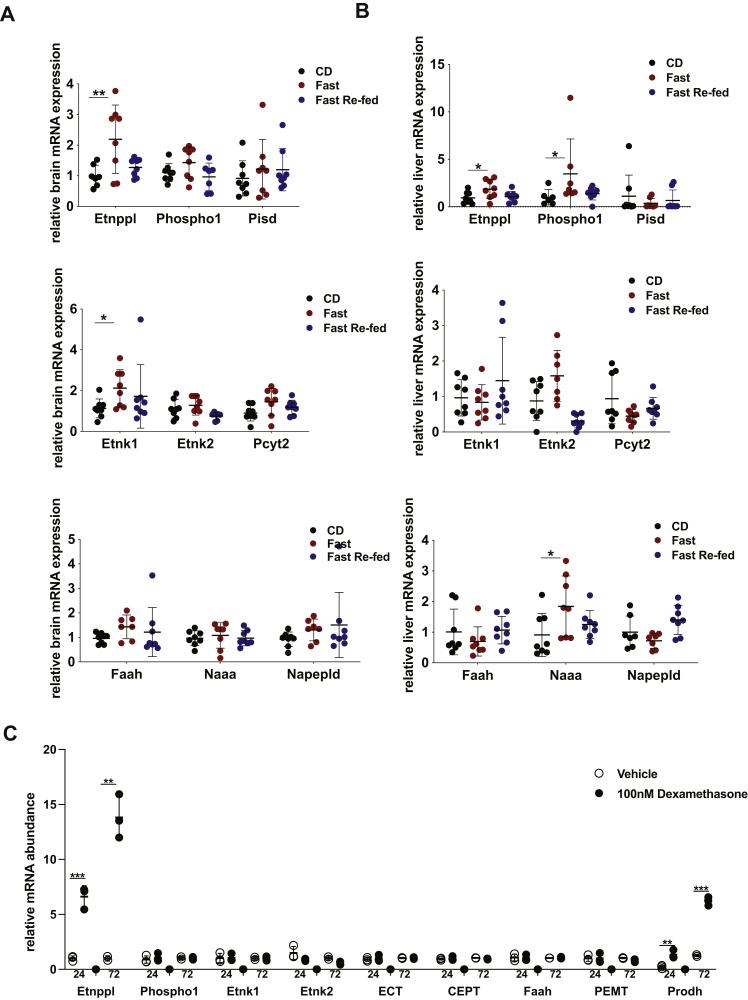
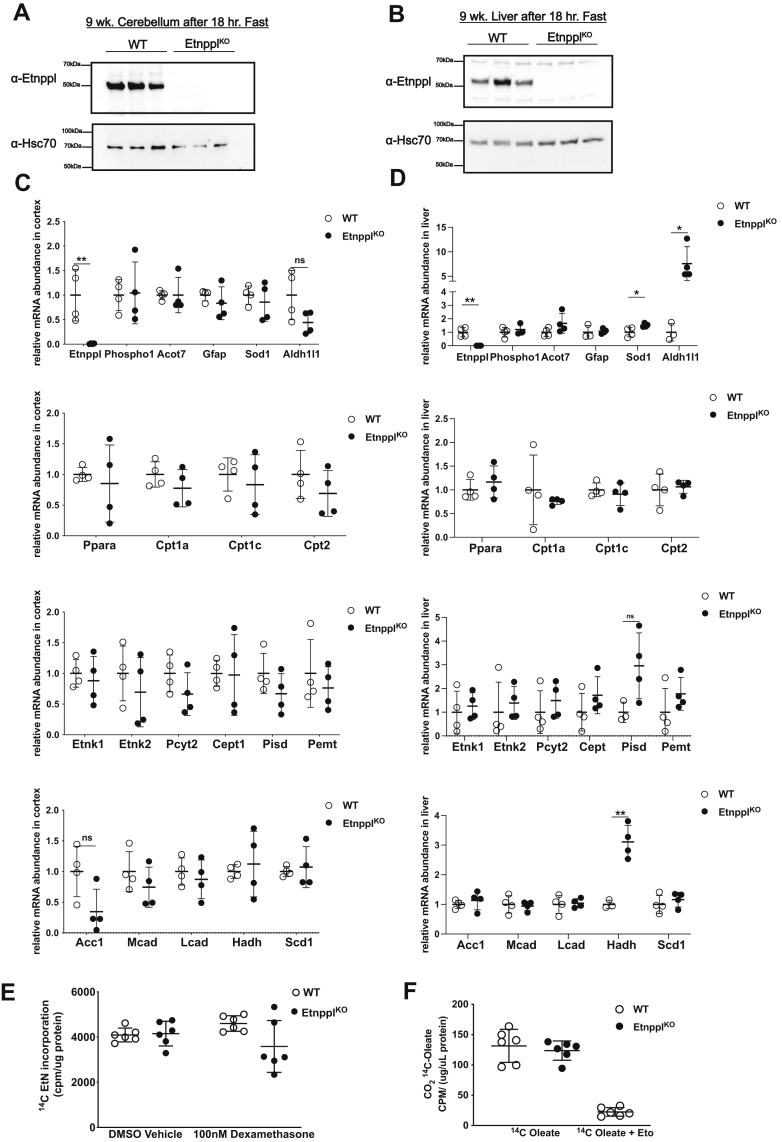
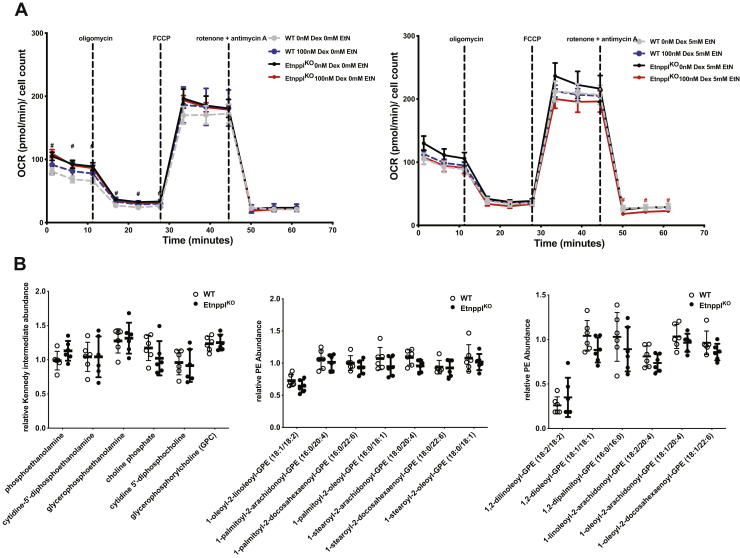
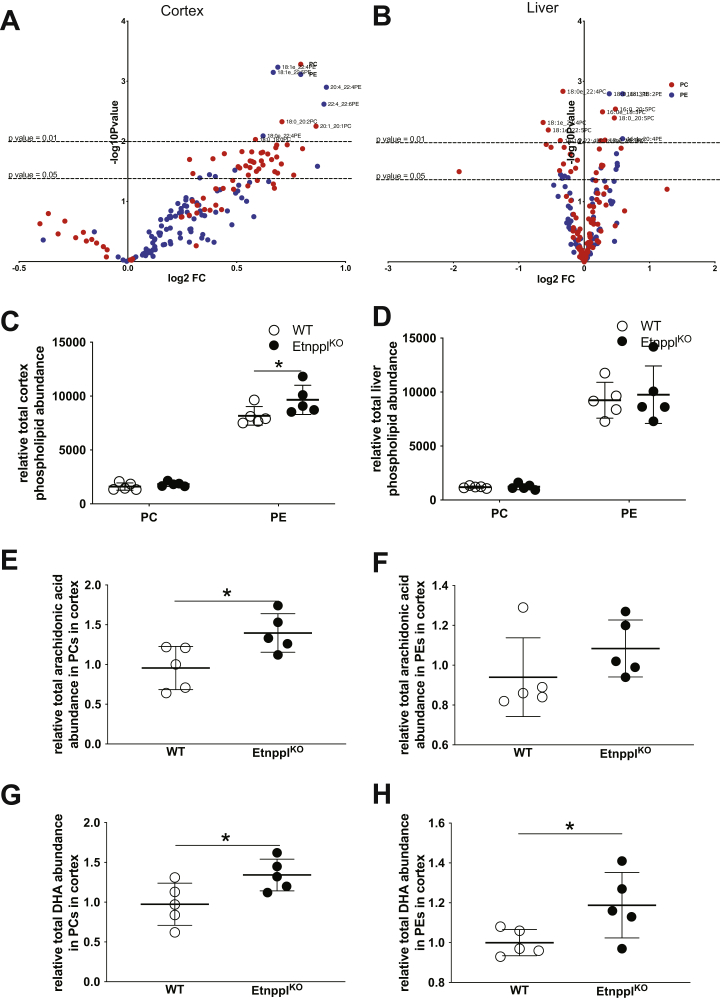
Dietary lipid composition has been shown to impact brain morphology, brain development, and neurologic function. However, how diet uniquely regulates brain lipid homeostasis compared with lipid homeostasis in peripheral tissues remains largely uncharacterized. To evaluate the lipid response to dietary changes in the brain, we assessed actively translating mRNAs in astrocytes and neurons across multiple diets. From this data, ethanolamine phosphate phospholyase (Etnppl) was identified as an astrocyte-specific fasting-induced gene. Etnppl catabolizes phosphoethanolamine (PEtN), a prominent headgroup precursor in phosphatidylethanolamine (PE) also found in other classes of neurologically relevant lipid species. Altered Etnppl expression has also previously been associated with humans with mood disorders. We evaluated the relevance of Etnppl in maintaining brain lipid homeostasis by characterizing Etnppl across development and in coregulation with PEtN-relevant genes, as well as determining the impact to the brain lipidome after Etnppl loss. We found that Etnppl expression dramatically increased during a critical window of early brain development in mice and was also induced by glucocorticoids. Using a constitutive knockout of Etnppl (EtnpplKO), we did not observe robust changes in expression of PEtN-related genes. However, loss of Etnppl altered the phospholipid profile in the brain, resulting in increased total abundance of PE and in polyunsaturated fatty acids within PE and phosphatidylcholine species in the brain. Together, these data suggest that brain phospholipids are regulated by the phospholyase action of the enzyme Etnppl, which is induced by dietary fasting in astrocytes.
Keywords: astrocyte; brain; glucocorticoid; lipid; liver; phosphatidylethanolamine.
Copyright © 2021 The Authors. Published by Elsevier Inc. All rights reserved.
Conflict of interest statement
Conflict of interest The authors have no competing financial interests.
Figures
Similar articles
-
Alterations in phosphatidylethanolamine metabolism impacts hepatocellular lipid storage, energy homeostasis, and proliferation.Biochim Biophys Acta Mol Cell Biol Lipids. 2025 May;1870(4):159608. doi: 10.1016/j.bbalip.2025.159608. Epub 2025 Mar 26. Biochim Biophys Acta Mol Cell Biol Lipids. 2025. PMID: 40154596
-
The emerging role of ethanolamine phosphate phospholyase in regulating hepatic phosphatidylethanolamine and plasma lipoprotein metabolism in mice.FASEB J. 2024 Sep 30;38(18):e70063. doi: 10.1096/fj.202401321R. FASEB J. 2024. PMID: 39312446
-
Utilization of ethanolamine phosphate phospholyase as a unique astrocytic marker.Front Cell Neurosci. 2023 Jan 30;17:1097512. doi: 10.3389/fncel.2023.1097512. eCollection 2023. Front Cell Neurosci. 2023. PMID: 36794261 Free PMC article.
-
Lipid metabolism in astrocytic structure and function.Semin Cell Dev Biol. 2021 Apr;112:123-136. doi: 10.1016/j.semcdb.2020.07.017. Epub 2020 Aug 6. Semin Cell Dev Biol. 2021. PMID: 32773177 Review.
-
Impact of dietary fatty acid balance on membrane structure and function of neuronal tissues.Adv Exp Med Biol. 1992;318:197-210. doi: 10.1007/978-1-4615-3426-6_17. Adv Exp Med Biol. 1992. PMID: 1636490 Review.
Cited by
-
Autism-associated CHD8 controls reactive gliosis and neuroinflammation via remodeling chromatin in astrocytes.Cell Rep. 2024 Aug 27;43(8):114637. doi: 10.1016/j.celrep.2024.114637. Epub 2024 Aug 17. Cell Rep. 2024. PMID: 39154337 Free PMC article.
-
Identifying Antidepressant Effects of Brain-Derived Neurotrophic Factor and IDO1 in the Mouse Model Based on RNA-Seq Data.Front Genet. 2022 May 30;13:890961. doi: 10.3389/fgene.2022.890961. eCollection 2022. Front Genet. 2022. PMID: 35711916 Free PMC article.
-
starTracer is an accelerated approach for precise marker gene identification in single-cell RNA-Seq analysis.Commun Biol. 2024 Sep 13;7(1):1128. doi: 10.1038/s42003-024-06790-6. Commun Biol. 2024. PMID: 39266658 Free PMC article.
-
Multi-omics characterization of type 2 diabetes mellitus-induced gastroenteropathy in the db/db mouse model.Front Cell Dev Biol. 2024 Aug 15;12:1417255. doi: 10.3389/fcell.2024.1417255. eCollection 2024. Front Cell Dev Biol. 2024. PMID: 39211388 Free PMC article.
-
Identification of lipid metabolism-related genes in dapagliflozin treated rats with diabetic cardiomyopathy by bioinformatics.Front Endocrinol (Lausanne). 2025 Mar 20;16:1525831. doi: 10.3389/fendo.2025.1525831. eCollection 2025. Front Endocrinol (Lausanne). 2025. PMID: 40182633 Free PMC article.
References
-
- Davis-Bruno K., Tassinari M.S. Essential fatty acid supplementation of DHA and ARA and effects on neurodevelopment across animal species: A review of the literature. Birth Defects Res. B Dev. Reprod. Toxicol. 2011;92:240–250. - PubMed
-
- Brenna J.T., Carlson S.E. Docosahexaenoic acid and human brain development: Evidence that a dietary supply is needed for optimal development. J. Hum. Evol. 2014;77:99–106. - PubMed
Publication types
MeSH terms
Substances
Grants and funding
LinkOut - more resources
Full Text Sources
Other Literature Sources
Molecular Biology Databases
Research Materials
