. 2021 Aug:209:108620.
doi: 10.1016/j.exer.2021.108620. Epub 2021 May 25.

Modeling the effects of glaucoma surgery on intraocular pressure

Affiliations

Modeling the effects of glaucoma surgery on intraocular pressure

Nicholas Farrar et al. Exp Eye Res. 2021 Aug.

Abstract

Minimally invasive glaucoma surgeries (MIGS) offer an effective way to lower intraocular pressure without inducing extensive trauma to the anterior segment. In order to predict their efficacy, an analytical model of the conventional aqueous humor outflow pathway is developed using a resistor network. The model describes outflow through the normal eye and allows for the effects of geometric changes in the outflow pathway as IOP changes. By selectively removing these resistors, the model can be used to examine and predict the outcomes of several surgical procedures currently used to treat glaucoma. Treatments examined include traditional trabeculectomy, several ab interno methods for trabeculotomy and trabeculectomy, as well as recently developed trabecular stents that bypass the trabecular meshwork and dilate Schlemm canal. The model's predictions for the efficacy of these procedures generally matched well with the efficacy determined in experimental studies, although it tended to somewhat overestimate the efficacy of these procedures. Matching the model to experimental data indicated that a partial trabeculotomy substantially increases flow to collector channels within that region and approximately 1.5 clock hours past the ends of the trabeculotomized region. Similarly, trabecular bypass stents substantially increase flow to collector channels up to 1.5 clock hours past the open ends of the stent. The resistor model we have developed can be used to predict the efficacy of a variety of MIGS procedures. Circumferential flow in Schlemm canal extends the efficacy of MIGS, but this effect is limited to a few clock hours.

Keywords: MIGS; Model; Stents; Trabeculotomy.


Figures

Figure 1:
Figure 1:
Schematic of aqueous humor outflow pathway after 3-hour trabeculotomy showing flow distribution (more flow is indicated by thicker arrows).
Figure 2:
Figure 2:
Example of resistor network with N = 4 CCs and M = 2 SC resistors between each pair of collector channels. Numbers represent Schlemm canal nodes. RTMi and RSCi represent the resistances of the TM and SC resistors at a given node. RCCk represents the resistance of the kth CC resistor. IOP and PV respresent intraocular pressure and episcleral venous pressure, respectively.
Figure 3:
Figure 3:
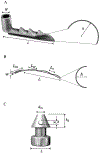
Stents modeled in study annotated with dimensions given Table 2. (A) First-generation iStent (Magazine, 2018) (B) 8 mm Hydrus Microstent (Gulati et al., 2013), (C) iStent inject (Glaukos).
Figure 4:
Figure 4:
Flow resistance of enucleated human eyes (normalized to the mean value at 10 mm Hg) as a function of IOP (Brubaker, 1975). The solid line is the best fit of the baseline model to the data (see text). Error bars are standard errors of the experimental measurements.
Figure 5:
Figure 5:
Model predictions for the normalized height of Schlemm canal, h(x)/h0 as a function of the distance from a collector channel, by the normalized distance between adjacent collector channels, XCC. The two collector channels are located at x/XCC = 0 and x/XCC = 1. The canal height is shown for an enucleated eye at IOP = 5 mmHg (dot-dashed line), 15 mm Hg (solid line) and 30 mm Hg (dashed line). h0 is the undeformed canal height (at IOP = 0 mmHg).
Figure 6:
Figure 6:
Model predictions (red) of resistance reduction for varying degrees of trabeculotomy in enucleated eyes as compared with experimental results (blue) (Rosenquist et al., 1989). Error bars are standard deviations.
Figure 7:
Figure 7:
Comparison of model predictions for IOP reduction with results of clinical studies (Grover et al., 2014; Sarkisian et al., 2019; Vold, 2011) for ab interno trabeculotomy procedures. In all three clinical studies, IOP reducing medication was uncontrolled at both the baseline and 12-month IOP measurements. Baseline pressures for the clinical studies are shown blue and 12-month post-operative results are shown in green; baselines for the model (red) are the same as for the model as for the clinical studies, and model predictions for effect of the procedures are shown in purple. Error bars are standard deviations.
Figure 8:
Figure 8:
Comparison of model predictions for IOP reduction with results of clinical studies (Fea et al., 2017; Fea et al., 2014; Katz et al., 2015) for trabecular bypass stents. In Katz et al. (2015) (iStent), patients underwent medication washout prior to both the baseline and 12-month IOP measurements. In Fea et al. (2017) (Hydrus), IOP reducing medication was uncontrolled at both the baseline and 12-month measurements. In Fea et al. (2014) (iStent inject), patients underwent medication washout prior to the baseline measurement, however, many patients resumed medication prior to the 12-month measurement. Legend is same as Figure 7.
Figure 9:
Figure 9:
Distribution of flow through collector channels with 1-hour trabeculotomy (marked by capped line) in a glaucomatous eye with RTM = 6 mmHg/μL/min and a constant flow of 2 μL/min.
Figure 10:
Figure 10:
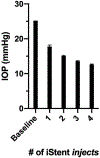
Comparison of predicted IOP using one, two, three, and four iStent injects inserted into Schlemm canal 90° apart, from a baseline pressure of 25 mm Hg. Error bars are standard deviations.
Figure 11:
Figure 11:
Predicted IOP following implantation of two iStent injects separated by 1-6 clock hours compared to the preoperative baseline of 25.2 mm Hg. Error bars are standard deviations.
Figure 12:
Figure 12:
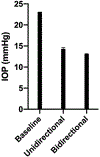
Comparison of predicted IOP between the unidirectional Hydrus stent with a hypothetical bi-directional version of the Hydrus stent from a baseline of 23 mm Hg. Error bars are standard deviations.

Similar articles

Cited by

References

    1. Bahler CK, Hann CR, Fjield T, Haffner D, Heitzmann H, Fautsch MP, 2012. Second-generation Trabecular Meshwork Bypass Stent (iStent inject) Increases Outflow Facility in Cultured Human Anterior Segments. American Journal of Ophthalmology 153, 1206–1213. - PubMed
    1. Bentley MD, Hann CR, Fautsch MP, 2016. Anatomical Variation of Human Collector Channel Orifices. Investigative ophthalmology & visual science 57, 1153–1159. - PMC - PubMed
    1. Brubaker RF, 1975. The effect of intraocular pressure on conventional outflow resistance in the enucleated human eye. undefined. - PubMed
    1. Brubaker RF, 1982. The flow of aqueous humor in the human eye. Trans Am Ophthalmol Soc 80, 391–474. - PMC - PubMed
    1. de Kater AW, Melamed S, Epstein DL, 1989. Patterns of Aqueous Humor Outflow in Glaucomatous and Nonglaucomatous Human Eyes: A Tracer Study Using Cationized Ferritin. Archives of Ophthalmology 107, 572–576. - PubMed

Publication types

MeSH terms