

Dynamics of Covid-19 mortality and social determinants of health: a spatiotemporal analysis of exceedance probabilities
- PMID: 34048904
- PMCID: PMC8451980
- DOI: 10.1016/j.annepidem.2021.05.006
Dynamics of Covid-19 mortality and social determinants of health: a spatiotemporal analysis of exceedance probabilities
Abstract
Purpose: To determine the association of social factors with Covid-19 mortality and identify high-risk clusters.
Methods: Data on Covid-19 deaths across 3,108 contiguous U.S. counties from the Johns Hopkins University and social determinants of health (SDoH) data from the County Health Ranking and the Bureau of Labor Statistics were fitted to Bayesian semi-parametric spatiotemporal Negative Binomial models, and 95% credible intervals (CrI) of incidence rate ratios (IRR) were used to assess the associations. Exceedance probabilities were used for detecting clusters.
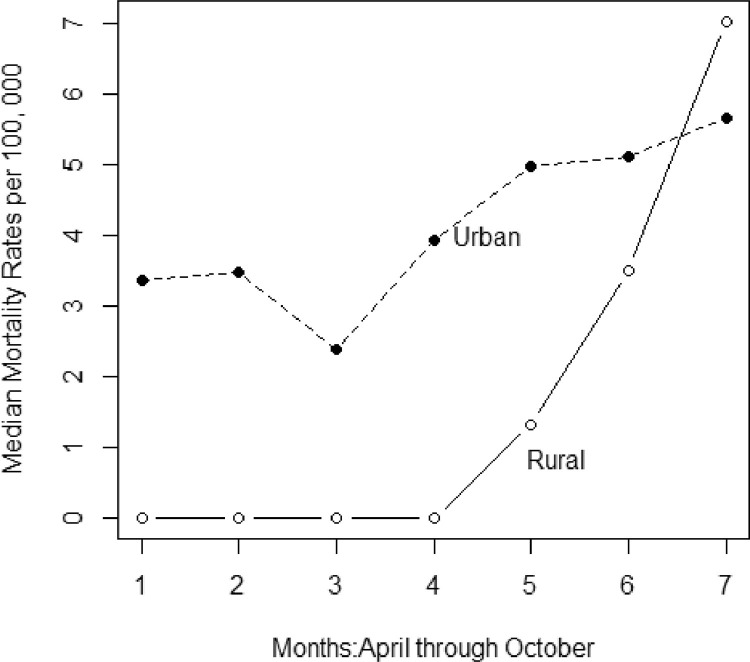
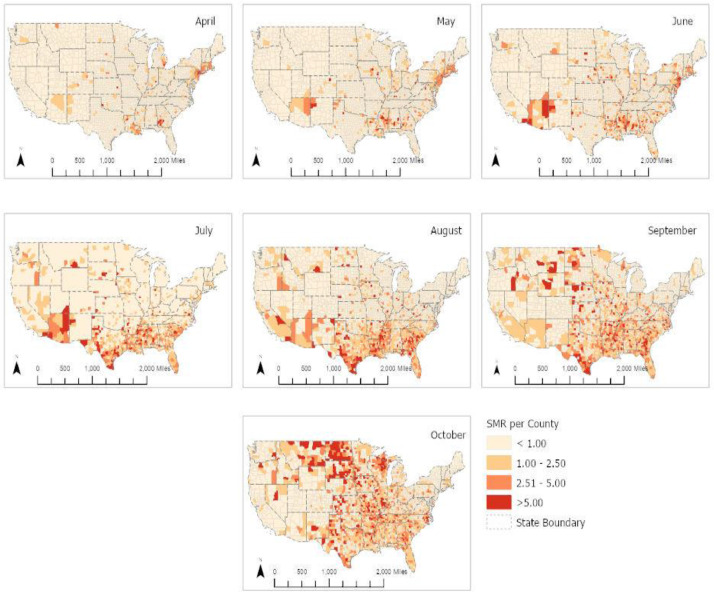
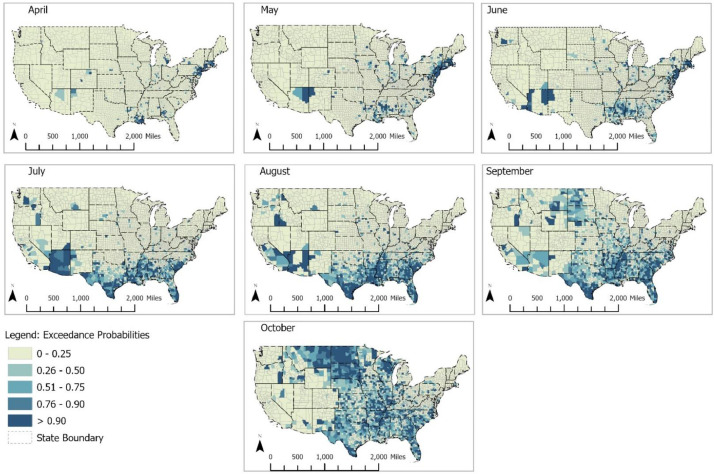
Results: As of October 31, 2020, the median mortality rate was 40.05 per 100, 000. The monthly urban mortality rates increased with unemployment (IRRadjusted:1.41, 95% CrI: 1.24, 1.60), percent Black population (IRRadjusted:1.05, 95% CrI: 1.04, 1.07), and residential segregation (IRRadjusted:1.03, 95% CrI: 1.02, 1.04). The rural monthly mortality rates increased with percent female population (IRRadjusted: 1.17, 95% CrI: 1.11, 1.24) and percent Black population (IRRadjusted:1.07 95% CrI:1.06, 1.08). Higher college education rates were associated with decreased mortality rates in rural and urban counties. The dynamics of exceedance probabilities detected the shifts of high-risk clusters from the Northeast to Southern and Midwestern counties.
Conclusions: Spatiotemporal analyses enabled the inclusion of unobserved latent risk factors and aid in scientifically grounded decision-making at a granular level.
Keywords: Bayesian Analysis; Disparity; Education; Hotspots; Infectious Disease; Residential Segregation.
Copyright © 2021 Elsevier Inc. All rights reserved.
Figures
Similar articles
-
The Association of Social Determinants of Health With COVID-19 Mortality in Rural and Urban Counties.J Rural Health. 2021 Mar;37(2):278-286. doi: 10.1111/jrh.12557. Epub 2021 Feb 22. J Rural Health. 2021. PMID: 33619746 Free PMC article.
-
Progression of COVID-19 From Urban to Rural Areas in the United States: A Spatiotemporal Analysis of Prevalence Rates.J Rural Health. 2020 Sep;36(4):591-601. doi: 10.1111/jrh.12486. Epub 2020 Jun 30. J Rural Health. 2020. PMID: 32602983 Free PMC article.
-
Assessment of Structural Barriers and Racial Group Disparities of COVID-19 Mortality With Spatial Analysis.JAMA Netw Open. 2022 Mar 1;5(3):e220984. doi: 10.1001/jamanetworkopen.2022.0984. JAMA Netw Open. 2022. PMID: 35244703 Free PMC article.
-
Longitudinal disparities in social determinants of health and COVID-19 incidence and mortality in the United States from the three largest waves of the pandemic.Spat Spatiotemporal Epidemiol. 2023 Aug;46:100604. doi: 10.1016/j.sste.2023.100604. Epub 2023 Jul 17. Spat Spatiotemporal Epidemiol. 2023. PMID: 37500229
-
Census Tract Patterns and Contextual Social Determinants of Health Associated With COVID-19 in a Hispanic Population From South Texas: A Spatiotemporal Perspective.JMIR Public Health Surveill. 2021 Aug 5;7(8):e29205. doi: 10.2196/29205. JMIR Public Health Surveill. 2021. PMID: 34081608 Free PMC article.
Cited by
-
Methods Used in the Spatial and Spatiotemporal Analysis of COVID-19 Epidemiology: A Systematic Review.Int J Environ Res Public Health. 2022 Jul 6;19(14):8267. doi: 10.3390/ijerph19148267. Int J Environ Res Public Health. 2022. PMID: 35886114 Free PMC article.
-
Temporal Dynamics of Socioeconomic Inequalities in COVID-19 Outcomes Over the Course of the Pandemic-A Scoping Review.Int J Public Health. 2022 Aug 29;67:1605128. doi: 10.3389/ijph.2022.1605128. eCollection 2022. Int J Public Health. 2022. PMID: 36105178 Free PMC article.
-
Urban and Rural Disparities in COVID-19 Outcomes in the United States: A Systematic Review.Med Care Res Rev. 2025 Apr;82(2):119-136. doi: 10.1177/10775587241298566. Epub 2024 Dec 10. Med Care Res Rev. 2025. PMID: 39655727 Free PMC article.
-
Editorial: Macroeconomic impact of disease dynamics: a temporal-spatial analysis.Front Public Health. 2024 Sep 3;12:1473761. doi: 10.3389/fpubh.2024.1473761. eCollection 2024. Front Public Health. 2024. PMID: 39290414 Free PMC article. No abstract available.
-
Moving the needle on health inequities: principles and tactics for effective cross-sector population health networks.Curr Opin Pediatr. 2022 Feb 1;34(1):27-32. doi: 10.1097/MOP.0000000000001085. Curr Opin Pediatr. 2022. PMID: 34840251 Free PMC article. Review.
References
-
- John Hopkins University Coronavirus Resource Center. Corona Virus Resource Center. Available at: https://coronavirus.jhu.edu/map.html. Published 2020. Accessed November 20, 2020.
-
- United States Census Bureau. Quick Facts Table: united States. United States Census Bureau. Available at: https://www.census.gov/quickfacts/fact/table/US/RHI225219. Published 2019. Accessed November 25, 2020.
-
- Escarce J.J., Kapur K. National Academies Press (US); 2007. Access to and quality of health care. in: tienda M, mitchell F, eds. hispanics and the future of america. - PubMed
MeSH terms
LinkOut - more resources
Full Text Sources
Other Literature Sources
Medical
Research Materials
