

Test positivity - Evaluation of a new metric to assess epidemic dispersal mediated by non-symptomatic cases
- PMID: 34048912
- PMCID: PMC8144156
- DOI: 10.1016/j.ymeth.2021.05.017
Test positivity - Evaluation of a new metric to assess epidemic dispersal mediated by non-symptomatic cases
Abstract
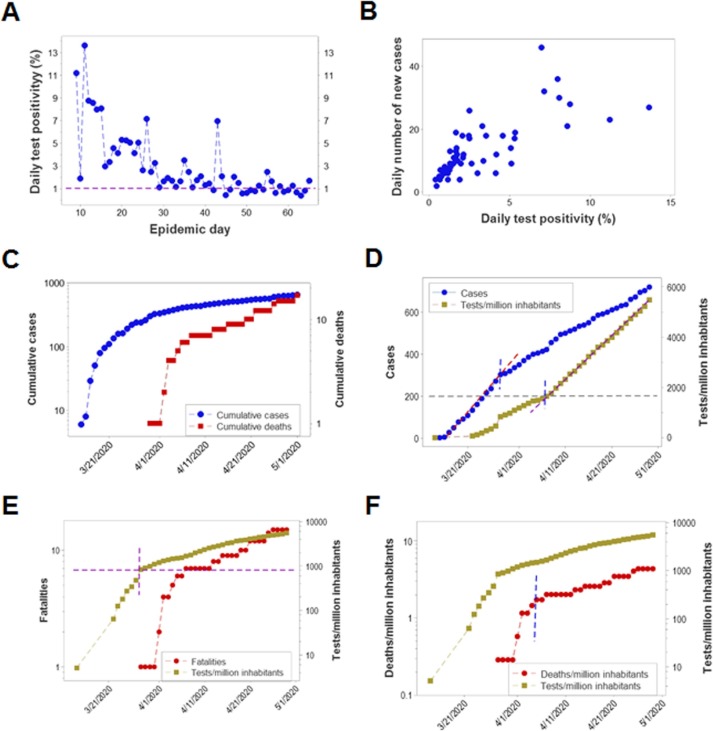
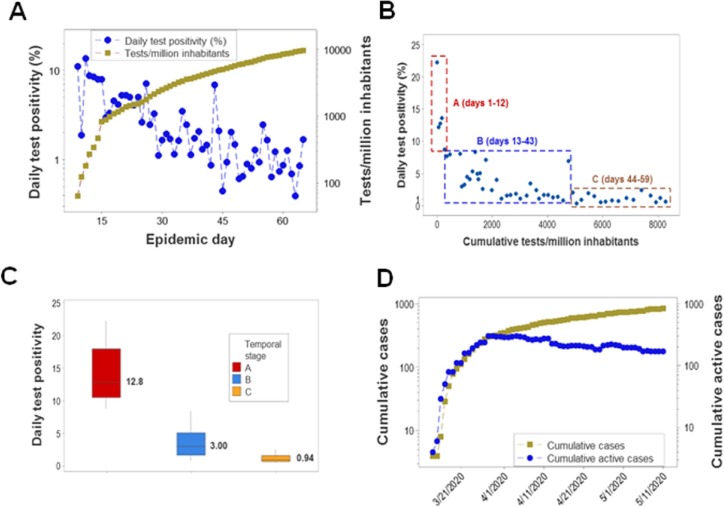
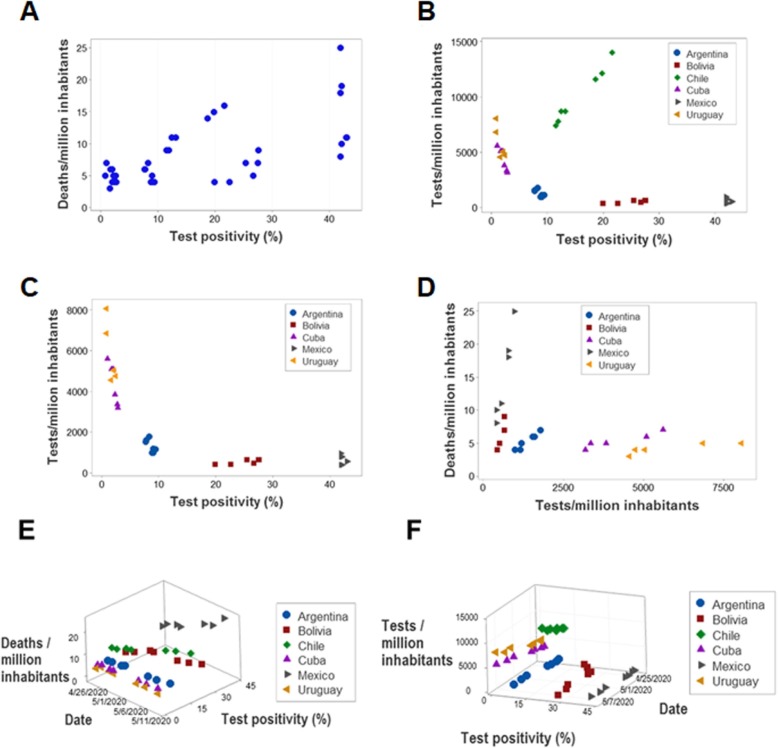
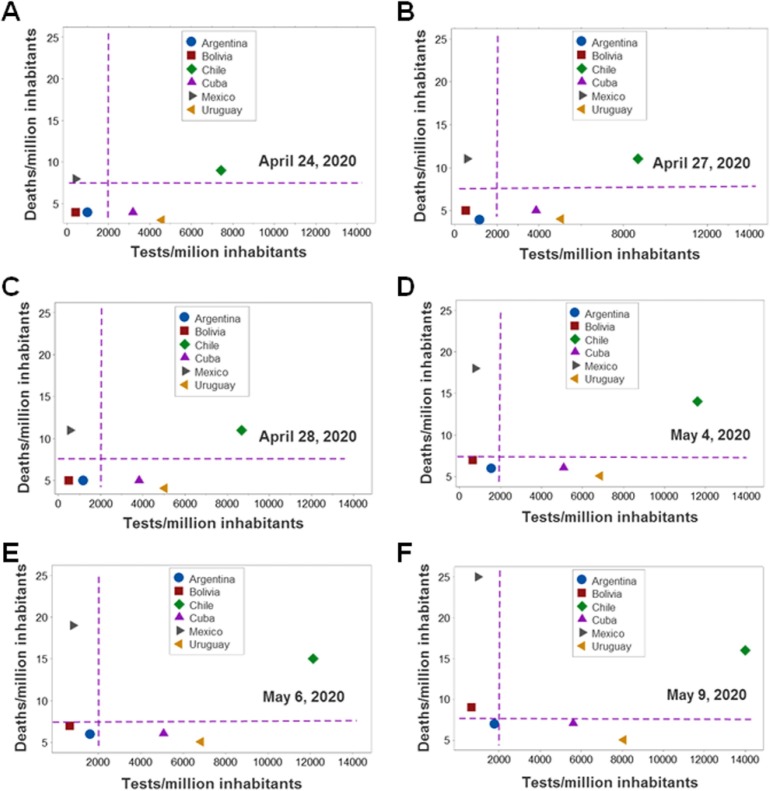
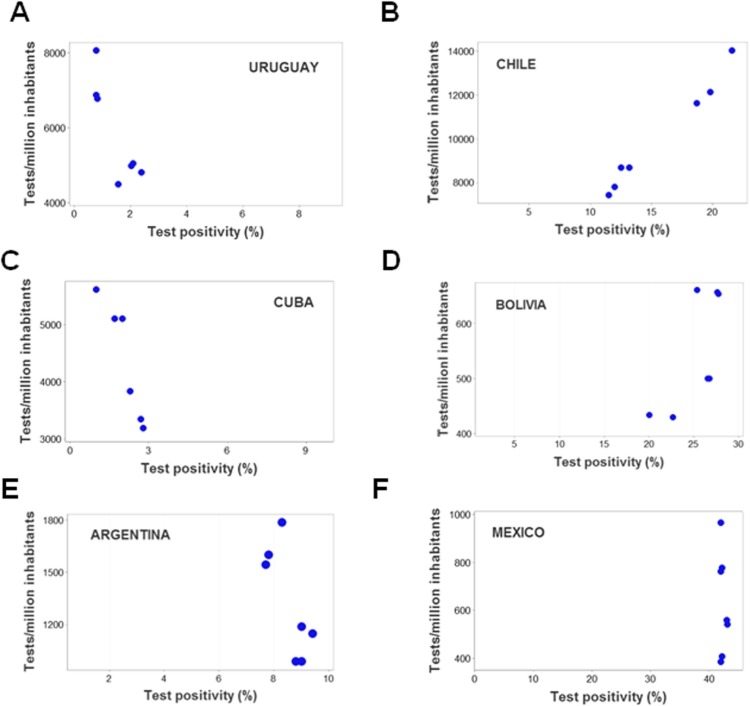
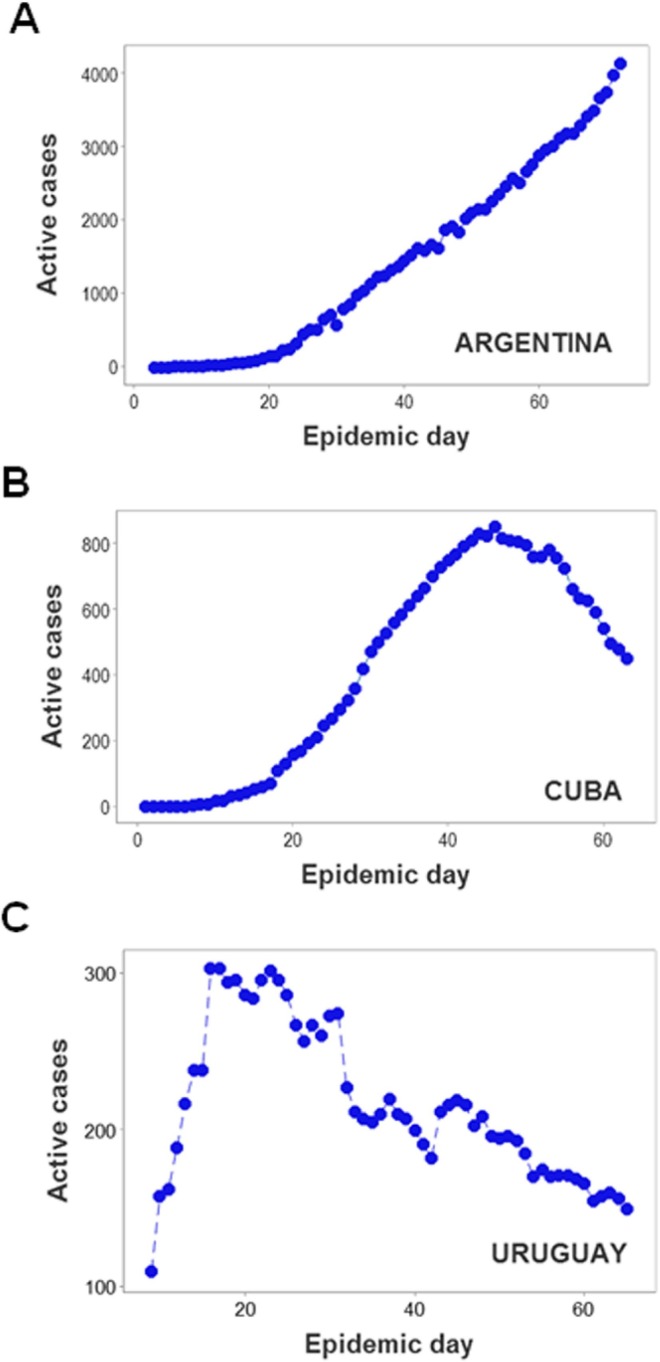
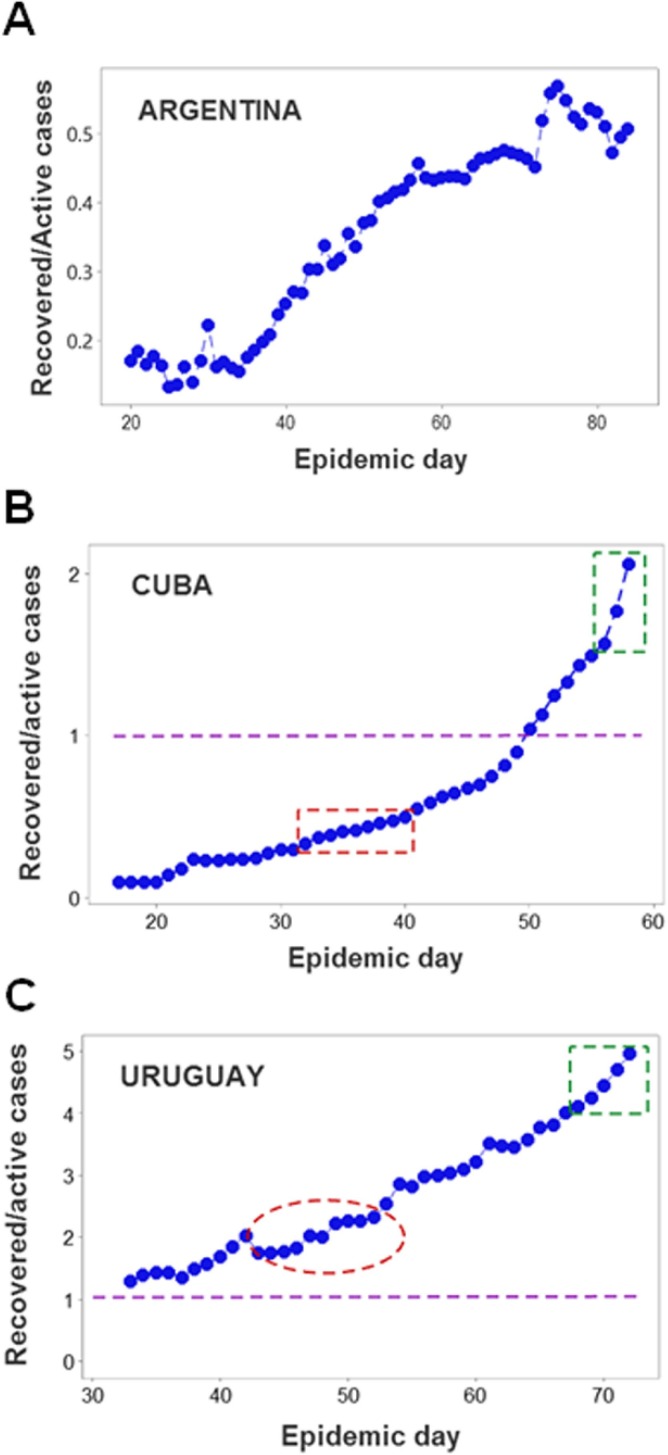
Epidemic control may be hampered when the percentage of asymptomatic cases is high. Seeking remedies for this problem, test positivity was explored between the first 60 to 90 epidemic days in six countries that reported their first COVID-19 case between February and March 2020: Argentina, Bolivia, Chile, Cuba, Mexico, and Uruguay. Test positivity (TP) is the percentage of test-positive individuals reported on a given day out of all individuals tested the same day. To generate both country-specific and multi-country information, this study was implemented in two stages. First, the epidemiologic data of the country infected last (Uruguay) were analyzed. If at least one TP-related analysis yielded a statistically significant relationship, later assessments would investigate the six countries. The Uruguayan data indicated (i) a positive correlation between daily TP and daily new cases (r = 0.75); (ii) a negative correlation between TP and the number of tests conducted per million inhabitants (TPMI, r = -0.66); and (iii) three temporal stages, which differed from one another in both TP and TPMI medians (p < 0.01) and, together, revealed a negative relationship between TPMI and TP. No significant relationship was found between TP and the number of active or recovered patients. The six countries showed a positive correlation between TP and the number of deaths/million inhabitants (DMI, r = 0.65, p < 0.01). With one exception -a country where isolation was not pursued-, all countries showed a negative correlation between TP and TPMI (r = 0.74). The temporal analysis of country-specific policies revealed four patterns, characterized by: (1) low TPMI and high DMI, (2) high TPMI and low DMI; (3) an intermediate pattern, and (4) high TPMI and high DMI. Findings support the hypothesis that test positivity may guide epidemiologic policy-making, provided that policy-related factors are considered and high-resolution geographical data are utilized.
Keywords: COVID-19; Geo-epidemiology; Infection; Resource-limited countries; Test positivity.
Copyright © 2021 Elsevier Inc. All rights reserved.
Conflict of interest statement
The authors declare that they have no known competing financial interests or personal relationships that could have appeared to influence the work reported in this paper.
Figures
Similar articles
-
Statistical methods for comparing test positivity rates between countries: Which method should be used and why?Methods. 2021 Nov;195:72-76. doi: 10.1016/j.ymeth.2021.03.010. Epub 2021 Mar 18. Methods. 2021. PMID: 33744396 Free PMC article.
-
A Year in the COVID-19 Epidemic: Cuba and Uruguay in the Latin American Context.MEDICC Rev. 2021 Jul-Oct;23(3-4):65-73. doi: 10.37757/MR2021.V23.N3.13. Epub 2021 Aug 22. MEDICC Rev. 2021. PMID: 34516540
-
COVID-19: Epidemiological Situation of Argentina and its Neighbor Countries after Three Months of Pandemic.Disaster Med Public Health Prep. 2022 Oct;16(5):1935-1941. doi: 10.1017/dmp.2021.90. Epub 2021 Mar 25. Disaster Med Public Health Prep. 2022. PMID: 33762042 Free PMC article.
-
Obesity: A potential risk factor for infection and mortality in the current COVID-19 epidemic.Diabetes Metab Syndr. 2020 Nov-Dec;14(6):2199-2203. doi: 10.1016/j.dsx.2020.11.001. Epub 2020 Nov 11. Diabetes Metab Syndr. 2020. PMID: 33395781 Free PMC article. Review.
-
Latin American special project: kidney health cooperation project between Uruguay and Bolivia.Clin Nephrol. 2015;83(7 Suppl 1):21-3. doi: 10.5414/cnp83s021. Clin Nephrol. 2015. PMID: 25725237 Review.
Cited by
-
A Low-Cost Early Warning Method for Infectious Diseases with Asymptomatic Carriers.Healthcare (Basel). 2024 Feb 13;12(4):469. doi: 10.3390/healthcare12040469. Healthcare (Basel). 2024. PMID: 38391844 Free PMC article.
-
Heterogeneity in COVID-19 infection among older persons in South Africa: Evidence from national surveillance data.Front Public Health. 2023 Mar 16;11:1009309. doi: 10.3389/fpubh.2023.1009309. eCollection 2023. Front Public Health. 2023. PMID: 37006523 Free PMC article.
-
Modelling the persistence of Covid-19 positivity rate in Italy.Socioecon Plann Sci. 2022 Aug;82:101225. doi: 10.1016/j.seps.2022.101225. Epub 2022 Jan 7. Socioecon Plann Sci. 2022. PMID: 35017746 Free PMC article.
-
Toward interdisciplinary methods appropriate for optimal epidemic control.Methods. 2021 Nov;195:1-2. doi: 10.1016/j.ymeth.2021.09.006. Epub 2021 Sep 17. Methods. 2021. PMID: 34543748 Free PMC article. No abstract available.
References
-
- J. Eppinger, M. Rueping. CoVID-19: Where we are, what we should do and what we should learn. Preprint, https://www.preprints.org/manuscript/202004.0484/v1.
-
- Rivas A.L., Hoogesteijn A.L., Hittner J.B., van Regenmortel M.H.V., Kempaiah P., Vogazianos P., et al. Toward a COVID-19 testing policy: where and how to test when the purpose is to isolate silent spreaders. medRxiv. 2020 doi: 10.1101/2020.12.22.20223651. - DOI
Publication types
MeSH terms
LinkOut - more resources
Full Text Sources
Other Literature Sources
Medical
