Clinical Trial
. 2021 Oct:236:147-159.
doi: 10.1016/j.trsl.2021.05.004. Epub 2021 May 26.

Circulating microRNA profiles predict the severity of COVID-19 in hospitalized patients

Affiliations
Clinical Trial

Circulating microRNA profiles predict the severity of COVID-19 in hospitalized patients

David de Gonzalo-Calvo et al. Transl Res. 2021 Oct.

Abstract

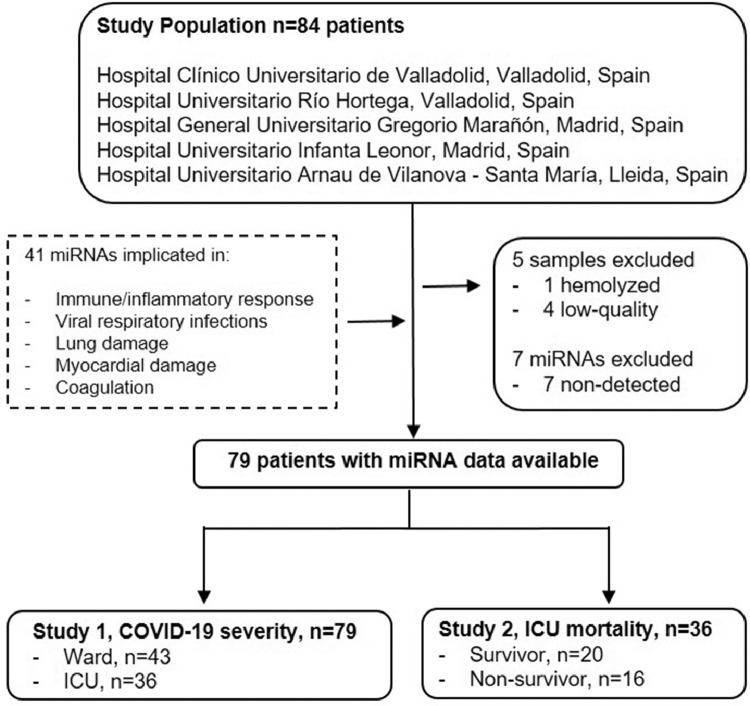
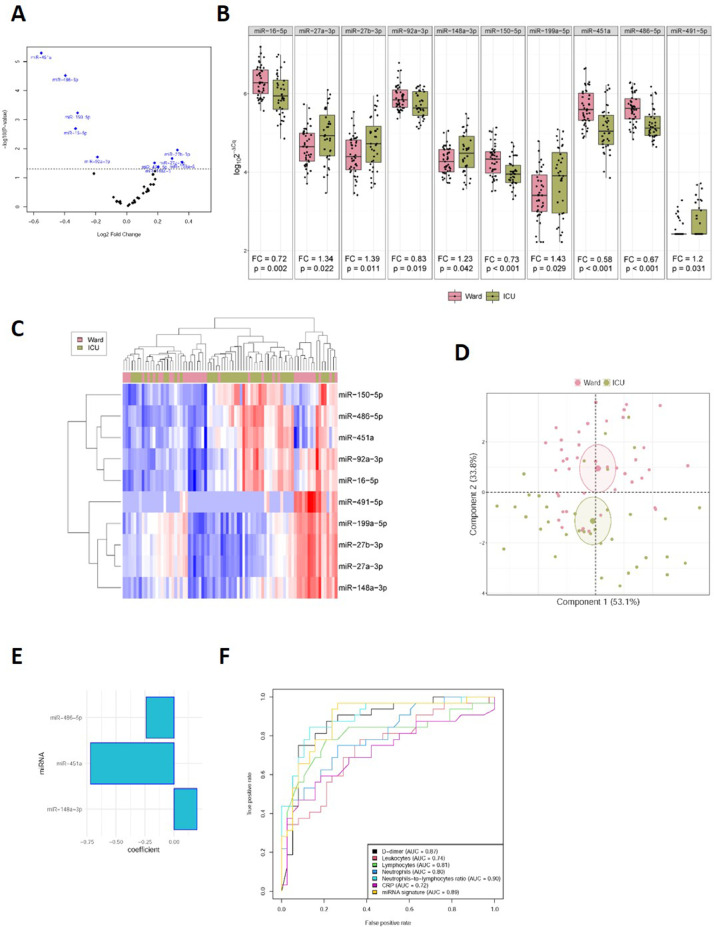
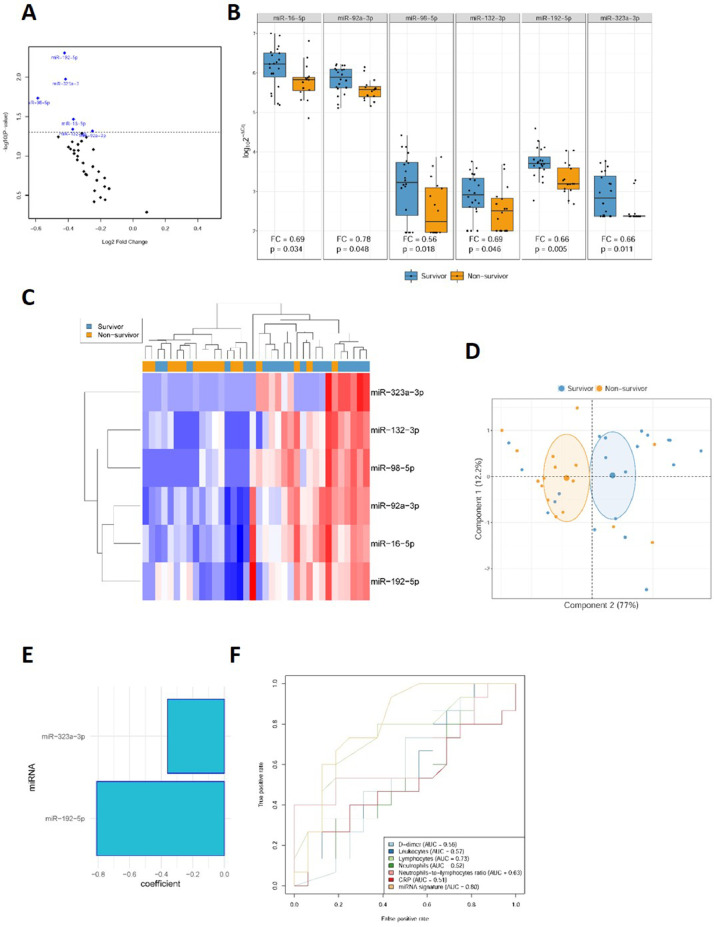
We aimed to examine the circulating microRNA (miRNA) profile of hospitalized COVID-19 patients and evaluate its potential as a source of biomarkers for the management of the disease. This was an observational and multicenter study that included 84 patients with a positive nasopharyngeal swab Polymerase chain reaction (PCR) test for SARS-CoV-2 recruited during the first pandemic wave in Spain (March-June 2020). Patients were stratified according to disease severity: hospitalized patients admitted to the clinical wards without requiring critical care and patients admitted to the intensive care unit (ICU). An additional study was completed including ICU nonsurvivors and survivors. Plasma miRNA profiling was performed using reverse transcription polymerase quantitative chain reaction (RT-qPCR). Predictive models were constructed using least absolute shrinkage and selection operator (LASSO) regression. Ten circulating miRNAs were dysregulated in ICU patients compared to ward patients. LASSO analysis identified a signature of three miRNAs (miR-148a-3p, miR-451a and miR-486-5p) that distinguishes between ICU and ward patients [AUC (95% CI) = 0.89 (0.81-0.97)]. Among critically ill patients, six miRNAs were downregulated between nonsurvivors and survivors. A signature based on two miRNAs (miR-192-5p and miR-323a-3p) differentiated ICU nonsurvivors from survivors [AUC (95% CI) = 0.80 (0.64-0.96)]. The discriminatory potential of the signature was higher than that observed for laboratory parameters such as leukocyte counts, C-reactive protein (CRP) or D-dimer [maximum AUC (95% CI) for these variables = 0.73 (0.55-0.92)]. miRNA levels were correlated with the duration of ICU stay. Specific circulating miRNA profiles are associated with the severity of COVID-19. Plasma miRNA signatures emerge as a novel tool to assist in the early prediction of vital status deterioration among ICU patients.


Figures

Fig 1
Fig 1
Study flowchart. The study included 84 hospitalized patients with a positive nasopharyngeal swab PCR test for SARS-CoV-2 recruited during the first pandemic wave in Spain (March-June 2020). The centers included were Hospital Clínico Universitario (Valladolid), Hospital del Río Hortega (Valladolid), Hospital General Universitario Gregorio Marañón (Madrid), Hospital Universitario Infanta Leonor (Madrid) and Hospital Universitario Arnau de Vilanova y Santa María (Lleida). A panel of 41 circulating microRNAs was selected after an extensive review of the literature. The panel included microRNAs previously associated with molecular pathways potentially altered in COVID-19 (immune/inflammatory response, viral infections, lung damage or fibrosis, myocardial damage and coagulation) in in vitro, in vivo and patient-based approaches and investigated as biomarkers of mechanisms linked to COVID-19 pathophysiology. Patients with hemolyzed or low-quality samples were excluded (n=5). Seven microRNAs, miR-9-5p, miR-34b-5p, miR-34c-5p, miR-124-3p, miR-208a-3p, miR-208b-3p and miR-499a-5p, were below the limit of detection (Cq ≥ 35) in more than 80% of samples and therefore were not considered in further analysis. Patients were stratified according to disease severity: hospitalized patients admitted to the clinical wards without requiring critical care (n=43) and patients admitted to the ICU (n=36). An additional study was completed including ICU nonsurvivors (n=16) and survivors (n=20).
Fig 2
Fig 2
Impact of COVID-19 severity on the circulating microRNA profile. A, Volcano plot of fold change and corresponding P-values for each microRNA after comparison of ward patients and ICU patients (unadjusted). Each point represents one microRNA. Blue dots represent the microRNA candidates that showed significant differences; B, Boxplot including plasma levels of microRNA candidates that showed differences between ward patients and ICU patients. Between-group differences were analyzed using linear models for arrays. P-values describe the significance level for each comparison; C, Heat map showing the unsupervised hierarchical clustering. Each column represents a patient (ward or ICU patient). Each row represents a microRNA. The color scale illustrates the relative expression level of microRNAs. The expression intensity of each microRNA in each sample varies from red to blue, which indicates relatively high or low expression, respectively. D, Principal component analysis. Each point represents a patient. E, Predictive model constructed using a variable selection process based on LASSO regression. miRNA levels were standardized prior to fitting the LASSO regression model. Estimated regression coefficients are shown. F, ROC curves for laboratory parameters and the microRNA signature. Expression levels were quantified by RT-qPCR. Relative quantification was performed using cel-miR-39-3p as the external standard. Relative quantification was performed using the 2−ΔCq method (ΔCq = CqmicroRNA-Cqcel-miR-39-3p). Expression levels were log-transformed for statistical purposes. microRNA levels are expressed as arbitrary units. “For interpretation of the references to color in this figure legend, the reader is referred to the Web version of this article.
Fig 3
Fig 3
Circulating microRNAs as biomarkers for ICU mortality in COVID-19 patients. A, Volcano plot of fold change and corresponding P-values for each microRNA after comparison of nonsurvivors and survivors (unadjusted). Each point represents one microRNA. Blue dots represent the microRNA candidates that showed significant differences; D, Box plot including plasma levels of microRNA candidates that showed differences between nonsurvivor and survivor patients. Between-group differences were analyzed using linear models for arrays. P-values describe the significance level for each comparison; C, Heat map showing the unsupervised hierarchical clustering. Each column represents a patient (nonsurvivor or survivor). Each row represents a microRNA. The color scale illustrates the relative expression level of microRNAs. The expression intensity of each microRNA in each sample varies from red to blue, which indicates relatively high or low expression, respectively. D, Principal component analysis. Each point represents a patient. E, Predictive model constructed using a variable selection process based on LASSO regression. miRNA levels were standardized prior to fitting the LASSO regression model. Estimated regression coefficients are shown. F, ROC curves for laboratory parameters and the microRNA signature. Expression levels were quantified by RT-qPCR. Relative quantification was performed using cel-miR-39-3p as the external standard. Relative quantification was performed using the 2−ΔCq method (ΔCq = CqmicroRNA-Cqcel-miR-39-3p). Expression levels were log-transformed for statistical purposes. microRNA levels are expressed as arbitrary units.

Similar articles

Cited by

References

    1. Grasselli G, Greco M, Zanella A, et al. Risk Factors Associated with Mortality among Patients with COVID-19 in Intensive Care Units in Lombardy, Italy. JAMA Intern Med. 2020;180(10):1345–1355. - PMC - PubMed
    1. Grasselli G, Zangrillo A, Zanella A, et al. Baseline characteristics and outcomes of 1591 patients infected with SARS-CoV-2 Admitted to ICUs of the lombardy region, Italy. JAMA - J Am Med Assoc. 2020;323(16):1574–1581. - PMC - PubMed
    1. Gupta RK, Marks M, Samuels THA, et al. Systematic evaluation and external validation of 22 prognostic models among hospitalized adults with COVID-19: an observational cohort study. Eur Respir J. 2020;56(6) - PMC - PubMed
    1. Shen B, Yi X, Sun Y, et al. Proteomic and metabolomic characterization of COVID-19 patient sera. Cell. 2020;182(1):59–72. e15. - PMC - PubMed
    1. Lin B, Liu J, Liu Y, Qin X. Progress in understanding COVID-19: insights from the omics approach. Crit Rev Clin Lab Sci. 2020;58(4):1–18. - PubMed

Publication types