

Comprehensive analysis of the competing endogenous circRNA-lncRNA-miRNA-mRNA network and identification of a novel potential biomarker for hepatocellular carcinoma
- PMID: 34049287
- PMCID: PMC8266324
- DOI: 10.18632/aging.203056
Comprehensive analysis of the competing endogenous circRNA-lncRNA-miRNA-mRNA network and identification of a novel potential biomarker for hepatocellular carcinoma
Abstract
Background: The competing endogenous RNAs (ceRNAs) hypothesis has received increasing attention as a novel explanation for tumorigenesis and cancer progression. However, there is still a lack of comprehensive analysis of the circular RNA (circRNA)-long non-coding RNA (lncRNA)-miRNA-mRNA ceRNA network in hepatocellular carcinoma (HCC).
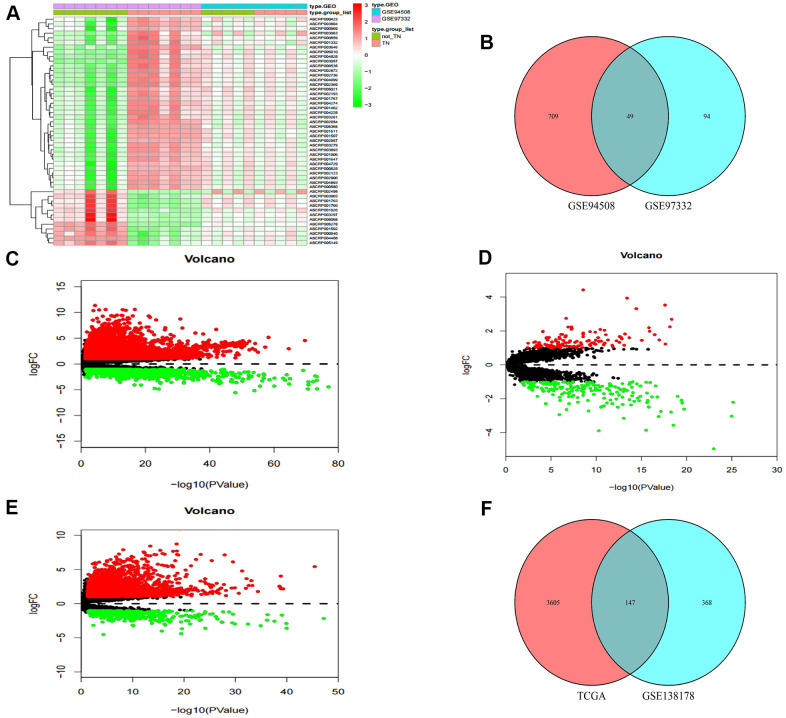
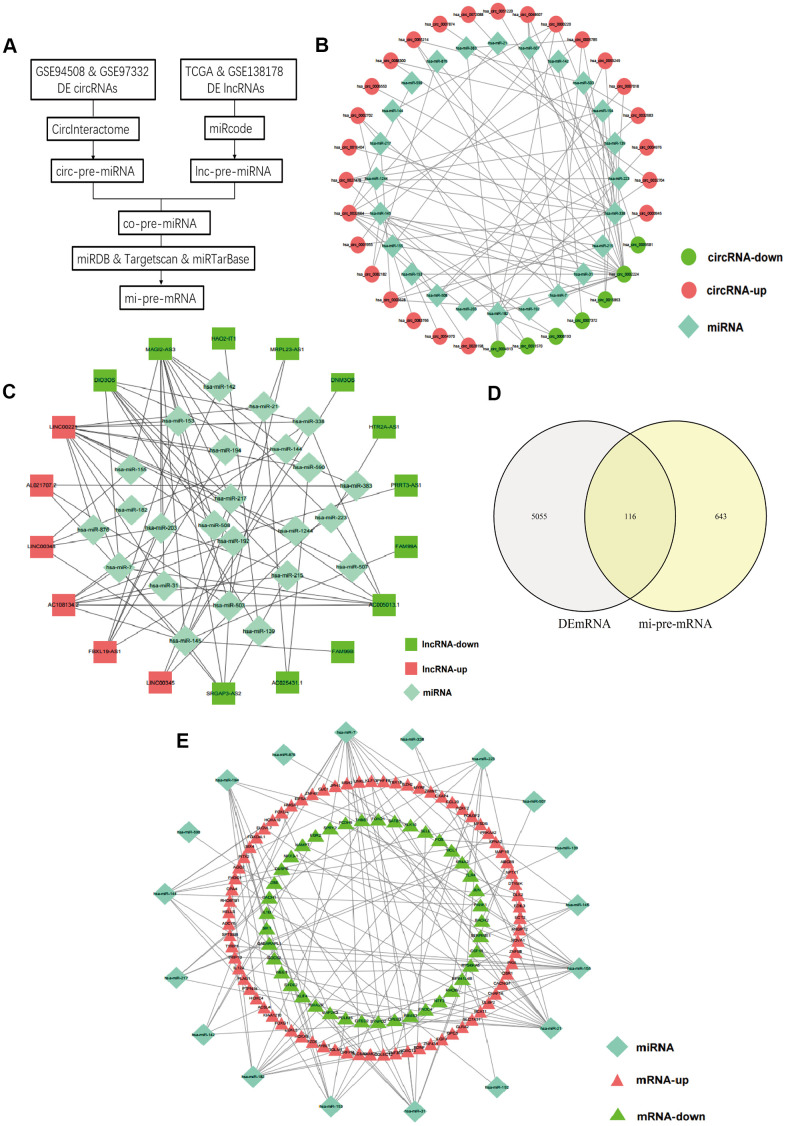
Methods: RNA sequencing data from The Cancer Genome Atlas (TCGA) and Gene Expression Omnibus (GEO) database were employed to identify Differentially Expressed mRNAs (DEmRNAs), DElncRNAs, and DEcircRNAs between HCC and normal tissues. Candidates were identified to construct networks through a comprehensive bioinformatics strategy. A prognostic mRNA signature was established based on data from TCGA database and validated using data from the GEO database. Then, the HCC prognostic circRNA-lncRNA-miRNA-mRNA ceRNA network was established. Finally, the expression and function of an unexplored hub gene, deoxythymidylate kinase (DTYMK), was explored through data mining. The results were examined using clinical samples and in vitro experiments.
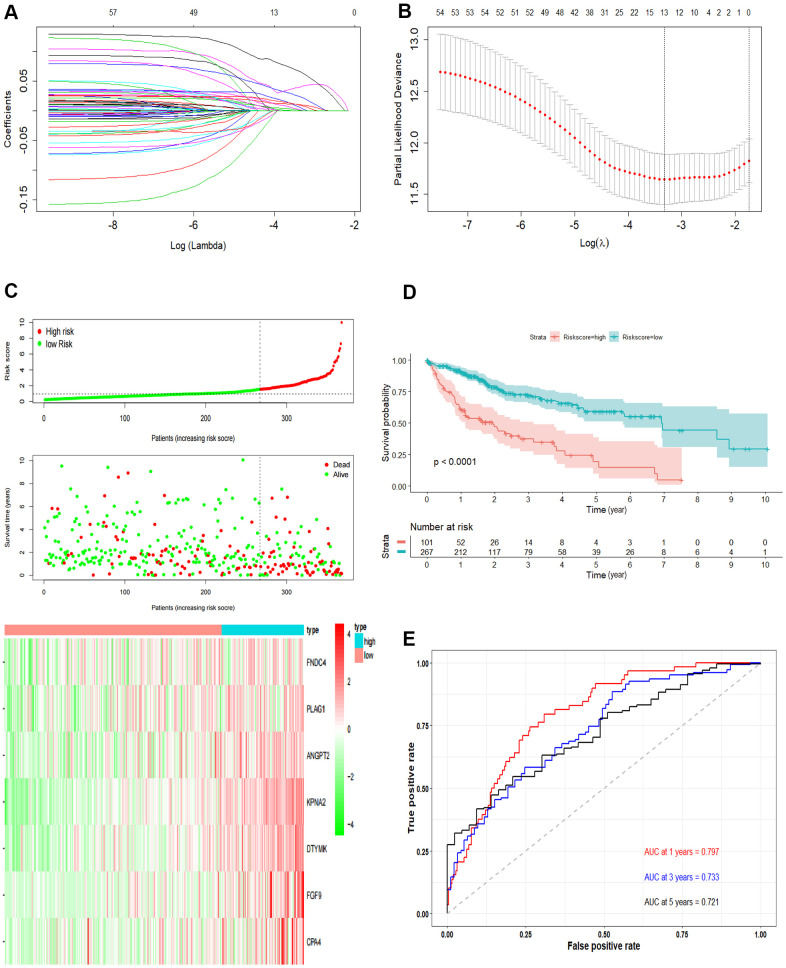
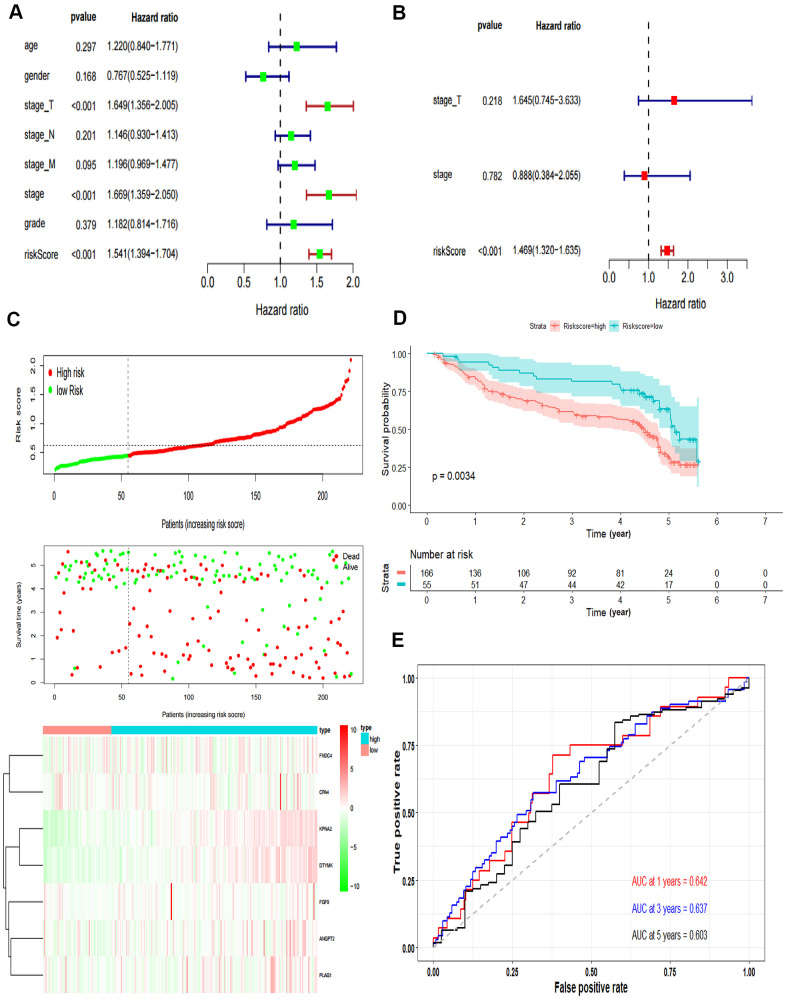
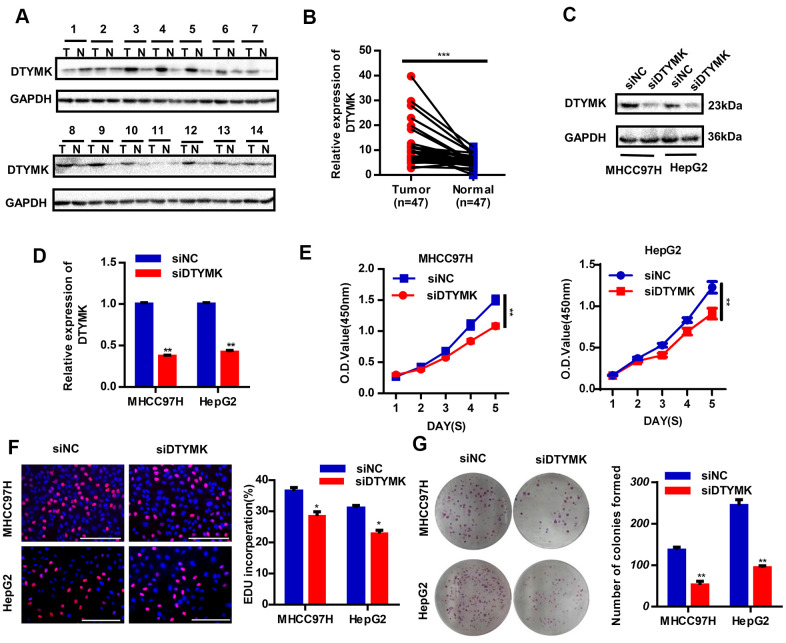
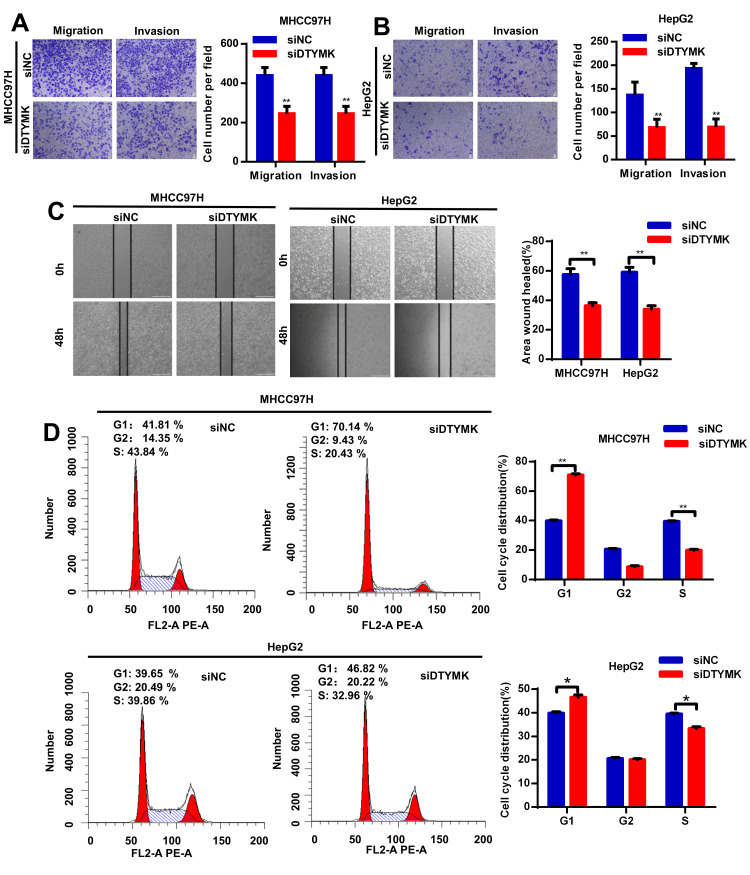
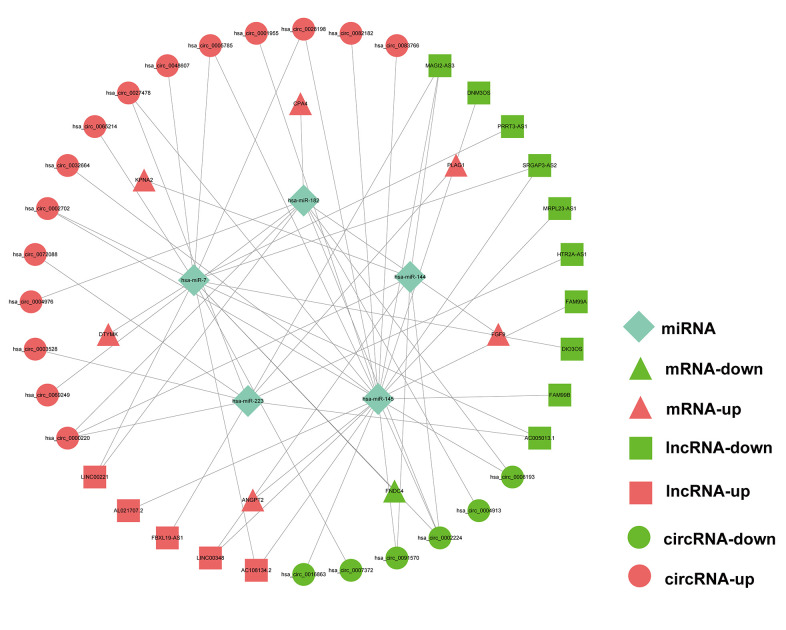
Results: We constructed a prognostic signature with seven target mRNAs by univariate, lasso and multivariate Cox regression analyses, which yielded 1, 3 and 5-year AUC values of 0.797, 0.733 and 0.721, respectively, indicating its sensitivity and specificity in the prognosis of HCC. Moreover, the prognostic signature could be validated in GSE14520. The prognostic ceRNA network of 21 circRNAs, 15 lncRNAs, 5 miRNAs, and 7 mRNAs was established according to the targeting relationship between 7 hub mRNAs and other RNAs. Our experiment results indicated that the depletion of DTYMK inhibited liver cancer cell proliferation and invasion.
Conclusions: The network revealed in this study may help comprehensively elucidate the ceRNA mechanisms driving HCC, and provide novel candidate biomarkers for evaluating the prognosis of HCC.
Keywords: DTYMK; HCC; ceRNA network; prognostic signature.
Conflict of interest statement
Figures
Similar articles
-
Identification of circRNA-lncRNA-miRNA-mRNA Competitive Endogenous RNA Network as Novel Prognostic Markers for Acute Myeloid Leukemia.Genes (Basel). 2020 Jul 31;11(8):868. doi: 10.3390/genes11080868. Genes (Basel). 2020. PMID: 32751923 Free PMC article.
-
Systematic analysis of lncRNA-miRNA-mRNA competing endogenous RNA network identifies four-lncRNA signature as a prognostic biomarker for breast cancer.J Transl Med. 2018 Sep 27;16(1):264. doi: 10.1186/s12967-018-1640-2. J Transl Med. 2018. PMID: 30261893 Free PMC article.
-
Construction of a ceRNA network and a genomic-clinicopathologic nomogram to predict survival for HBV-related HCC.Hum Cell. 2021 Nov;34(6):1830-1842. doi: 10.1007/s13577-021-00607-y. Epub 2021 Sep 6. Hum Cell. 2021. PMID: 34487338
-
Reconstruction and Analysis of the Differentially Expressed IncRNA-miRNA-mRNA Network Based on Competitive Endogenous RNA in Hepatocellular Carcinoma.Crit Rev Eukaryot Gene Expr. 2019;29(6):539-549. doi: 10.1615/CritRevEukaryotGeneExpr.2019028740. Crit Rev Eukaryot Gene Expr. 2019. PMID: 32422009 Review.
-
Role of long noncoding RNA-mediated competing endogenous RNA regulatory network in hepatocellular carcinoma.World J Gastroenterol. 2020 Aug 7;26(29):4240-4260. doi: 10.3748/wjg.v26.i29.4240. World J Gastroenterol. 2020. PMID: 32848331 Free PMC article. Review.
Cited by
-
Identification and Validation of the Hsa_circ_0001726/miR-140-3p/KRAS Axis in Hepatocellular Carcinoma Based on Microarray Analyses and Experiments.J Clin Transl Hepatol. 2024 Nov 28;12(11):897-906. doi: 10.14218/JCTH.2024.00270. Epub 2024 Oct 21. J Clin Transl Hepatol. 2024. PMID: 39544243 Free PMC article.
-
CircRNA hsa_circ_0003528/miR-215 is considered a potential target for predictive prognosis and therapy for triple-negative breast cancer.Mol Biol Rep. 2024 Aug 10;51(1):901. doi: 10.1007/s11033-024-09808-8. Mol Biol Rep. 2024. PMID: 39126511
-
Identification and validation a novel kinase-related gene signature for predicting prognosis and responsiveness to immunotherapy in hepatocellular carcinoma.Clin Exp Med. 2025 May 20;25(1):170. doi: 10.1007/s10238-025-01556-8. Clin Exp Med. 2025. PMID: 40394340 Free PMC article.
-
Deregulated Expression of Circular RNAs Is Associated with Immune Evasion and Leukemia Relapse after Allogeneic Hematopoietic Stem Cell Transplantation.Genes (Basel). 2022 Oct 31;13(11):1986. doi: 10.3390/genes13111986. Genes (Basel). 2022. PMID: 36360223 Free PMC article.
-
Circular RNAs in hepatocellular carcinoma: biogenesis, function, and pathology.Front Genet. 2023 Jul 7;14:1106665. doi: 10.3389/fgene.2023.1106665. eCollection 2023. Front Genet. 2023. PMID: 37485335 Free PMC article. Review.
References
Publication types
MeSH terms
Substances
LinkOut - more resources
Full Text Sources
Other Literature Sources
Medical
