. 2021 Jul 1;66(13):10.1088/1361-6560/ac0683.
doi: 10.1088/1361-6560/ac0683.

Quantitation of multiple injection dynamic PET scans: an investigation of the benefits of pooling data from separate scans when mapping kinetics

Affiliations

Quantitation of multiple injection dynamic PET scans: an investigation of the benefits of pooling data from separate scans when mapping kinetics

Fengyun Gu et al. Phys Med Biol. .

Abstract

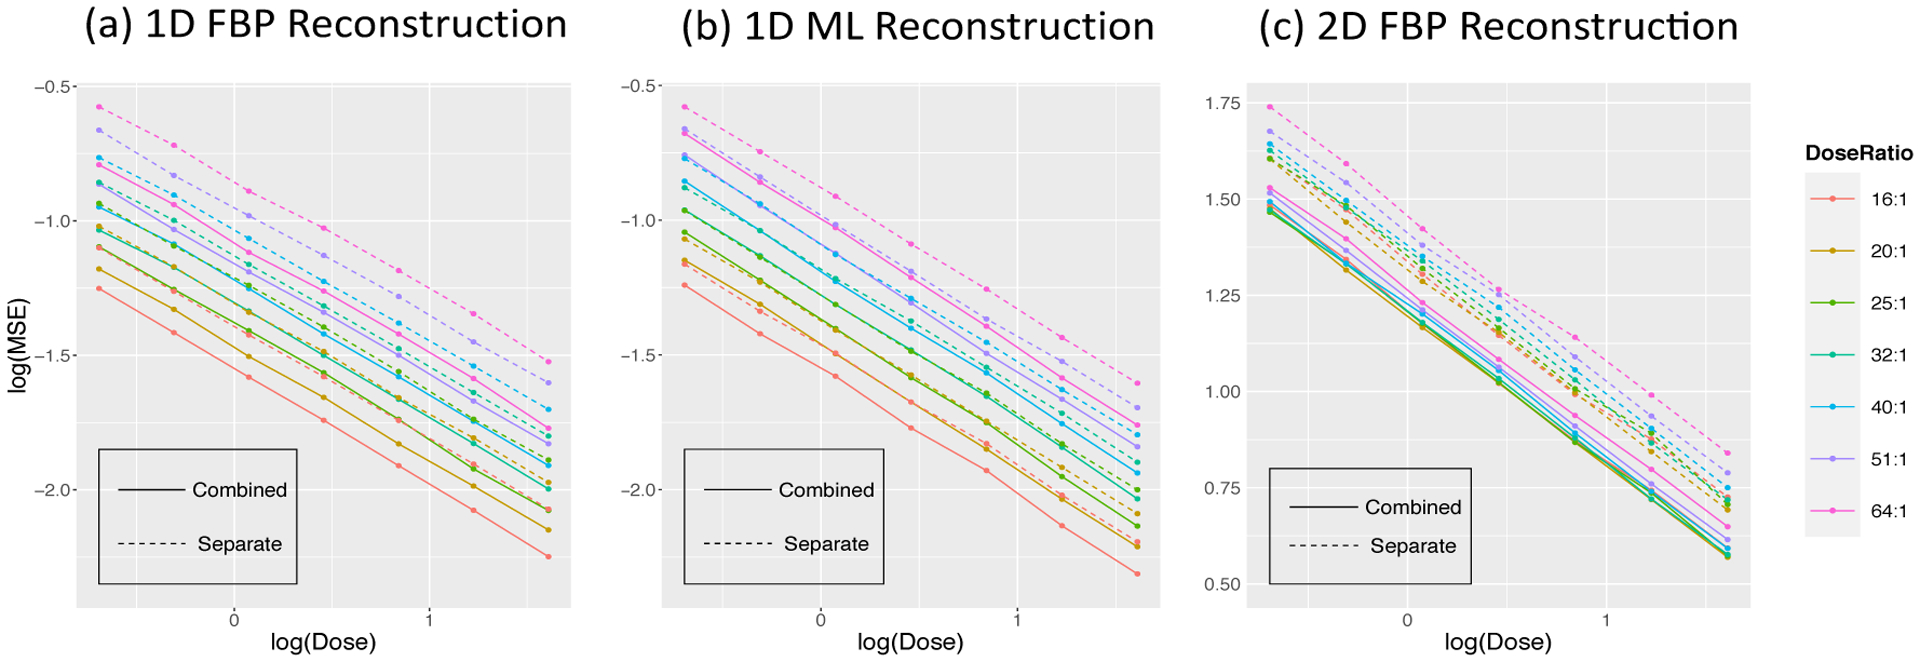
Multiple injection dynamic positron emission tomography (PET) scanning is used in the clinical management of certain groups of patients and in medical research. The analysis of these studies can be approached in two ways: (i) separate analysis of data from individual tracer injections, or (ii), concatenate/pool data from separate injections and carry out a combined analysis. The simplicity of separate analysis has some practical appeal but may not be statistically efficient. We use a linear model framework associated with a kinetic mapping scheme to develop a simplified theoretical understanding of separate and combined analysis. The theoretical framework is explored numerically using both 1D and 2D simulation models. These studies are motivated by the breast cancer flow-metabolism mismatch studies involving15O-water (H2O) and18F-Fluorodeoxyglucose (FDG) and repeat15O-H2O injections used in brain activation investigations. Numerical results are found to be substantially in line with the simple theoretical analysis: mean square error characteristics of alternative methods are well described by factors involving the local voxel-level resolution of the imaging data, the relative activities of the individual scans and the number of separate injections involved. While voxel-level resolution has dependence on scan dose, after adjustment for this effect, the impact of a combined analysis is understood in simple terms associated with the linear model used for kinetic mapping. This is true for both data reconstructed by direct filtered backprojection or iterative maximum likelihood. The proposed analysis has potential to be applied to the emerging long axial field-of-view PET scanners.

Keywords: FBP and ML reconstructions; H2O-FDG dual-tracer study; combined kinetic analysis; dynamic PET; non-parametric residue mapping; repeat H2O study.


Figures

Figure 1:
Figure 1:
Multi-Injection Dynamic PET Studies. A: Separate Analysis; B: Combined Analysis.
Figure 2:
Figure 2:
Non-parametric residue mapping (NPRM) process.
Figure 3:
Figure 3:
Estimates of flow, flux and mismatch in a H2O-FDG breast cancer study from combined and separate analysis. Row A: Combined Analysis; Row B: Separate Analysis; Row C: ROI Analysis.
Figure 4:
Figure 4:
Diagram of Simulation Process
Figure 5:
Figure 5:
Source distribution, λxt=k=1αk(x)μk(t) for 2D simulations. Row 1: α map and normalized time courses (μ) for H2O and FDG. Row 2: True parametric images for flow, flux and mismatch.
Figure 6:
Figure 6:
1-D phantom (mixing coefficients - αk’s) and their projections for H2O-FDG (a,b) and repeat H2O studies (c,d). x-axis is location (1–128) and y-axis is coefficient. Different colors represent different ROIs. Values of the Kety model parameters (K1, K1/k2) used to create simulated time courses are given in the legends for (c) and (d).
Figure 7:
Figure 7:
Fitted time courses and real data for six kinds of tissues - spleen, tumour, myocardium, normal breast, liver and left ventricle (LV). Red and blue lines are fitted time courses for the H2O and FDG studies, respectively. Black points are real data. x and y axis are time (minutes) after injection and activities (MBq/cc).
Figure 8:
Figure 8:
True time courses and simulated image data at middle dose and dose ratio for same six kinds of tissues. Red and blue lines are true time courses for H2O and FDG studies in simulation, respectively. Grey points are simulated data. x and y axis are time (minutes) after injection and activities (MBq/cc).
Figure 9:
Figure 9:
Sample metabolic estimates (at a middle dose setting) based on the FBP and ML reconstruction. x-axis gives location (1–128); y-axis is values of metabolic parameters in 1-D simulations. See Figure 6 for location of different structures. Plots (1) and (2) show flow and flux in H2O-FDG study; (3) and (4) show flow and blood volume (VB) in the repeat 2 H2O studies.
Figure 10:
Figure 10:
MSE of combined (solid) and separate (dashed) analysis as a function of dose and dose ratio in H2O-FDG study. Different colors represent different dose ratios.
Figure 11:
Figure 11:
MSE of combined and separate analysis in multiple H2O studies.
Figure 12:
Figure 12:
MSE values scaled by image data accuracy for combined (solid) and separate (dashed) analysis as a function of dose and dose ratio in H2O-FDG study.
Figure 13:
Figure 13:
MSE values scaled by image data accuracy for combined (solid) and separate (dashed) analysis as a function of dose and number of studies in the repeat H2O setting.
Figure 14:
Figure 14:
Estimated relation between MSE improvements and study dose. Calculation based on (18) with different colors corresponding to a range of possible γτ values.

Similar articles

Cited by

References

    1. Badawi RD, Shi H, Hu P, Chen S, Xu T, Price PM, Ding Y, Spencer BA, Nardo L, Liu W et al. (2019). First human imaging studies with the explorer total-body pet scanner, Journal of Nuclear Medicine 60(3): 299–303. - PMC - PubMed
    1. Beason-Held LL, Desmond RE, Herscovitch P and Carson RE (1999). Bolus injection versus slow infusion of [15o] water for positron emission tomography activation studies, Journal of Cerebral Blood Flow and Metabolism 19(8): 843–852. - PubMed
    1. Black NF, McJames S and Kadrmas DJ (2009). Rapid multi-tracer pet tumor imaging with 18f-fdg and secondary shorter-lived tracers, IEEE Transactions on Nuclear Science 56(5): 2750–2758. - PMC - PubMed
    1. Cunningham VJ and Jones T (1993). Spectral analysis of dynamic pet studies, Journal of Cerebral Blood Flow and Metabolism 13(1): 15–23. - PubMed
    1. Deo AK, Borson S, Link JM, Domino K, Eary JF, Ke B, Richards TL, Mankoff DA, Minoshima S, O’Sullivan F et al. (2014). Activity of p-glycoprotein, a β-amyloid transporter at the blood–brain barrier, is compromised in patients with mild alzheimer disease, Journal of Nuclear Medicine 55(7): 1106–1111. - PMC - PubMed

Publication types

Substances