. 2021 May 28;22(1):285.
doi: 10.1186/s12859-021-04183-8.

A phylogenetic approach for weighting genetic sequences

Affiliations

A phylogenetic approach for weighting genetic sequences

Nicola De Maio et al. BMC Bioinformatics. .

Abstract

Background: Many important applications in bioinformatics, including sequence alignment and protein family profiling, employ sequence weighting schemes to mitigate the effects of non-independence of homologous sequences and under- or over-representation of certain taxa in a dataset. These schemes aim to assign high weights to sequences that are 'novel' compared to the others in the same dataset, and low weights to sequences that are over-represented.

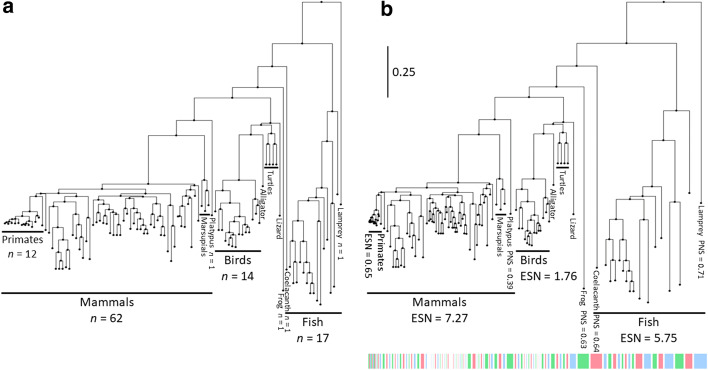
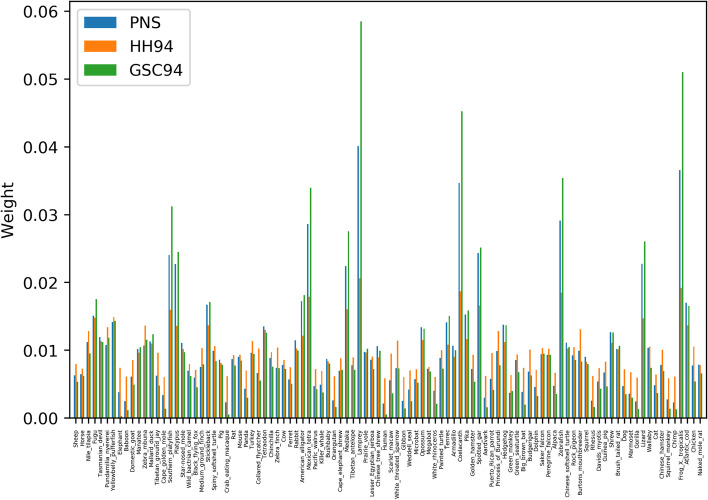
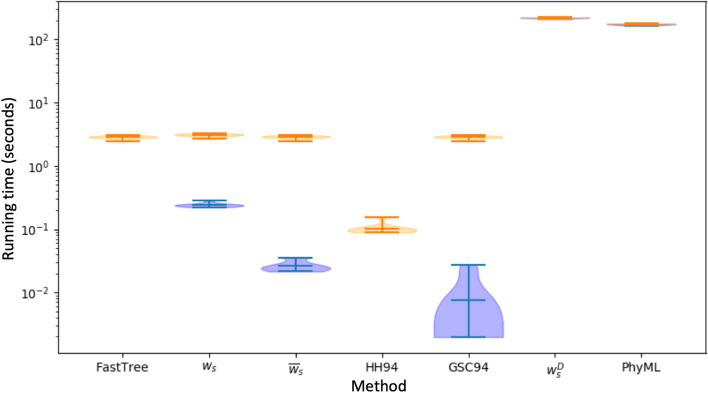
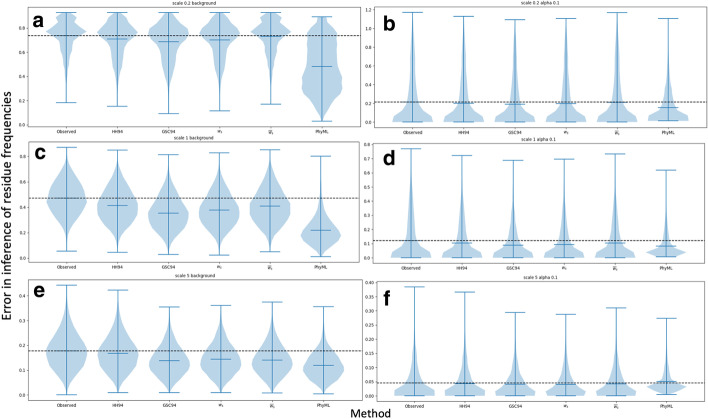
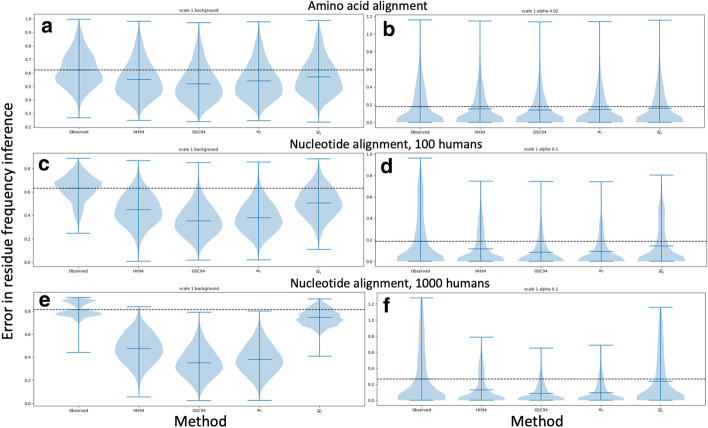
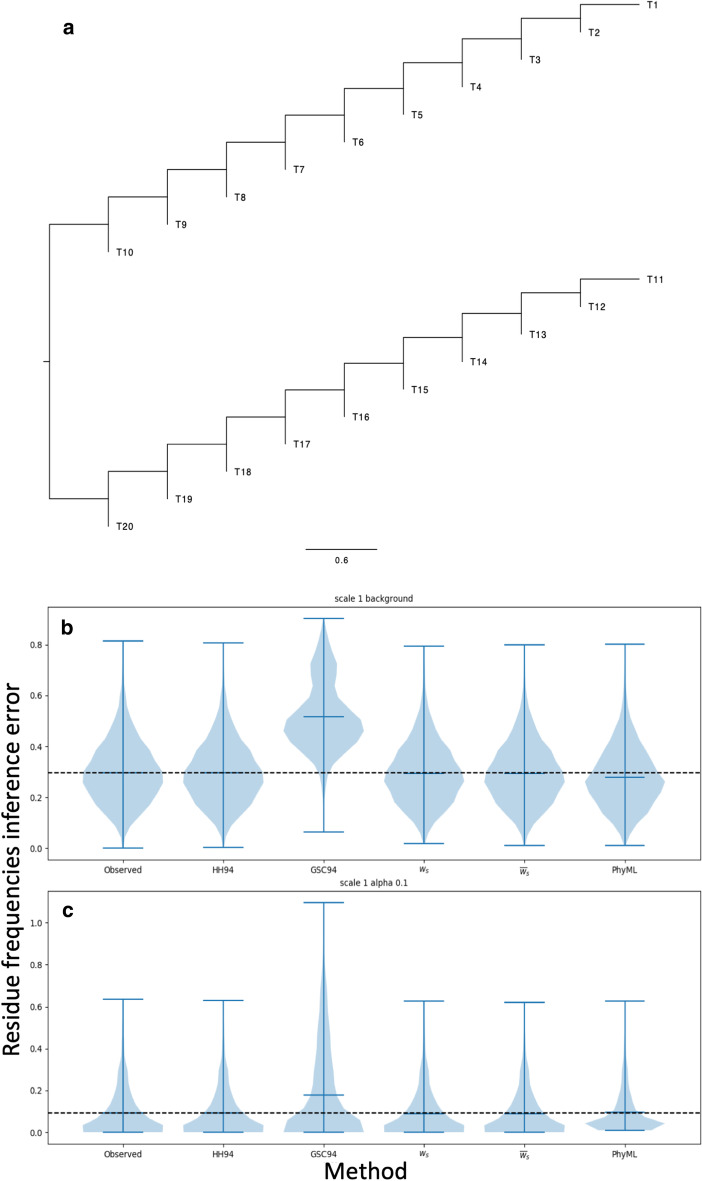
Results: We formalise this principle by rigorously defining the evolutionary 'novelty' of a sequence within an alignment. This results in new sequence weights that we call 'phylogenetic novelty scores'. These scores have various desirable properties, and we showcase their use by considering, as an example application, the inference of character frequencies at an alignment column-important, for example, in protein family profiling. We give computationally efficient algorithms for calculating our scores and, using simulations, show that they are versatile and can improve the accuracy of character frequency estimation compared to existing sequence weighting schemes.

Conclusions: Our phylogenetic novelty scores can be useful when an evolutionarily meaningful system for adjusting for uneven taxon sampling is desired. They have numerous possible applications, including estimation of evolutionary conservation scores and sequence logos, identification of targets in conservation biology, and improving and measuring sequence alignment accuracy.

Keywords: Alignment; Conservation scores; Phylogenetics; Protein profile; Sequence weights.


Conflict of interest statement

The authors declare that they have no competing interests.

Figures

Fig. 1
Fig. 1
Example of PNS for a 100-vertebrates tree. Here we show graphically the values of the phylogenetic novelty scores ws from Eq. 1 for the tips of a tree of 100-vertebrate species. The tree is taken from the UCSC genome browser 100-way alignment of vertebrates to the human genome, downloaded from http://hgdownload.cse.ucsc.edu/goldenPath/hg38/multiz100way/hg38.100way.commonNames.nh. The scale bar indicates 0.25 expected substitutions per site. This tree was also used for simulations in this work. a The tree has all tips spaced uniformly on the horizontal axis, representing the case of no weighting scheme being used. b Tips are spaced horizontally according to their ws weight. The weight of each tip can also be seen in the length of the colored bars. Notice how species in regions of the tree with many close relatives (e.g. mammal, primate and bird clades) have low PNSs, and so take up less space individually. This means the horizontal dimension of the plot now gives more equal representation of the novelty of each sequence and clade, instead of emphasising densely sampled clades. More divergent species with few close relatives (e.g. lamprey, coelacanth, frog and platypus) have higher PNSs and are given more horizontal space, representing the greater novelty of their sequences relative to other species in the tree. Cumulative ESN scores (clade-wise sum of PNSs) are also shown for some clades
Fig. 2
Fig. 2
Comparison of different weighting schemes. Bars show weights assigned to the tips of tree in Fig. 1 (species names on x-axis labels) in the scenario of nucleotide data (1 locus of 1kb) by different weighting schemes: PNS (weights ws), HH94 [5] and GSC94 [9]. Weights from each scheme are normalized so that the sum over taxa is 1
Fig. 3
Fig. 3
Computational demand of different approaches to character frequency estimation. Violin plots summarise the running times, in seconds, of different methods. All analyses were run on a MacBook Pro 2017. Each plot contains values for 10 replicates of the scenario of the unscaled tree in Fig. 1 and nucleotide data. Time cost for computing frequencies from un-weigthed observed characters is not shown as it is negligible. Time demand of Bayesian variants of PNS weights is also not shown, as it is the same as for their non-Bayesian variants (Bayesian variants only require the addition of pseudocounts compared to non-Bayesian variants). ‘FastTree’ represents the cost of running phylogenetic inference with FastTree prior to weight calculation. Orange violin plots show the total cost (including computational cost of phylogenetic inference for methods requiring a phylogeny). Blue violin plots show the cost of calculating the scores without taking into account the cost of phylogenetic tree inference. For wsD and ‘PhyML’, blue and orange plots overlap. Calculating HH94 weights is, overall, the fastest approach among those considered here, as it does not require phylogenetic inference
Fig. 4
Fig. 4
Equilibrium frequency inference error. Comparison of the accuracy of different methods for reconstructing equilibrium frequencies in the basic simulation scenario (nucleotide characters and tree as in Fig. 1). Violin plots summarise the nucleotide frequency inference error (on the y-axis), measured as the Euclidean distance between the vectors of column-specific simulated nucleotide frequencies and inferred ones. Each plot contains 10 replicates, and each replicate contains 800 alignment columns evolved under the background nucleotide frequencies (a, c and e), or 200 alignment columns evolved under equilibrium nucleotide frequencies sampled from a Dirichlet distribution with α=0.1 (b, d and f). Horizontal black dashed lines aid comparison by showing the median error of the first method (frequencies extracted from character counts). In a and b the tree branch lengths were scaled by a factor of 0.2; in c and d by a factor of 1.0; and in e and f by a factor of 5.0. Each plot shows results for a particular character frequency inference method, indicated on the x-axis. Results from additional methods (e.g. Bayesian approaches) are shown in Additional file 1: Fig. S5
Fig. 5
Fig. 5
Equilibrium frequency inference error under different scenarios. Similarly to Fig. 4, we compare the accuracy of different methods for reconstructing equilibrium frequencies. However, here we consider the simulation scenarios of amino acid sequences and modified trees with increased over-representation of human sequences. Values shown are as in Fig. 4. Each plot contains 10 replicates, and each replicate contains 800 alignment columns evolved under the background character frequencies (a, c and e), or 200 alignment columns evolved under equilibrium character frequencies sampled from a Dirichlet distribution with α=0.1 for d and f and α=0.02 for b. In a and b simulations are under the tree in Fig. 1 and with amino acid sequences. In c and d we consider nucleotide sequences and the tree in Fig. 1 with 100 added human sequences (see Methods). In e and f we instead add 1000 human sequences. Results from additional methods (e.g. Bayesian approaches) are shown in Additional file 1: Fig. S5. Results from PhyML are not available, due to excessive computational demand
Fig. 6
Fig. 6
Equilibrium frequency inference error with a strongly non-ultrametric tree. a: The strongly non-ultrametric phylogenetic tree under which simulations for this figure are performed. Some tips of the tree (e.g. T10, T20) are close to the root while others (T1, T11) are considerably more evolutionarily distant; in an ultrametric tree, all tips would instead have the same distance from the root. b and c: Violin plots summarising nucleotide frequency inference error (y-axis), measured as the Euclidean distance between the vectors of column-specific simulated nucleotide frequencies and inferred ones. Each plot contains 10 replicates, and each replicate contains (b) 800 alignment columns evolved under the background nucleotide frequencies, or (c) 200 alignment columns evolved under equilibrium nucleotide frequencies sampled from a Dirichlet distribution with α=0.1. Each plot refers to a particular character frequency inference method, indicated on the x-axis

Similar articles

Cited by

References

    1. Thompson JD, Higgins DG, Gibson TJ, Clustal W. Improving the sensitivity of progressive multiple sequence alignment through sequence weighting, position-specific gap penalties and weight matrix choice. Nucl Acids Res. 1994;22(22):4673–4680. doi: 10.1093/nar/22.22.4673. - DOI - PMC - PubMed
    1. Altschul SF, Madden TL, Schäffer AA, Zhang J, Zhang Z, Miller W, Lipman DJ. Gapped BLAST and PSI-BLAST: a new generation of protein database search programs. Nucl Acids Res. 1997;25(17):3389–3402. doi: 10.1093/nar/25.17.3389. - DOI - PMC - PubMed
    1. Eddy SR. Profile hidden Markov models. Bioinformatics. 1998;14(9):755–763. doi: 10.1093/bioinformatics/14.9.755. - DOI - PubMed
    1. Finn RD, Coggill P, Eberhardt RY, Eddy SR, Mistry J, Mitchell AL, Potter SC, Punta M, Qureshi M, Sangrador-Vegas A, et al. The Pfam protein families database: towards a more sustainable future. Nucl Acids Res. 2015;44(D1):279–285. doi: 10.1093/nar/gkv1344. - DOI - PMC - PubMed
    1. Henikoff S, Henikoff JG. Position-based sequence weights. J Mol Biol. 1994;243(4):574–578. doi: 10.1016/0022-2836(94)90032-9. - DOI - PubMed